

Published 2 Sept 2026 · Updated 15 Sept 2026
 The state pictureVictoria had an estimated resident population of 7,073,859 at 30 June 2025 in the ABS annual series. The state article covers the total, its drivers and the split between Greater Melbourne and the rest of the state.
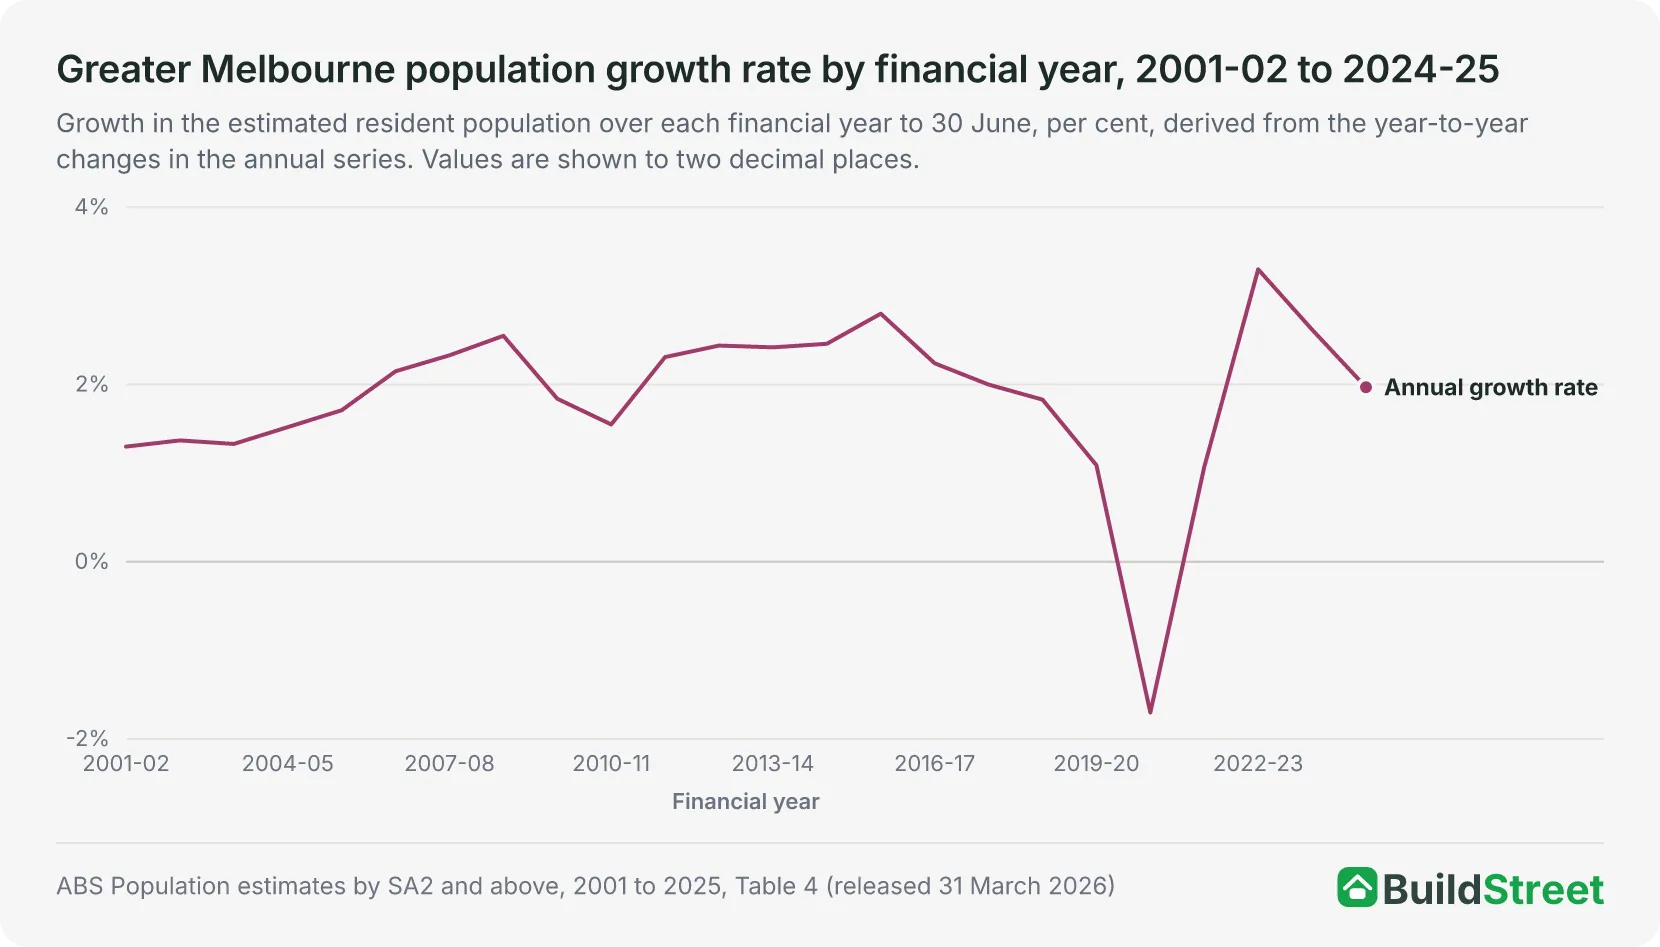 The state capitalThe Melbourne urban area held 5,328,274 people at 30 June 2025, about 17 times Geelong's total. The Melbourne article covers the capital's growth, its drivers and its growth areas.
Section 01 · The headline number
How many people live in Geelong?
The Geelong Significant Urban Area had an estimated resident population of 314,381 at 30 June 2025. It was the largest urban area in Victoria outside Melbourne. Melbourne's urban area had 5,328,274 people at the same date1. Geelong accounted for 4.4 per cent of Victoria's estimated 7,073,859 people, and 1.1 per cent of Australia's 27,613,654 people2.
The ABS publishes population estimates annually for 30 June. In the 2024-25 release, the estimates are final for 2001 to 2021, revised for 2022 to 2024 and preliminary for 20253. The next release, covering 30 June 2026, is due on 25 March 20274.
Section 02 · The pace
How fast is Geelong's population growing?
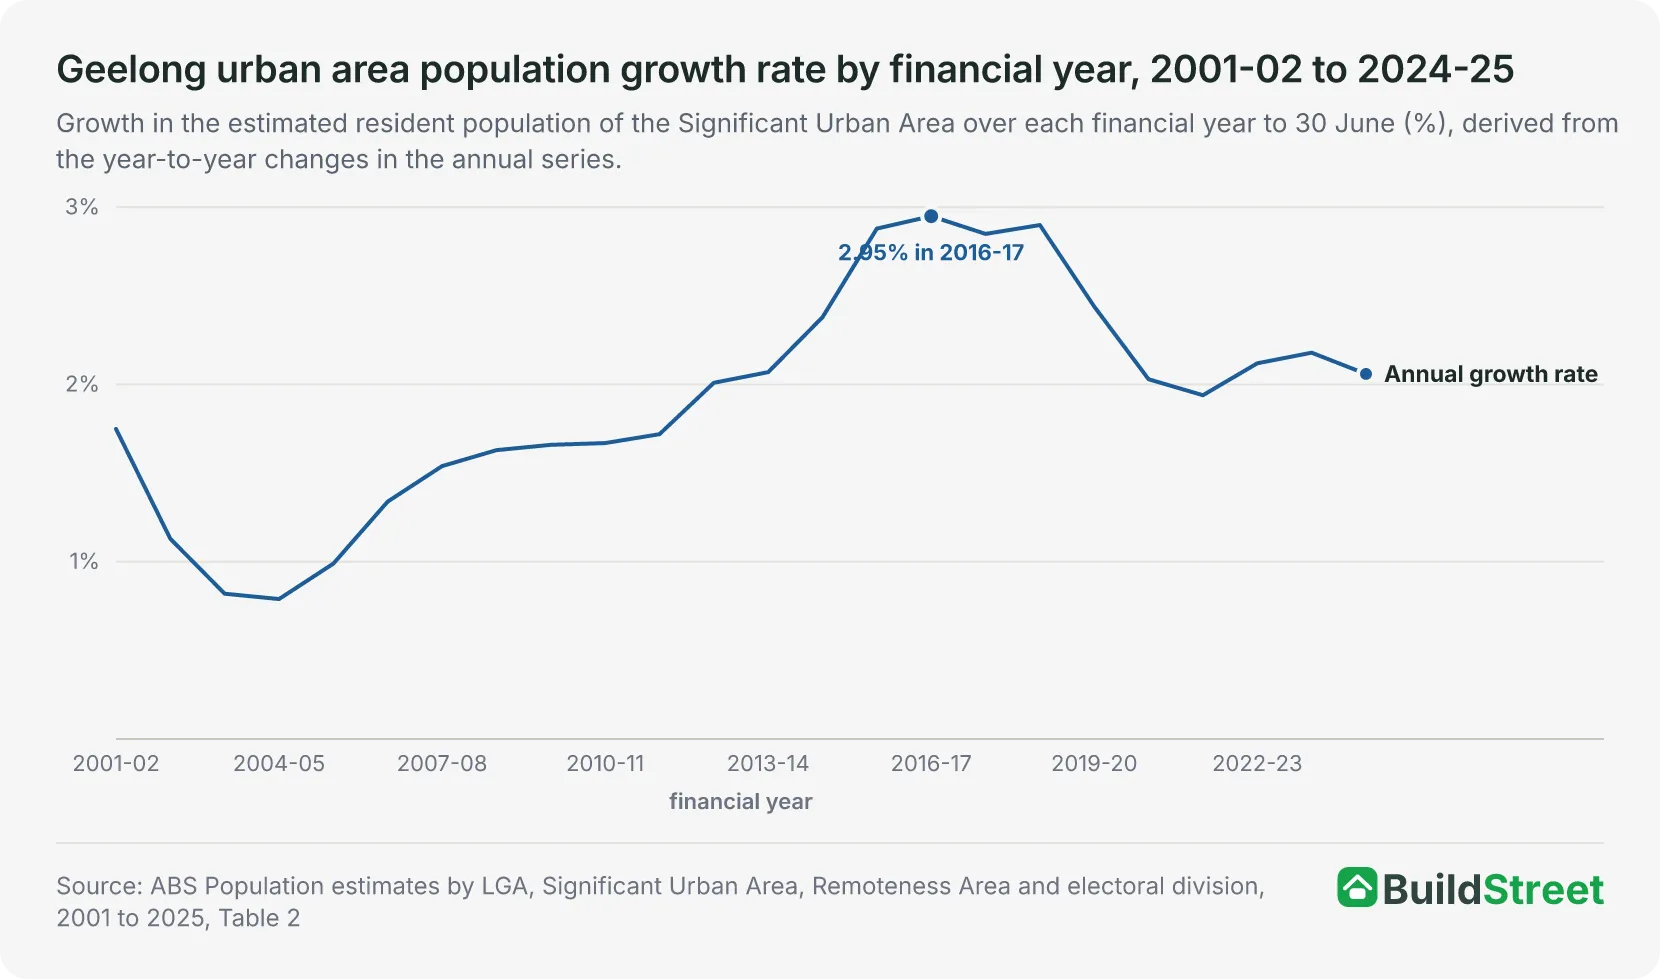
The Geelong urban area added 6,360 people, or 2.06 per cent, in 2024-25, growing from 308,021 to 314,381. The increase was smaller than the 6,578 added in 2023-24 and larger than the 6,263 added in 2022-23 and the 5,614 added in 2021-221.
Growth over the 24 financial years from 2001-02 to 2024-25 ranged from 0.79 per cent to 2.95 per cent. The population increased in every financial year during this period. The highest rate was 2.95 per cent in 2016-17, when the urban area added 7,506 people. The largest increase was 7,804 people (2.90 per cent) in 2018-19, and the lowest rate was 0.79 per cent in 2004-05, when 1,630 people were added, the smallest increase during the period1.
Growth exceeded 2.8 per cent in each of the four financial years from 2015-16 to 2018-19, at 2.88, 2.95, 2.85 and 2.90 per cent. Growth then slowed to 2.44 per cent in 2019-20, 2.03 per cent in 2020-21 and 1.94 per cent in 2021-22. It increased to 2.12 per cent in 2022-23 and 2.18 per cent in 2023-24, before easing to 2.06 per cent in 2024-251.
Section 03 · The drivers
What drives Geelong's population growth?
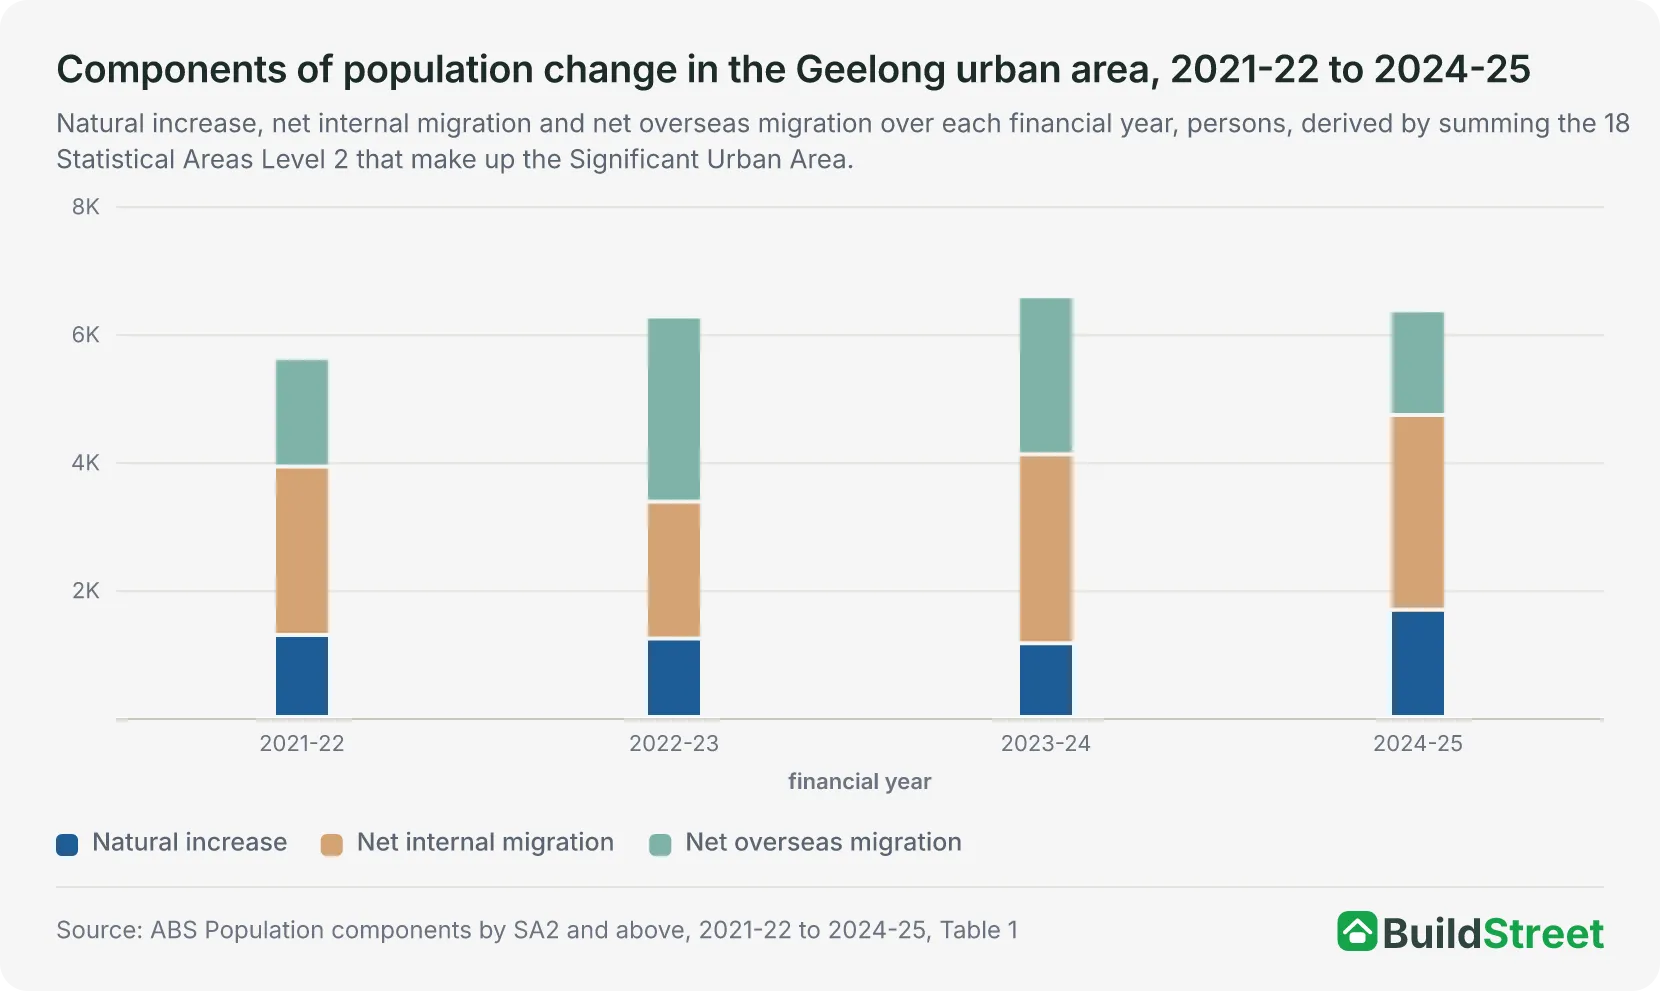
Net internal migration was the largest component of the Geelong urban area's population growth in 2024-25, adding 3,043 people. Natural increase (the excess of births over deaths) added 1,678 people. Net overseas migration (arrivals from overseas less departures) added 1,6395. The three components totalled an increase of 6,360 people.
The ABS publishes components of population change for small areas and council areas rather than urban areas, so the urban-area figures are derived by summing the 18 small areas that make up Geelong's urban boundary.
Net internal migration was the largest component in three of the four years from 2021-22 to 2024-25. It added 2,635 people in 2021-22, 2,138 in 2022-23, 2,957 in 2023-24 and 3,043 in 2024-25. Net overseas migration was the largest component in 2022-23, at 2,896, and fell to 2,468 in 2023-24 and 1,639 in 2024-25. Natural increase ranged from 1,153 in 2023-24 to 1,678 in 2024-256.
On council boundaries, the pattern was the same in the City of Greater Geelong, where net internal migration added 3,281 people in 2024-25, natural increase 1,571 and net overseas migration 1,524, for a total increase of 6,376. Net internal migration was also the largest component in Golden Plains, at 211 people, and in Queenscliffe, at 37. Surf Coast was the exception among the four council areas, with net overseas migration, at 162 people, ahead of net internal migration, at 1467.
| Components of population change by council area, 2024-25 | ||||
|---|---|---|---|---|
| Council area (LGA) | Natural increase | Net internal migration | Net overseas migration | Total change |
| Greater Geelong | +1,571 | +3,281 | +1,524 | +6,376 |
| Surf Coast | +123 | +146 | +162 | +431 |
| Golden Plains | +162 | +211 | +30 | +403 |
| Queenscliffe | -13 | +37 | +10 | +34 |
Source · ABS Population estimates and components by LGA, 2024 to 2025, Table 2
Section 04 · The growth areas
Where in Geelong is the population growing fastest?
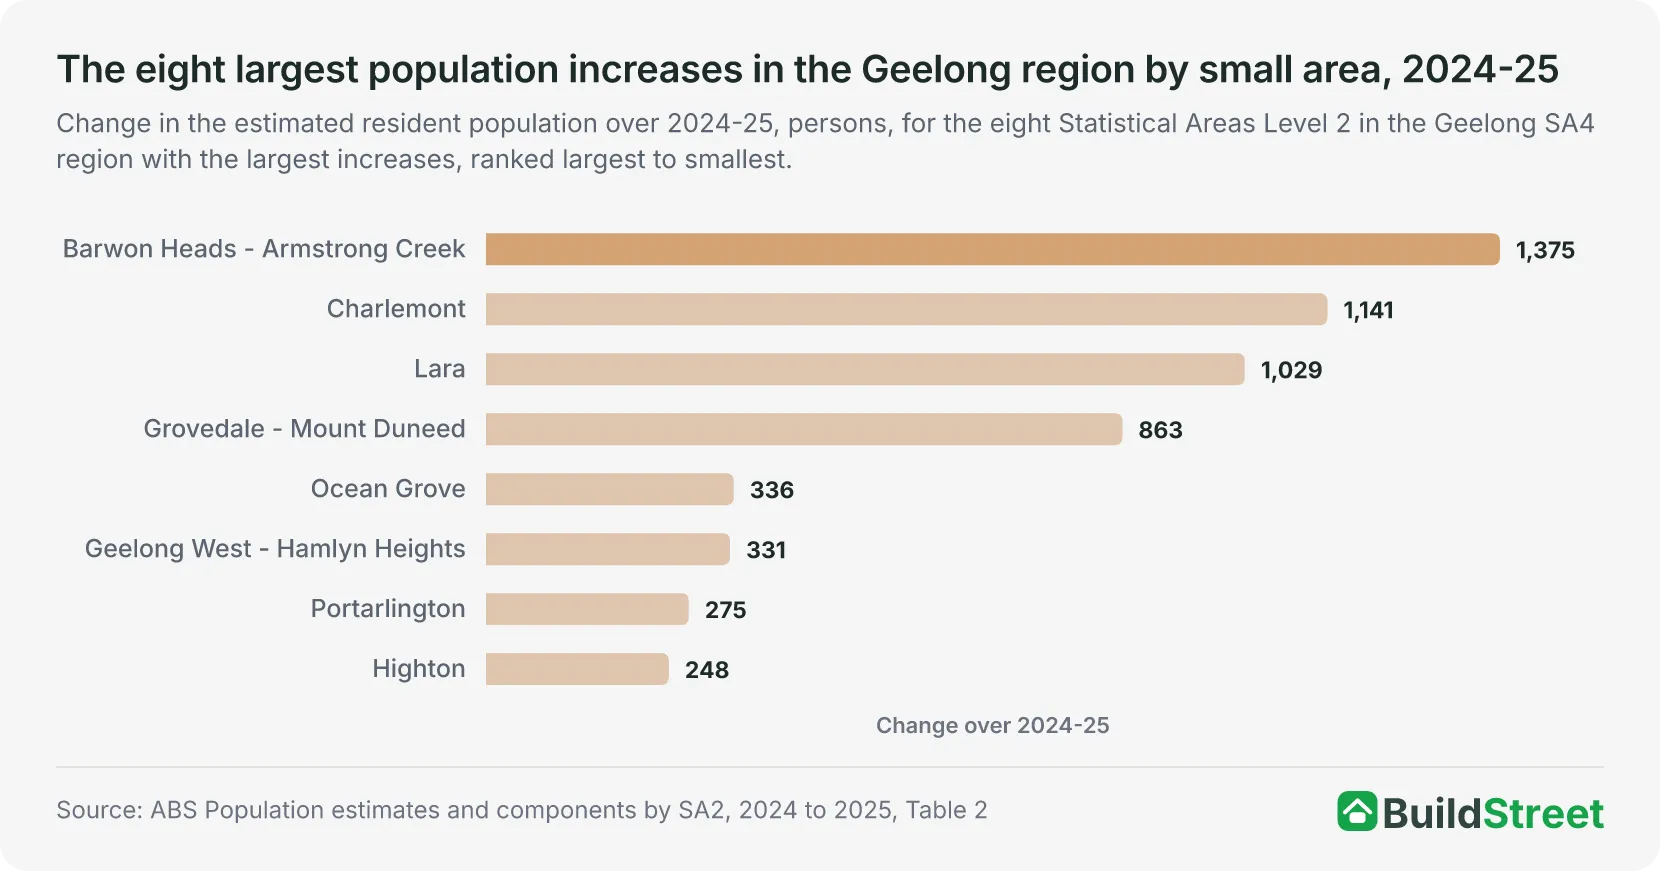
Barwon Heads - Armstrong Creek recorded both the largest increase and the highest growth rate among the 23 small areas in the Geelong region in 2024-25, growing from 14,374 to 15,749 people, an increase of 1,375 (9.6 per cent). Charlemont added 1,141 people (8.2 per cent), Lara 1,029 (4.5 per cent) and Grovedale - Mount Duneed 863 (3.1 per cent)5. All four areas lie within the urban area, and together they accounted for 4,408 of its 6,360 increase, or 69 per cent.
Of the 161 small areas in Victoria outside Greater Melbourne, Barwon Heads - Armstrong Creek had the largest increase and the highest growth rate in 2024-25, followed by Charlemont on both measures. Delacombe, in the Ballarat region, was third on both, at 1,037 people and 7.3 per cent5.
Net internal migration accounted for most of the increase in each of the four fastest-growing areas. It accounted for 1,116 of the 1,375 increase in Barwon Heads - Armstrong Creek, 895 of Charlemont's 1,141, 710 of Lara's 1,029 and 552 of Grovedale - Mount Duneed's 863. Norlane was the only one of the 23 small areas to lose population, falling from 8,906 to 8,833, a decrease of 73 people (0.8 per cent)5.
Among the four council areas in and around Geelong, Greater Geelong grew fastest in 2024-25, at 2.2 per cent, followed by Golden Plains at 1.5 per cent, Surf Coast at 1.1 per cent and Queenscliffe at 1.0 per cent7.
| The four largest population increases in the Geelong region by small area, 2024-25 | |||||
|---|---|---|---|---|---|
| Small area | District | 30 June 2024 | 30 June 2025 | Change | Growth rate % |
| Barwon Heads - Armstrong Creek | Surf Coast - Bellarine Peninsula | 14,374 | 15,749 | +1,375 | 9.6 |
| Charlemont | Geelong | 13,969 | 15,110 | +1,141 | 8.2 |
| Lara | Geelong | 22,923 | 23,952 | +1,029 | 4.5 |
| Grovedale - Mount Duneed | Geelong | 27,722 | 28,585 | +863 | 3.1 |
Source · ABS Population estimates and components by SA2, 2024 to 2025, Table 2
Section 05 · The state picture
How does Geelong compare with other cities in Victoria?
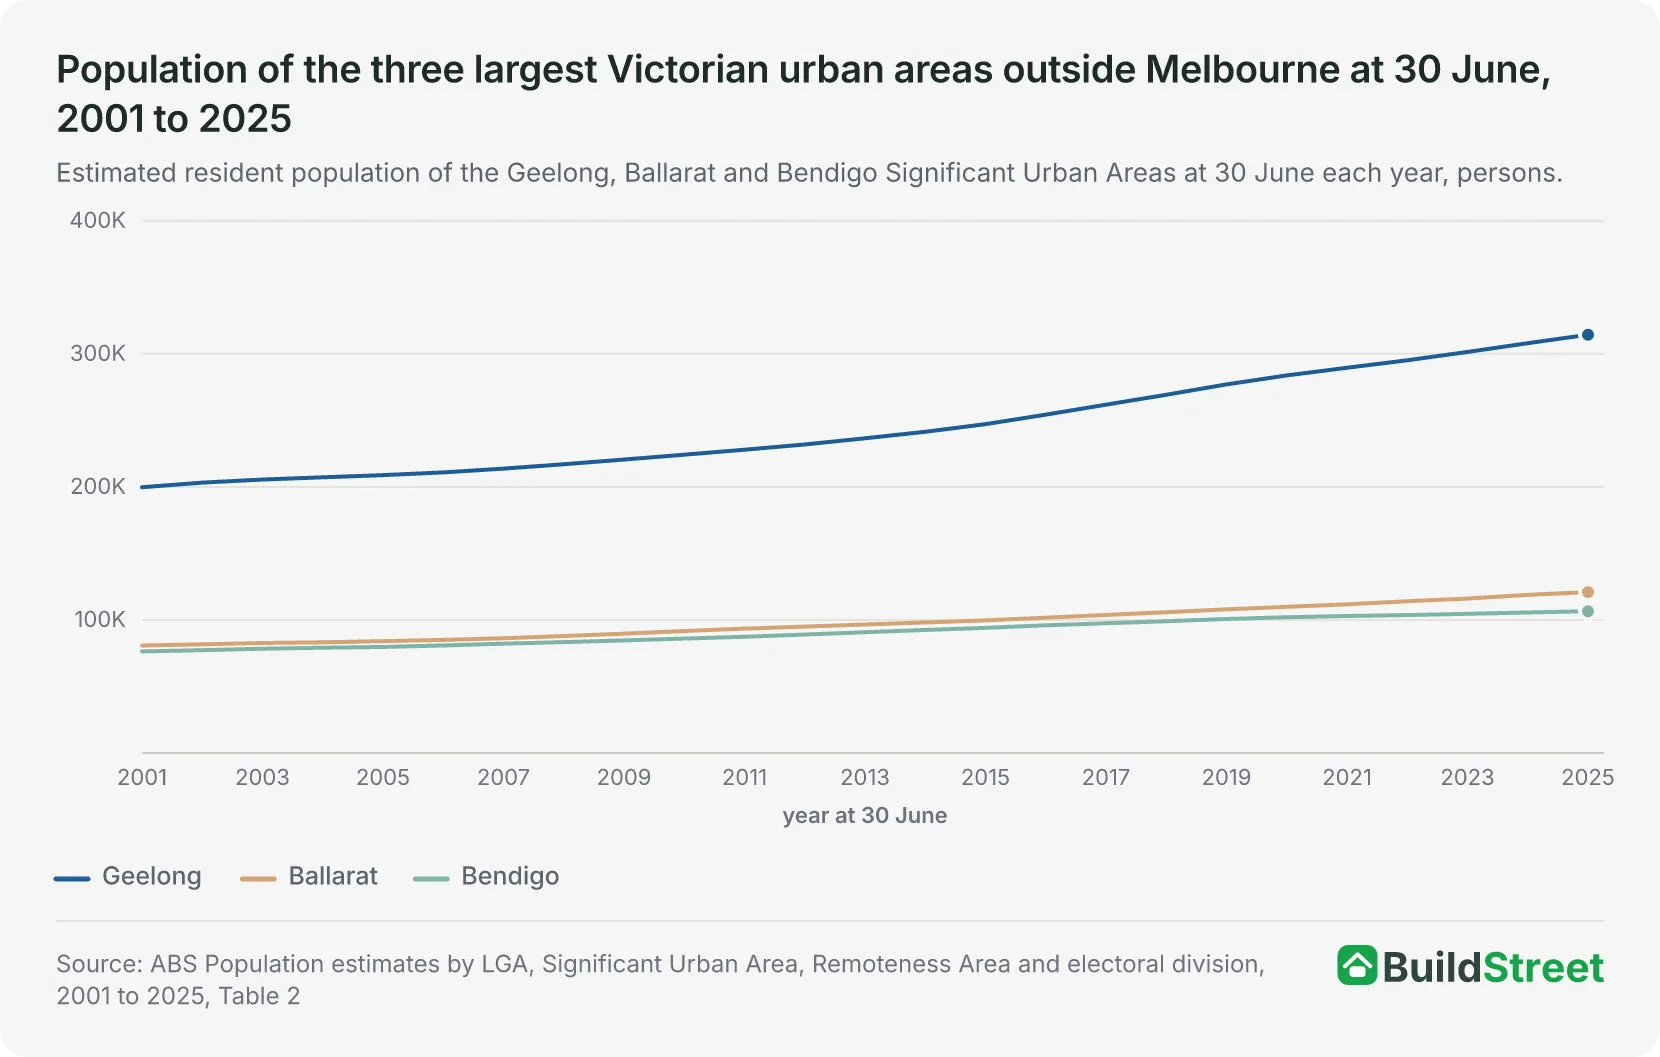
Geelong was the second largest of the 21 urban areas in Victoria at 30 June 2025, behind Melbourne. Melbourne had 5,328,274 people, compared with 314,381 in Geelong, 120,939 in Ballarat and 106,493 in Bendigo. Geelong's population was 2.6 times Ballarat's. Shepparton - Mooroopna and Mildura - Buronga were the next largest, with 55,332 and 54,379 people respectively1. Albury - Wodonga had 102,435 people and crosses the New South Wales border.
The gap between Geelong and Ballarat widened from 118,958 people at 30 June 2001 to 193,442 at 30 June 2025. Bendigo grew from 76,312 to 106,493 over the same period and remained the fourth largest of Victoria's listed urban areas throughout1.
Geelong also grew faster than the state's other three urban areas with 100,000 or more people in 2024-25. Its growth rate was 2.06 per cent, compared with 1.97 per cent for Melbourne, 1.77 per cent for Ballarat and 0.84 per cent for Bendigo1. Among Victoria's 21 urban areas, only Gisborne, at 2.61 per cent, and Bacchus Marsh, at 2.45 per cent, grew faster. Across Victoria outside Greater Melbourne, the population grew from 1,620,401 to 1,638,269 over 2024-25, an increase of 17,868, or 1.10 per cent. The ABS rounds this increase to 17,900 people, or 1.1 per cent4. The Geelong urban area is entirely within this region and accounted for 6,360 of the 17,868 increase, or 35.6 per cent.
Section 06 · The national rank
Where does Geelong rank among Australia's largest cities?
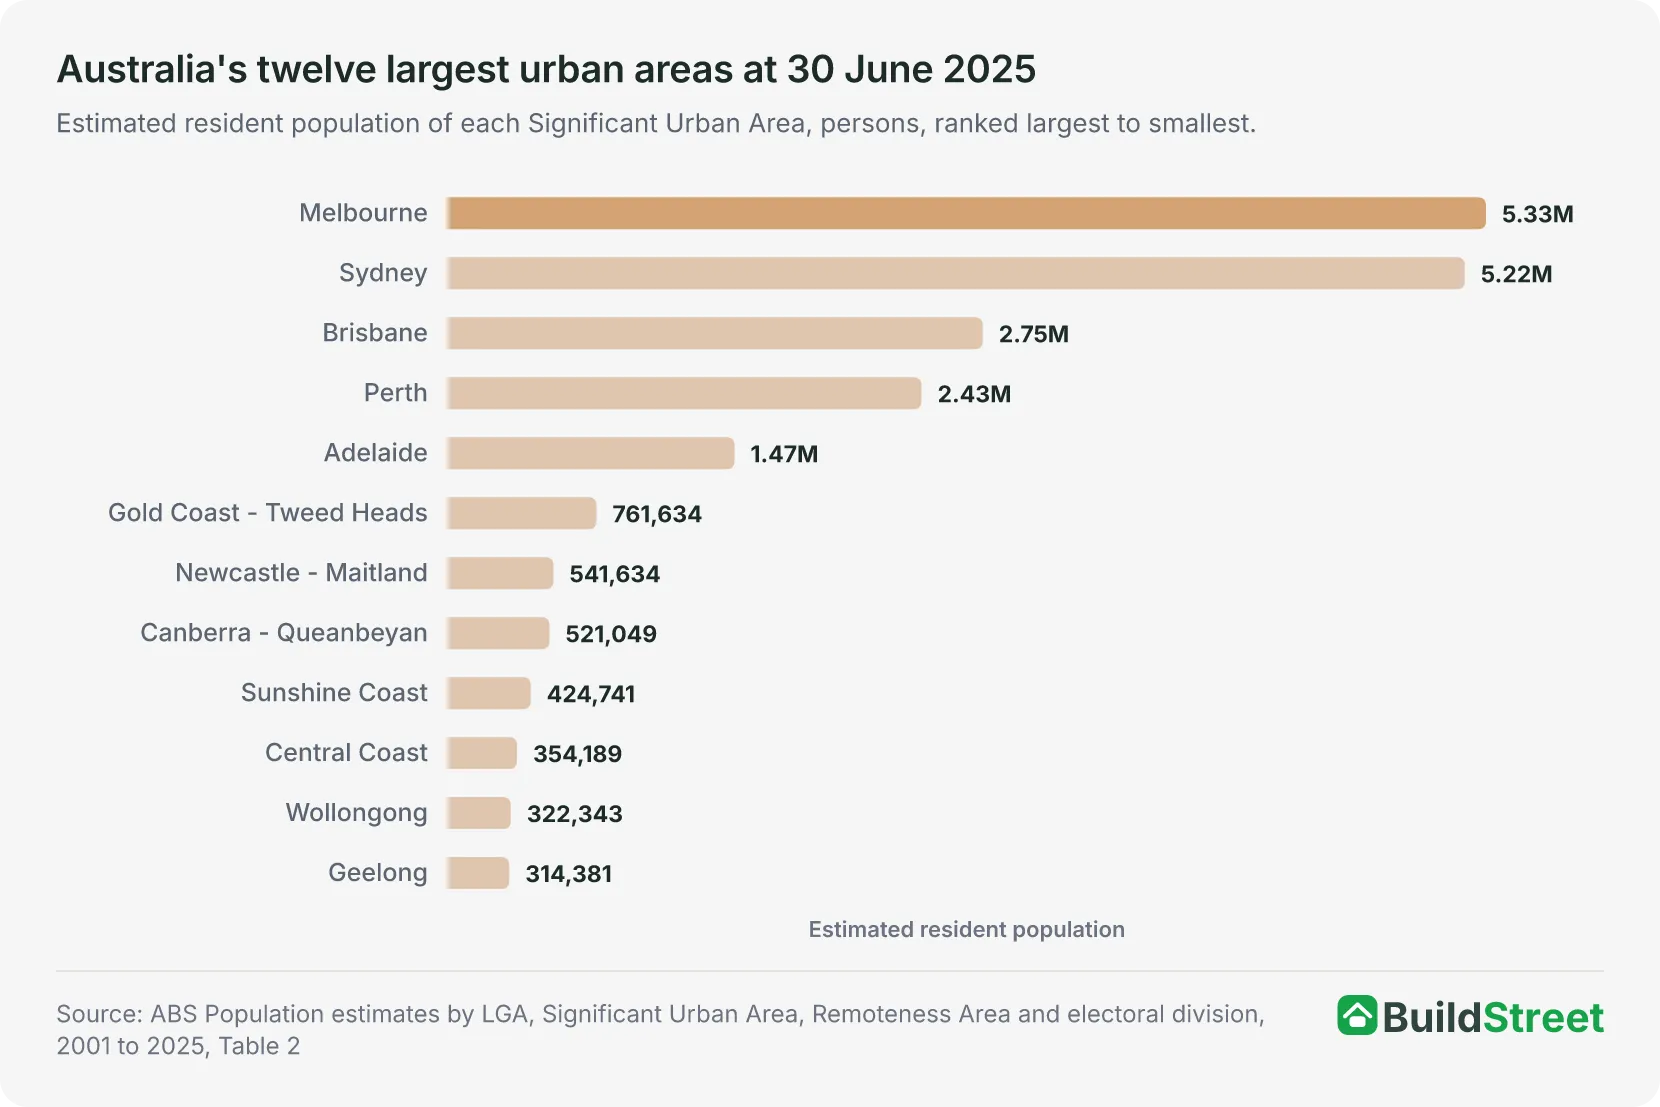
Geelong was Australia's twelfth-largest urban area at 30 June 2025, with 314,381 people. The Central Coast was tenth, with 354,189 people, and Wollongong was eleventh, with 322,3431. Geelong ranked ahead of the Hobart urban area, at 233,736, and Darwin, at 145,019.
These figures use urban-area boundaries, which differ from the broader boundaries used for capital-city population figures. Greater Melbourne, for example, had 5,435,590 people at the same date2, against 5,328,274 for the Melbourne urban area1.
Among the urban areas without a capital city, Geelong was the sixth largest, behind Gold Coast - Tweed Heads, Newcastle - Maitland, the Sunshine Coast, the Central Coast and Wollongong. Geelong's 2024-25 growth rate of 2.06 per cent was the third highest among the 20 urban areas with at least 100,000 people, behind Perth at 2.40 per cent and Brisbane at 2.08 per cent, and its increase of 6,360 people was the ninth largest among all 102 urban areas1.
The gap between Wollongong and Geelong narrowed from 60,923 people at 30 June 2001 to 7,962 at 30 June 2025. It narrowed in every year except 2007-08. In 2024-25, Geelong added 6,360 people (2.06 per cent) against Wollongong's 3,642 (1.14 per cent)1.
Wollongong's population data is covered in the Wollongong population article.
| Australia's twelve largest urban areas, as at 30 June 2025 | |||
|---|---|---|---|
| Urban area (SUA) | Population | Change over 2024-25 | Growth rate % |
| Melbourne | 5,328,274 | +102,910 | 1.97 |
| Sydney | 5,219,674 | +70,670 | 1.37 |
| Brisbane | 2,745,086 | +56,017 | 2.08 |
| Perth | 2,430,757 | +56,991 | 2.40 |
| Adelaide | 1,470,938 | +18,417 | 1.27 |
| Gold Coast - Tweed Heads | 761,634 | +12,279 | 1.64 |
| Newcastle - Maitland | 541,634 | +6,953 | 1.30 |
| Canberra - Queanbeyan | 521,049 | +5,894 | 1.14 |
| Sunshine Coast | 424,741 | +8,018 | 1.92 |
| Central Coast | 354,189 | +2,401 | 0.68 |
| Wollongong | 322,343 | +3,642 | 1.14 |
| Geelong | 314,381 | +6,360 | 2.06 |
Source · ABS Population estimates by LGA, Significant Urban Area, Remoteness Area and electoral division, 2001 to 2025, Table 2
Section 07 · The long run
How has Geelong's population changed since 2001?
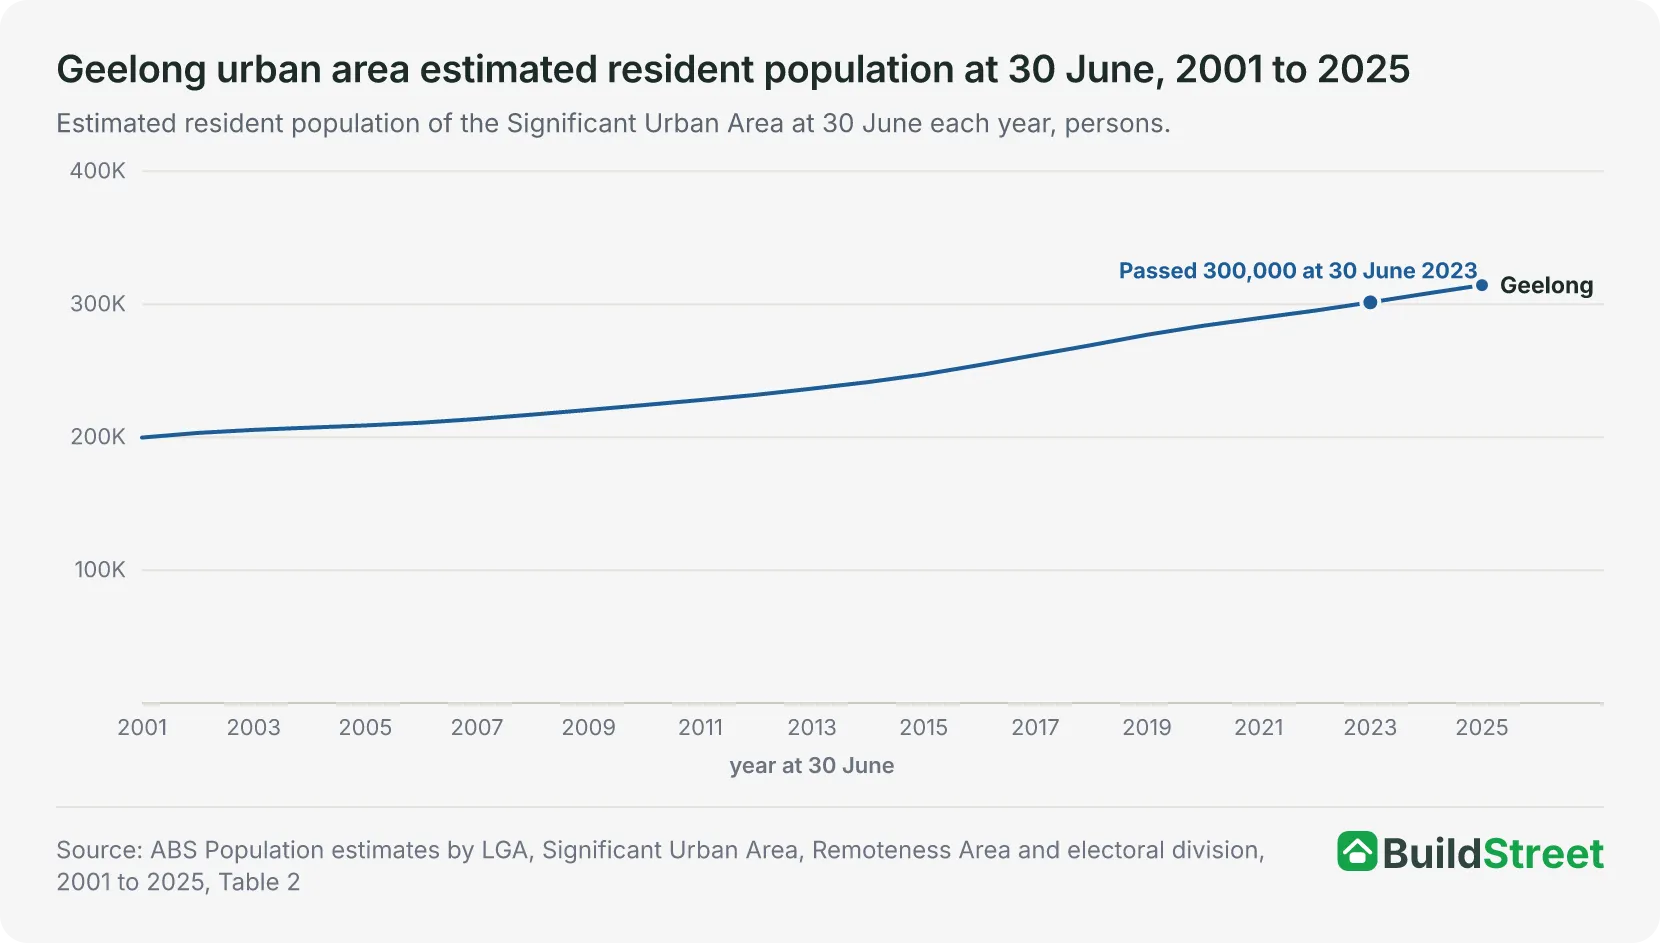
The Geelong urban area added 114,649 people from 30 June 2001 to 30 June 2025, growing from 199,732 to 314,381. The 2025 population was 57.4 per cent higher than in 20011.
The population first passed 200,000 at 30 June 2002, 225,000 at 30 June 2011, 250,000 at 30 June 2016, 275,000 at 30 June 2019 and 300,000 at 30 June 20231. The intervals between milestones were nine years, then five, then three, then four.
On council-area boundaries, the City of Greater Geelong grew from 191,534 at 30 June 2001 to 295,052 at 30 June 2025, and it first reached 250,000 at 30 June 2018 and 275,000 at 30 June 2022. It was the third largest of Victoria's 79 council areas at 30 June 2025, behind Casey at 414,929 and Wyndham at 347,8301.
Charlemont and Barwon Heads - Armstrong Creek, two of the four small areas with the largest population increases in 2024-25, were the smallest and the third smallest of the 23 small areas in the Geelong region at 30 June 2001. Charlemont grew from 1,177 people at 30 June 2001 to 15,110 at 30 June 2025, or 12.8 times its 2001 population. Barwon Heads - Armstrong Creek grew from 3,388 to 15,749 over the same period, or 4.6 times its 2001 population2.
| Geelong urban area population milestones in the annual series | ||
|---|---|---|
| Milestone | First 30 June at or above | Population that year |
| 200,000 | 30 June 2002 | 203,222 |
| 225,000 | 30 June 2011 | 227,957 |
| 250,000 | 30 June 2016 | 254,296 |
| 275,000 | 30 June 2019 | 277,059 |
| 300,000 | 30 June 2023 | 301,443 |
Source · ABS Population estimates by LGA, Significant Urban Area, Remoteness Area and electoral division, 2001 to 2025, Table 2
Section 08
Geelong population: quick answers
How many people live in Geelong?
The Geelong Significant Urban Area had an estimated resident population of 314,381 at 30 June 2025. It was the largest urban area in Victoria outside Melbourne and the twelfth largest in Australia. The 30 June 2025 estimates are preliminary. The next release, covering 30 June 2026, is due on 25 March 2027.
Is Geelong the second largest city in Victoria?
Yes. Geelong was the second largest of Victoria's 21 listed urban areas at 30 June 2025, with 314,381 residents, behind Melbourne's urban area at 5,328,274. Ballarat, at 120,939, and Bendigo, at 106,493, were the next largest. Albury - Wodonga, at 102,435, crosses the border and is listed under New South Wales in the ABS data.
How fast is Geelong's population growing?
The Geelong urban area added 6,360 people, or 2.06 per cent, in 2024-25. The population increased in every year from 2001-02. The highest growth rate was 2.95 per cent in 2016-17 and the largest increase was 7,804 people in 2018-19. The 2024-25 rate was the third highest among the 20 Australian urban areas with 100,000 or more people.
What is the difference between the Geelong urban area and the City of Greater Geelong?
The Geelong urban area is an ABS-defined urban boundary and had 314,381 people at 30 June 2025. The City of Greater Geelong is a local government area with a different boundary, and it had 295,052 people on the same date. The population figures for the two areas are not interchangeable.
Is Geelong bigger than Wollongong?
No. Wollongong's urban area had 322,343 people at 30 June 2025 and Geelong's had 314,381, a gap of 7,962 people. The gap was 60,923 at 30 June 2001 and narrowed in every year except 2007-08. In 2024-25, Geelong added 6,360 people and Wollongong 3,642.
When did Geelong's population pass 300,000?
The Geelong urban area first reached 300,000 people at 30 June 2023, when the population was 301,443 residents. It first reached 250,000 at 30 June 2016 and 275,000 at 30 June 2019. The City of Greater Geelong council area, which uses a different boundary, had 295,052 at 30 June 2025 and had not reached 300,000.
Section 09
Australia population statistics
- Alice Springs population
- Australia population
- Ballarat population
- Brisbane population
- Byron Bay population
- Canberra population
- Gold Coast population
- Newcastle population
- Perth population
- Queensland population
- Sunshine Coast population
- Toowoomba population
- Townsville population
- Victoria population
- Wollongong population
References
- ABS Regional population, 2024-25: population estimates by LGA and Significant Urban Area, 2001 to 2025 (datacube 32180DS0004) · Australian Bureau of Statistics ↑ b c d e f g h i j k l m n o
- ABS Regional population, 2024-25: population estimates by SA2 and above, 2001 to 2025 (datacube 32180DS0003) · Australian Bureau of Statistics ↑ b c d
- ABS Regional population methodology, 2024-25 · Australian Bureau of Statistics ↑ b
- ABS Regional population, 2024-25 · Australian Bureau of Statistics ↑ b
- ABS Regional population, 2024-25: population estimates and components by SA2, 2024 to 2025 (datacube 32180DS0001) · Australian Bureau of Statistics ↑ b c d
- ABS Regional population, 2024-25: population components by SA2 and above, 2021-22 to 2024-25 (datacube 32180DS0005) · Australian Bureau of Statistics ↑
- ABS Regional population, 2024-25: population estimates and components by LGA, 2024 to 2025 (datacube 32180DS0002) · Australian Bureau of Statistics ↑ b
