

Published 31 Aug 2026
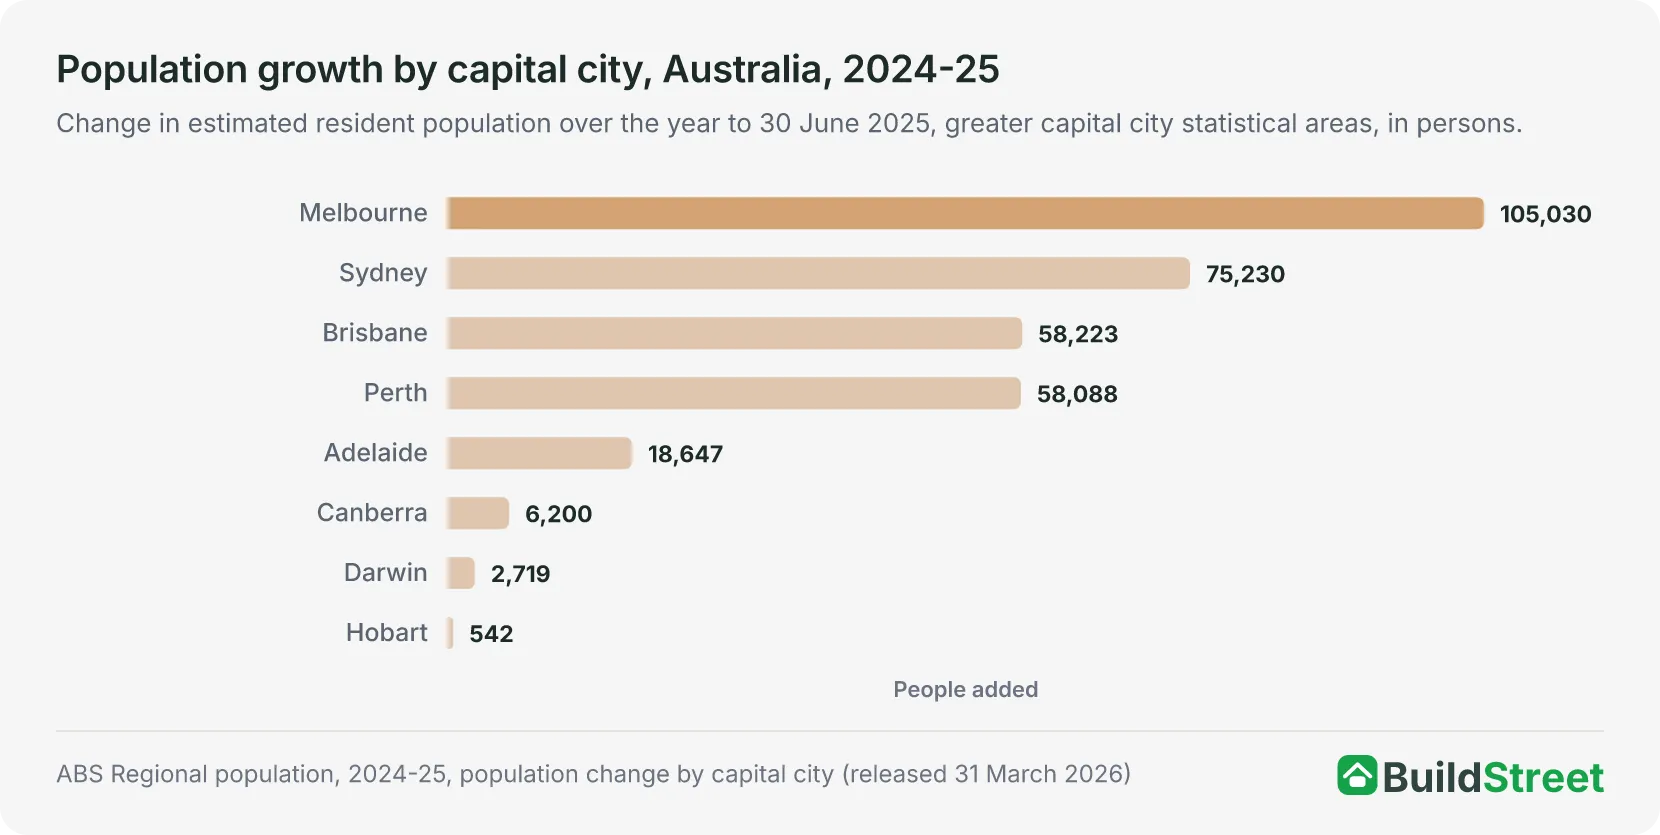 How other cities compareMelbourne added the most people of any capital in 2024-25 and Perth grew at the fastest rate, while Hobart's 542-person increase was the smallest. The cities article ranks growth across Australia's capitals and regional centres.
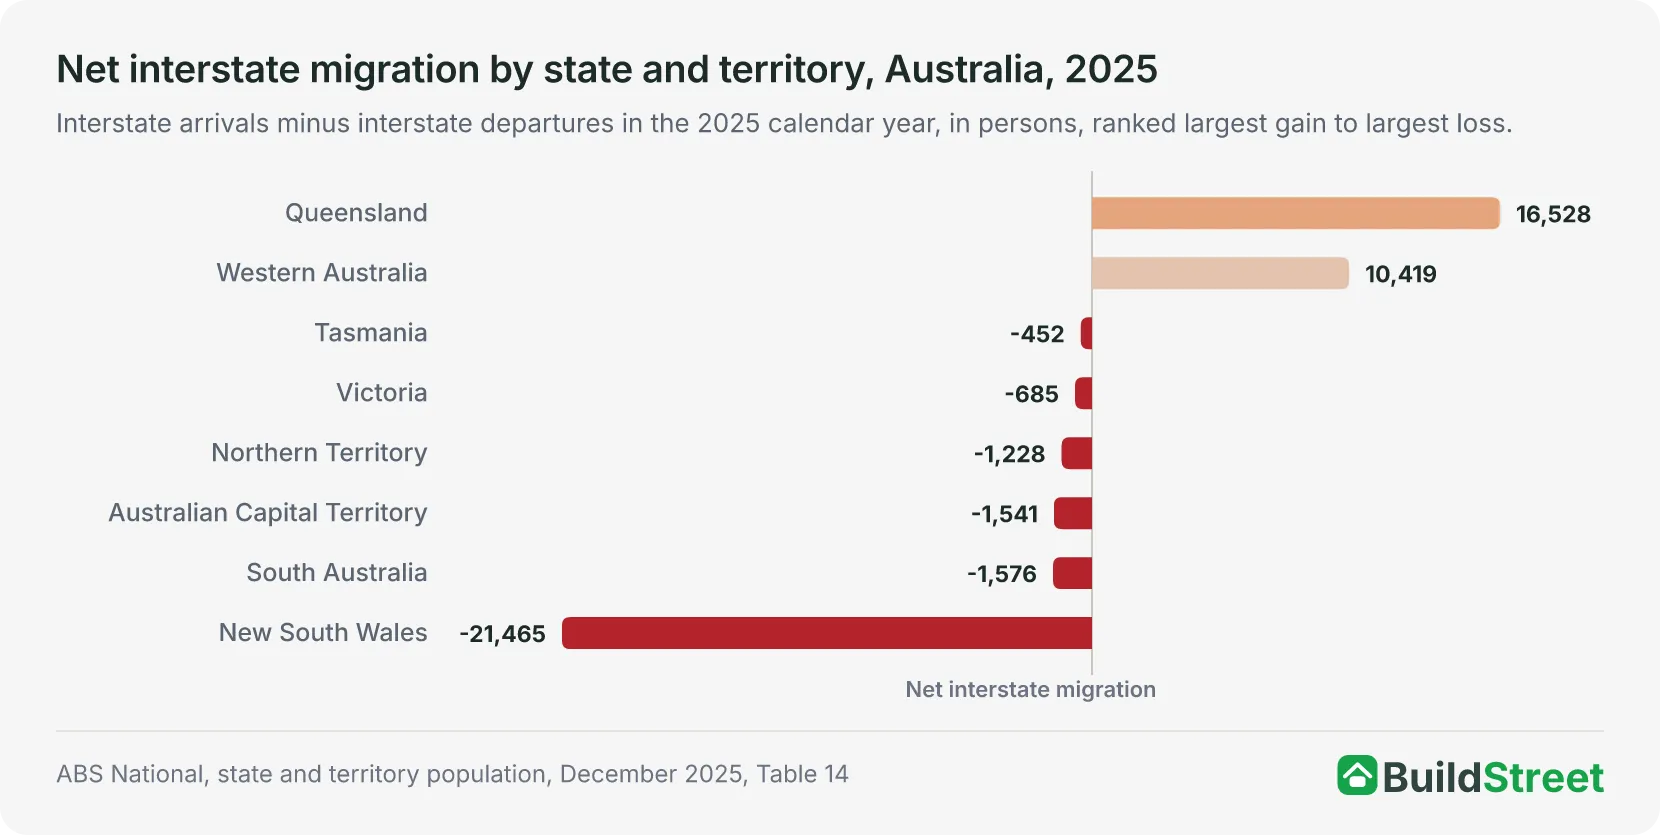 Moves between states and territoriesNet internal migration subtracted 1,878 people from Greater Hobart in 2024-25. The interstate migration article covers the annual state-to-state flows for all eight states and territories.
Section 01 · The headline number
How many people live in Hobart?
Greater Hobart had an estimated resident population of 255,250 at 30 June 20251. That was the smallest population of the six state capital cities and the seventh largest of all eight capitals. Darwin, a territory capital, was the only capital with fewer people, at 159,284, and Canberra, the sixth largest, had 484,630. Greater Hobart accounted for 0.92 per cent of Australia's 27,613,654 people at 30 June 20252.
The ABS updates the city's population at 30 June each year, and the 30 June 2025 figures are preliminary and subject to revision. The next release, covering 30 June 2026, is due on 25 March 20271.
Section 02 · The pace
How fast is Hobart's population growing?
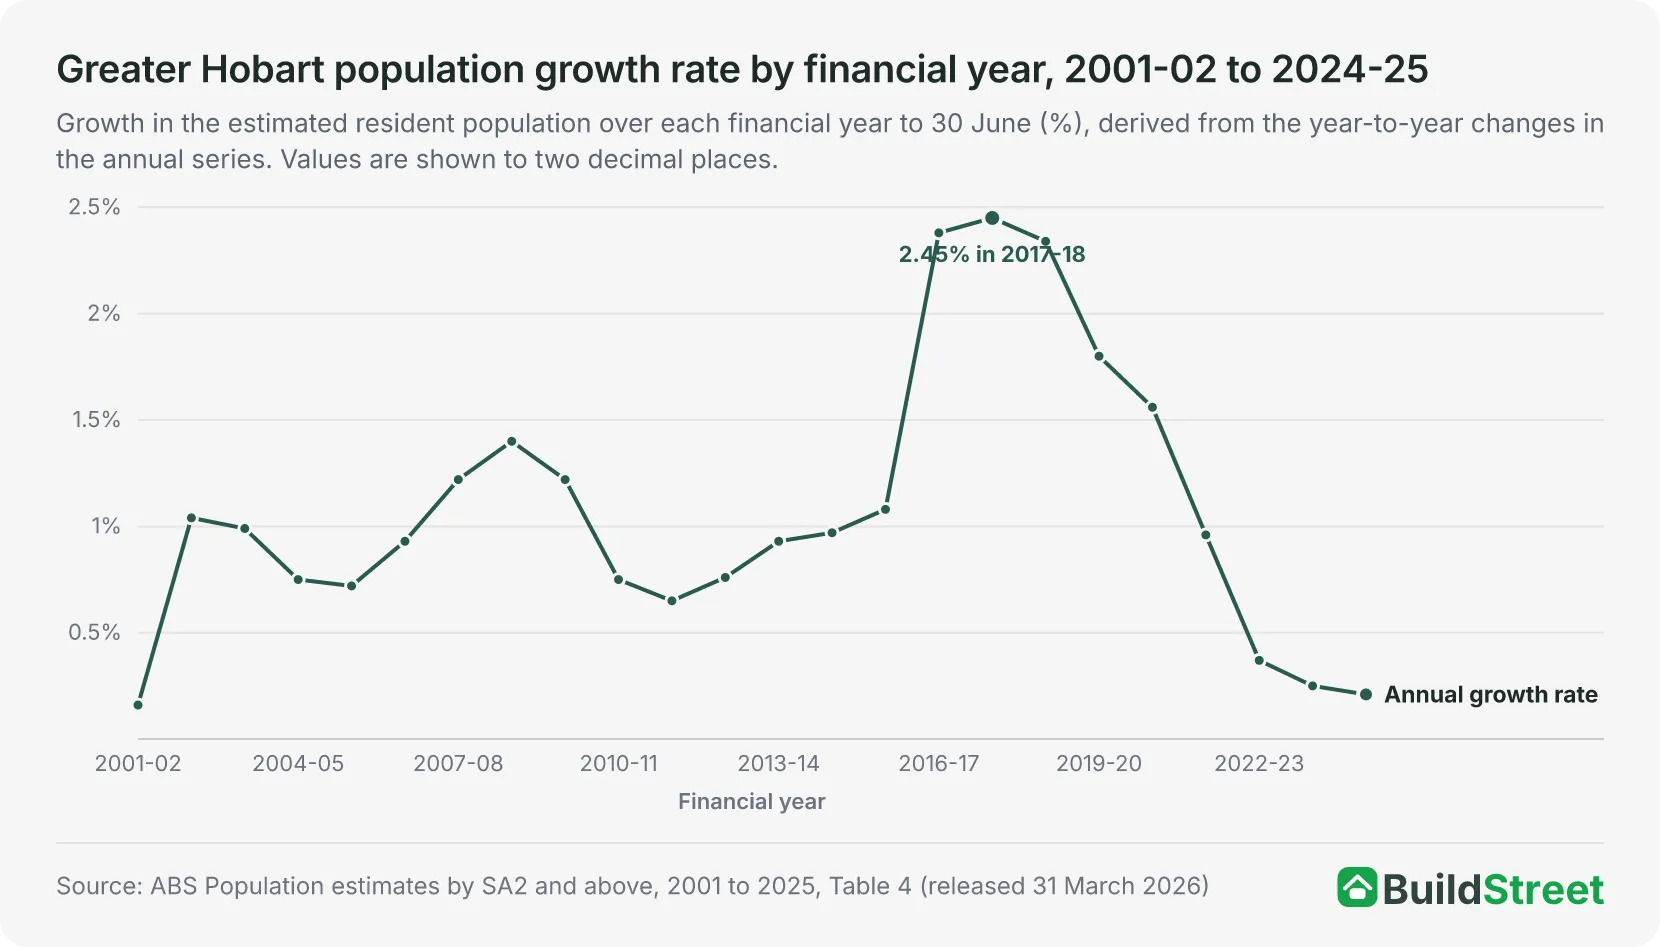
Greater Hobart added 542 people, or 0.21 per cent, over the 2024-25 financial year. The ABS capital city data rounds the growth rate to 0.2 per cent, while Tasmania rounds the increase to 540 people. The increase was the smallest and the rate the slowest of the eight capital cities. Adelaide, the next slowest, grew 1.27 per cent2. Hobart's increase was also the city's smallest annual increase since 2001-02, when it added 323 people.
Annual population growth over the 24 financial years from 2001-02 to 2024-25 ranged from 0.16 per cent to 2.45 per cent, and the population increased in every year over the period. The highest growth rate was recorded in 2017-18, when the city added 5,663 people (2.45 per cent), the largest increase and the highest rate over the period. The three years from 2016-17 to 2018-19 were the only years with growth above 2 per cent2.
The annual increase declined in each of the seven years after the 2017-18 peak, from 5,663 people to 5,544 in 2018-19, 4,361 in 2019-20, 3,858 in 2020-21, 2,417 in 2021-22, 943 in 2022-23, 631 in 2023-24 and 542 in 2024-252.
Section 03 · The drivers
What drives Hobart's population change?
Three components make up the city's population change. In 2024-25, net overseas migration added 1,833 people to Greater Hobart. Natural increase (the excess of births over deaths) added 587 people. Net internal migration (moves to and from elsewhere in Australia) subtracted 1,8783. Together, the three components account for the 542-person increase, matching the change in the population.
The city recorded a net internal migration loss from 2021-22 to 2024-25. The net loss was 301 people in 2021-22, 2,536 in 2022-23, 2,414 in 2023-24 and 1,878 in 2024-25. Net overseas migration exceeded that loss by 1,661 people in 2021-22, by 494 in 2022-23 and by 196 in 2023-24. In 2024-25, the internal migration loss exceeded the overseas gain, by 45 people, and the year's growth came from natural increase3.
Brisbane and Perth were the only capitals with net internal migration gains in 2024-25, and all eight capitals recorded net overseas migration gains. Hobart's overseas migration gain of 1,833 and natural increase of 587 were both the smallest of the eight capitals1.
| Components of Greater Hobart population change, 2024-25 | ||
|---|---|---|
| Component | People | Derivation |
| Net overseas migration | +1,833 | 3,373 arrivals minus 1,540 departures |
| Natural increase | +587 | 2,638 births minus 2,051 deaths |
| Net internal migration | -1,878 | 7,074 arrivals minus 8,952 departures |
| Total growth | +542 | Derived sum, matching the change in the release's capital city table |
Source · ABS Population components by SA2 and above, 2021-22 to 2024-25, Table 4
Section 04 · The growth areas
Where in Hobart is the population growing fastest?
The city's fastest-growing areas in 2024-25 were on the eastern shore of the Derwent River and around Sorell. The ABS identifies Rokeby (up by 240 people) on the eastern shore and Sorell - Richmond (150) in Hobart's north-east as the areas with the largest growth in Tasmania1.
Rokeby grew from 8,987 to 9,227 people over the year, a rate of 2.7 per cent that was also the highest of any area in the state. Sorell - Richmond grew from 10,731 to 10,8814. The next largest increase in Greater Hobart was Dodges Ferry - Lewisham, up 91 people.
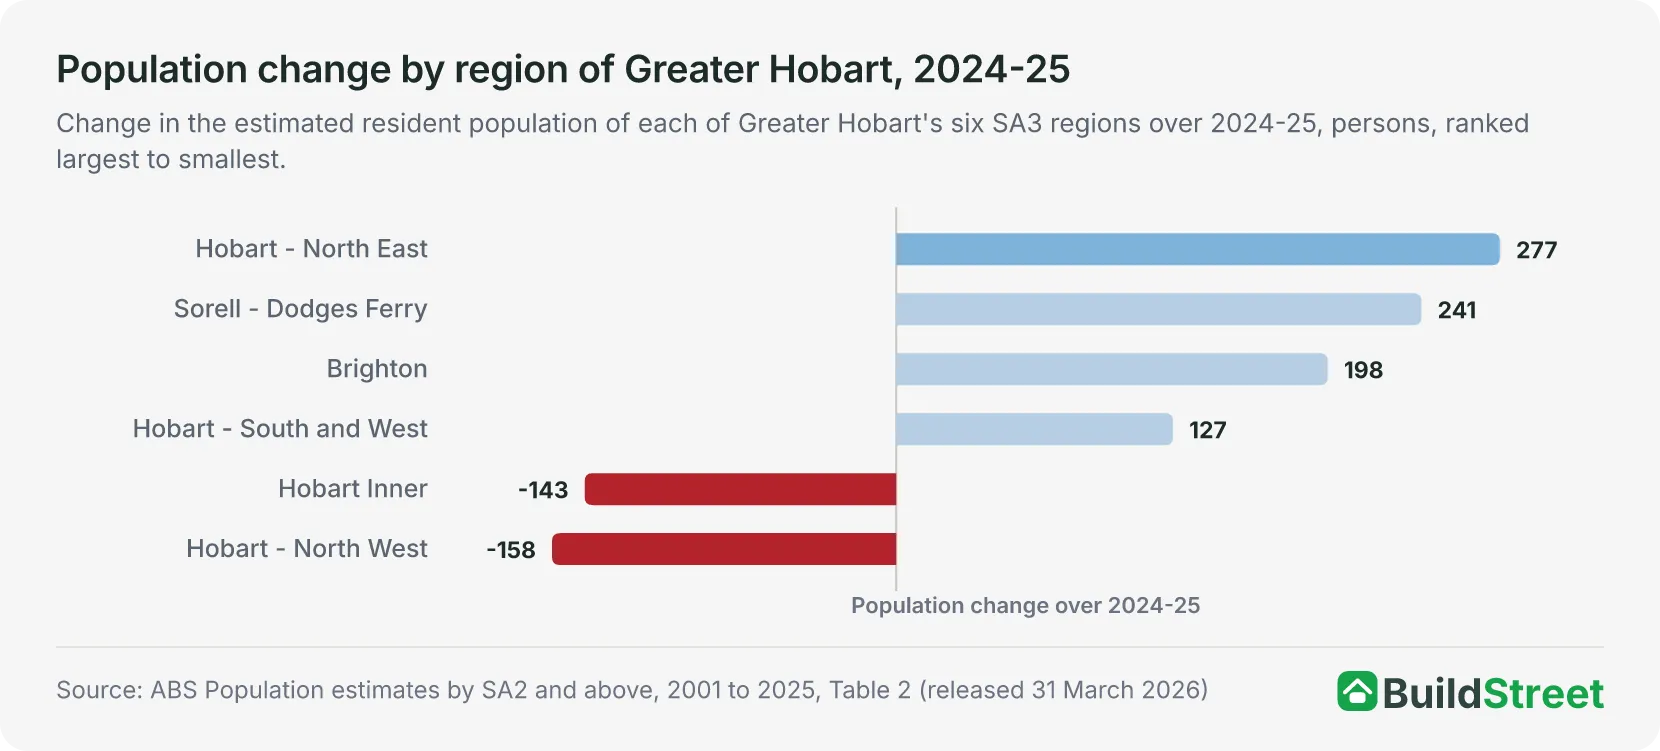
Population growth varied across the city. Four of Greater Hobart's six SA3 regions grew over 2024-25 and two declined. Hobart - North East added 277 people and Sorell - Dodges Ferry added 241, the two largest increases, followed by Brighton with 198 and Hobart - South and West with 127. Hobart Inner declined by 143 people and Hobart - North West by 158. Together, the six regional changes account for the city's total increase of 542 people2.
Rokeby recorded the largest natural increase of any area in the state, at 137 people. Sandy Bay recorded the state's largest net overseas migration gain, at 308 people, while its total population fell by 27. The largest net internal migration gain in the state, 106 people at St Helens - Scamander, was outside the capital on Tasmania's east coast4.
| The fastest growing areas of Hobart, 2024-25 | |||||
|---|---|---|---|---|---|
| Area (SA2) | Region (SA3) | 30 June 2024 | 30 June 2025 | Change | Growth rate % |
| Rokeby | North East | 8,987 | 9,227 | +240 | 2.7 |
| Sorell - Richmond | Sorell - Dodges Ferry | 10,731 | 10,881 | +150 | 1.4 |
| Dodges Ferry - Lewisham | Sorell - Dodges Ferry | 9,031 | 9,122 | +91 | 1.0 |
Source · ABS Population estimates and components by SA2, 2024 to 2025, Table 6
Section 05 · The state share
How much of Tasmania's population lives in Hobart?
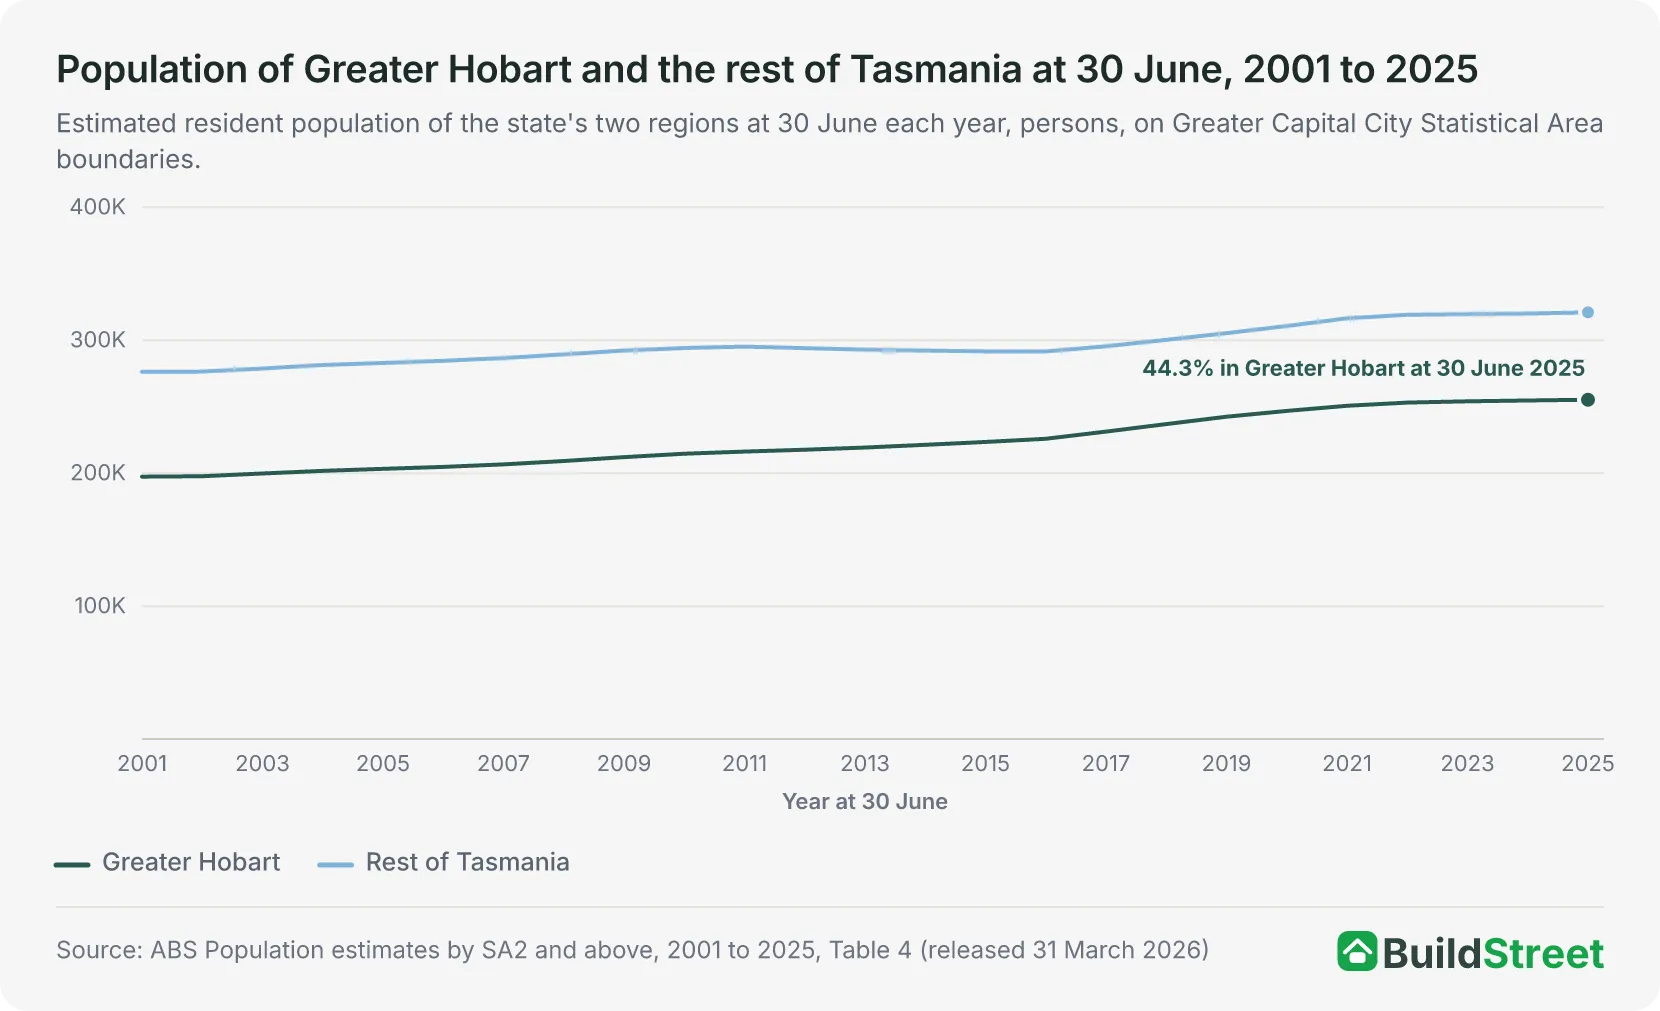
Greater Hobart accounted for 44.3 per cent of the 576,261 total across the two broad regions at 30 June 2025. The capital had 255,250 people and the rest of Tasmania had 321,011, meaning more Tasmanians lived outside the capital than in it. Tasmania and Queensland were the only states where the rest of the state had more people than the capital, and Hobart's share was the lowest of the six state capitals. Brisbane, the next lowest, had 50.0 per cent of its state's two-region total2.
The capital's share increased from 41.7 per cent at 30 June 2001, when Greater Hobart had 197,403 of the 473,668 people across Tasmania's two regions. The gap between the two regions narrowed from 78,862 people at 30 June 2001 to 65,761 at 30 June 20252.
The rest of the state added 954 people (0.30 per cent) over 2024-25, a faster rate than the capital's 0.21 per cent. The ABS rounds the change to 950 people (0.3 per cent). Over the longer run, the two regions' populations followed different trends. The rest of the state's population fell in each of the five years from 2011-12 to 2015-16, while the capital's increased in every year from 2001-02 to 2024-252.
Section 06 · The other capitals
How does Hobart compare with Australia's other capital cities?
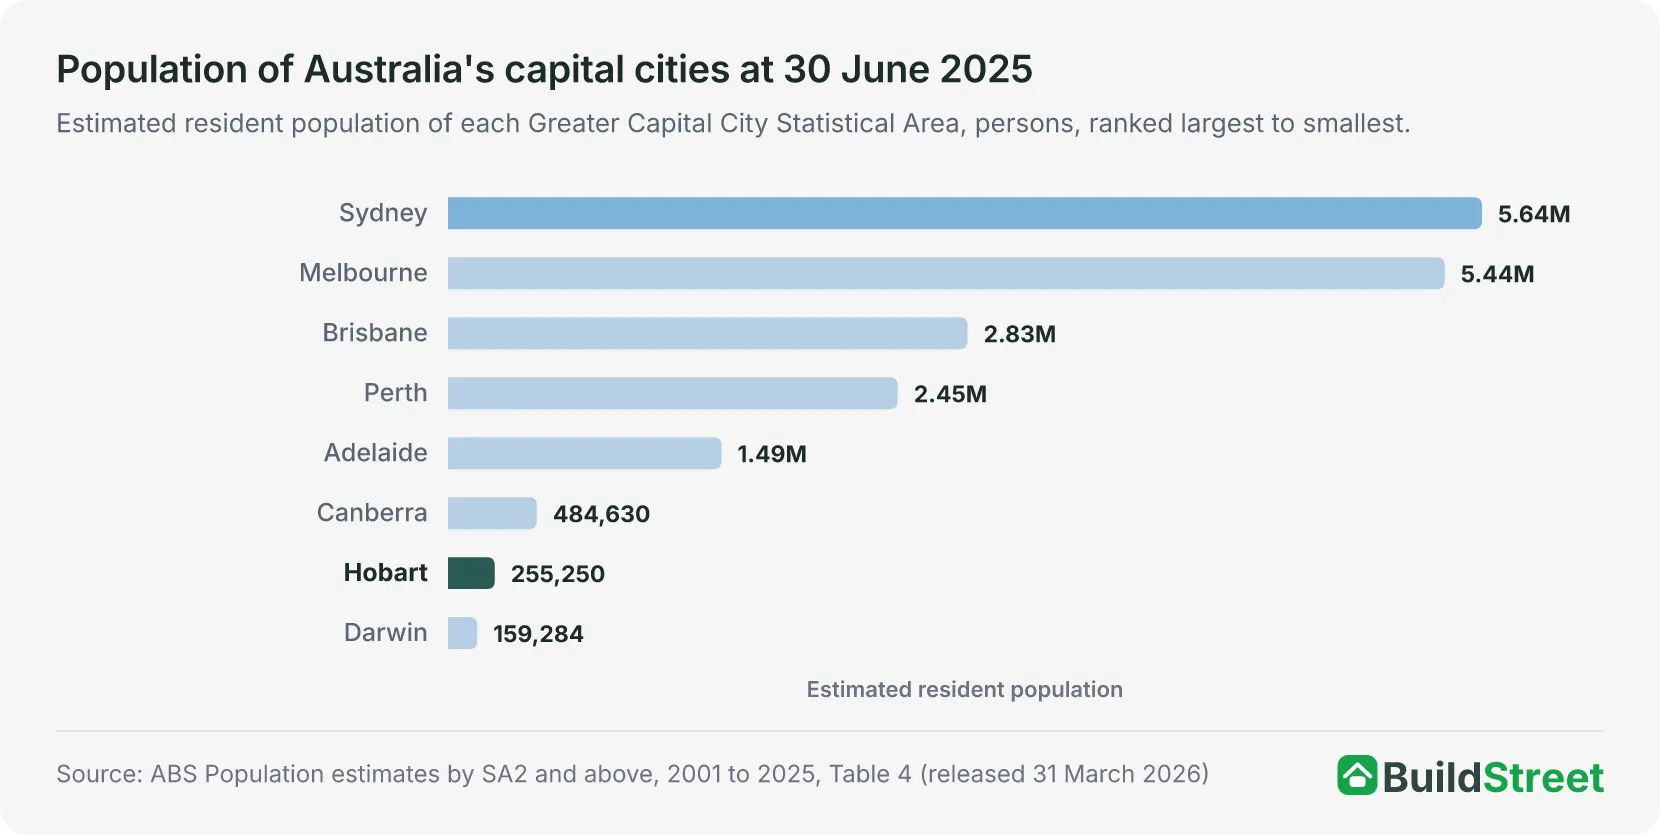
Hobart was the seventh largest of the eight capital city populations at 30 June 2025, with 255,250 people. Sydney was the largest, with 5,638,830 people, followed by Melbourne with 5,435,590, Brisbane with 2,833,524, Perth with 2,452,765 and Adelaide with 1,491,015. Canberra, the sixth largest capital, had 484,630 people, and Darwin, the smallest, had 159,2842.
Hobart also recorded the smallest population increase and slowest growth rate of the eight capitals in 2024-25. It added 542 people, compared with 2,719 in Darwin, the next smallest increase. Melbourne recorded the largest increase of the eight capitals, at 105,030 people, followed by Sydney with 75,230, Brisbane with 58,223 and Perth with 58,0881.
By growth rate, Perth was the fastest-growing capital at 2.43 per cent, followed by Brisbane at 2.10 per cent and Melbourne at 1.97 per cent. Hobart's rate of 0.21 per cent was the slowest, below Adelaide's 1.27 per cent1.
Australia's eight capital cities had a combined population of 18,750,888 people at 30 June 2025, an increase of 324,679 (1.8 per cent) over the year. Greater Hobart accounted for 1.4 per cent of the combined capital population1.
Adelaide's population data is covered in the Adelaide population article.
| Population of Australia's capital cities, as at 30 June 2025 | |||
|---|---|---|---|
| Capital city | Population | Change over 2024-25 | Growth rate % |
| Sydney | 5,638,830 | +75,230 | 1.35 |
| Melbourne | 5,435,590 | +105,030 | 1.97 |
| Brisbane | 2,833,524 | +58,223 | 2.10 |
| Perth | 2,452,765 | +58,088 | 2.43 |
| Adelaide | 1,491,015 | +18,647 | 1.27 |
| Canberra | 484,630 | +6,200 | 1.30 |
| Hobart | 255,250 | +542 | 0.21 |
| Darwin | 159,284 | +2,719 | 1.74 |
| All capital cities | 18,750,888 | +324,679 | 1.76 |
Source · ABS Population estimates by SA2 and above, 2001 to 2025, Table 4
Section 07 · The long run
How has Hobart's population changed since 2001?
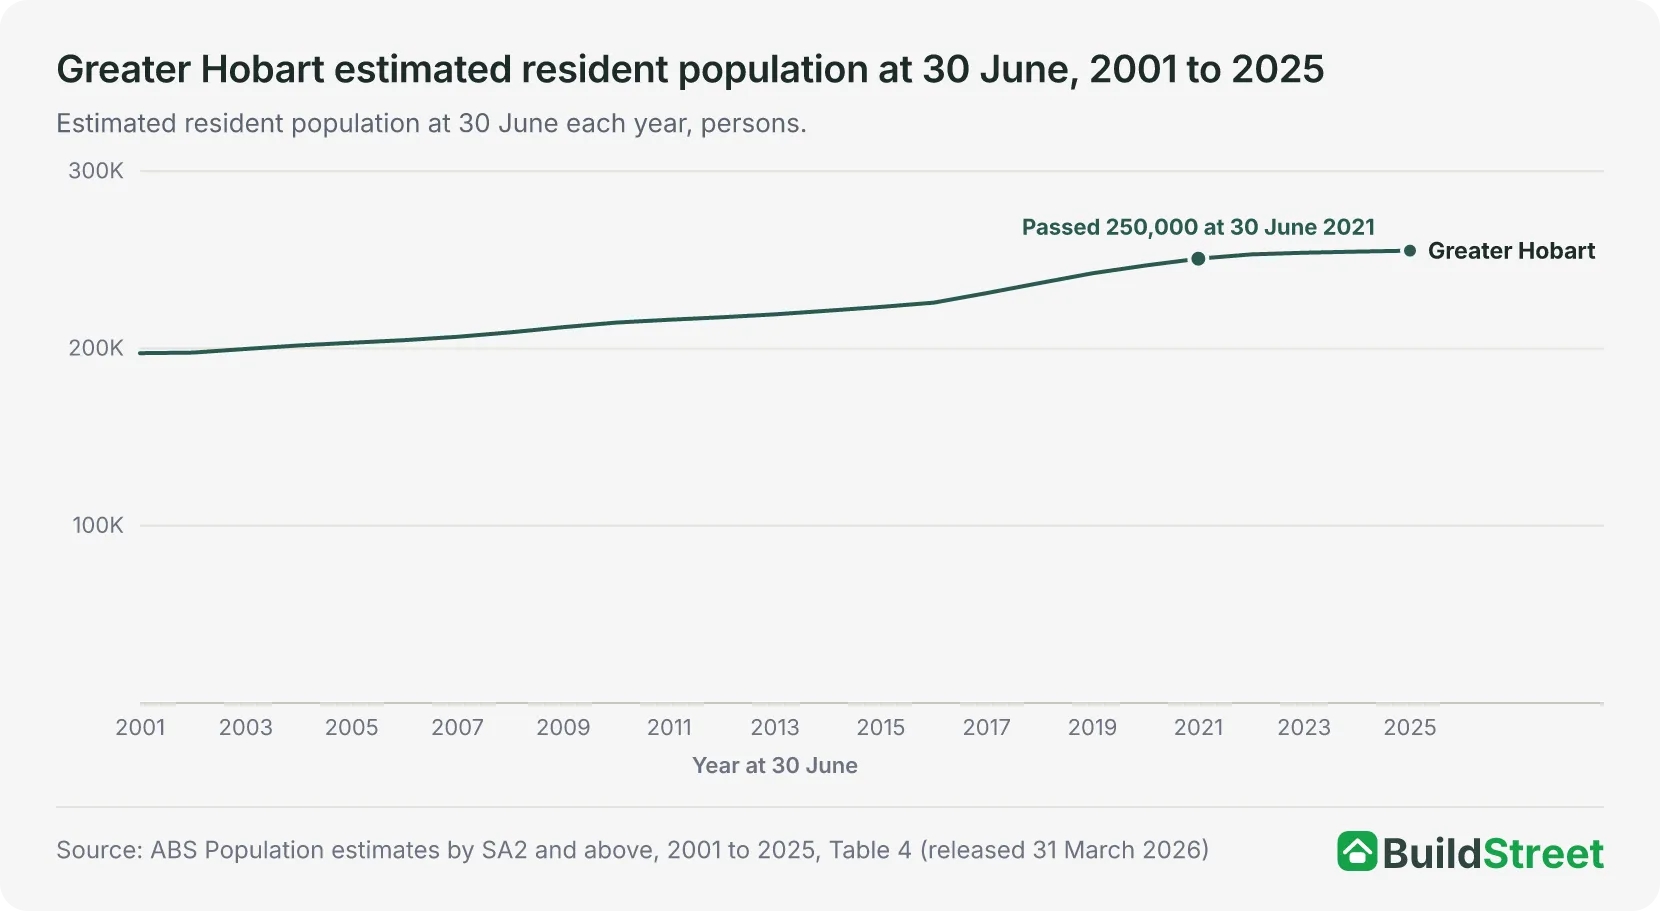
The city added 57,847 people between 30 June 2001 and 30 June 2025, growing from 197,403 to 255,250. By 2025, the population was 1.29 times its 2001 level2.
Greater Hobart first exceeded 200,000 at 30 June 2004, 225,000 at 30 June 2016 and 250,000 at 30 June 2021. The city took 12 years to move from 200,000 to 225,000, then five to move from 225,000 to 250,0002.
Of the 57,847-person increase between 2001 and 2025, 24,804 occurred in the five years from 30 June 2016 to 30 June 2021, accounting for 43 per cent of the total. The four years from 30 June 2021 to 30 June 2025 added 4,533 people2.
| Greater Hobart population milestones in the annual series | ||
|---|---|---|
| Milestone | First 30 June at or above | Population that year |
| 200,000 | 30 June 2004 | 201,771 |
| 225,000 | 30 June 2016 | 225,913 |
| 250,000 | 30 June 2021 | 250,717 |
Source · ABS Population estimates by SA2 and above, 2001 to 2025, Table 4
Section 08
Hobart population: quick answers
How many people live in Hobart?
Greater Hobart had an estimated resident population of 255,250 at 30 June 2025. That was the seventh largest population of Australia's eight capital cities and 0.92 per cent of the national total of 27,613,654 on the same date. The 30 June 2025 estimates are preliminary. The next release, covering 30 June 2026, is due on 25 March 2027.
Is Hobart the smallest capital city in Australia?
Hobart was the smallest of the six state capital cities at 30 June 2025. Greater Hobart had 255,250 residents on the ABS Greater Capital City Statistical Area boundaries. Darwin, a territory capital, was smaller at 159,284 people, making Hobart the seventh largest of the eight capitals. Canberra, the sixth largest, had 484,630.
How fast is Hobart's population growing?
Greater Hobart added 542 people, or 0.21 per cent, over the 2024-25 financial year, the slowest growth rate of the eight capital cities and the city's smallest annual increase since 2001-02. Growth peaked at 5,663 people (2.45 per cent) in 2017-18, and the population increased in every year from 2001-02 to 2024-25.
Section 09
Australia population statistics
References
- ABS Regional population, 2024-25 · Australian Bureau of Statistics ↑ b c d e f g
- ABS Regional population, 2024-25: population estimates by SA2 and above, 2001 to 2025 (datacube 32180DS0003) · Australian Bureau of Statistics ↑ b c d e f g h i j k l
- ABS Regional population, 2024-25: population components by SA2 and above, 2021-22 to 2024-25 (datacube 32180DS0005) · Australian Bureau of Statistics ↑ b
- ABS Regional population, 2024-25: population estimates and components by SA2, 2024 to 2025 (datacube 32180DS0001) · Australian Bureau of Statistics ↑ b
- ABS Regional population methodology, 2024-25 · Australian Bureau of Statistics
