

Published 2 Sept 2026 · Updated 15 Sept 2026
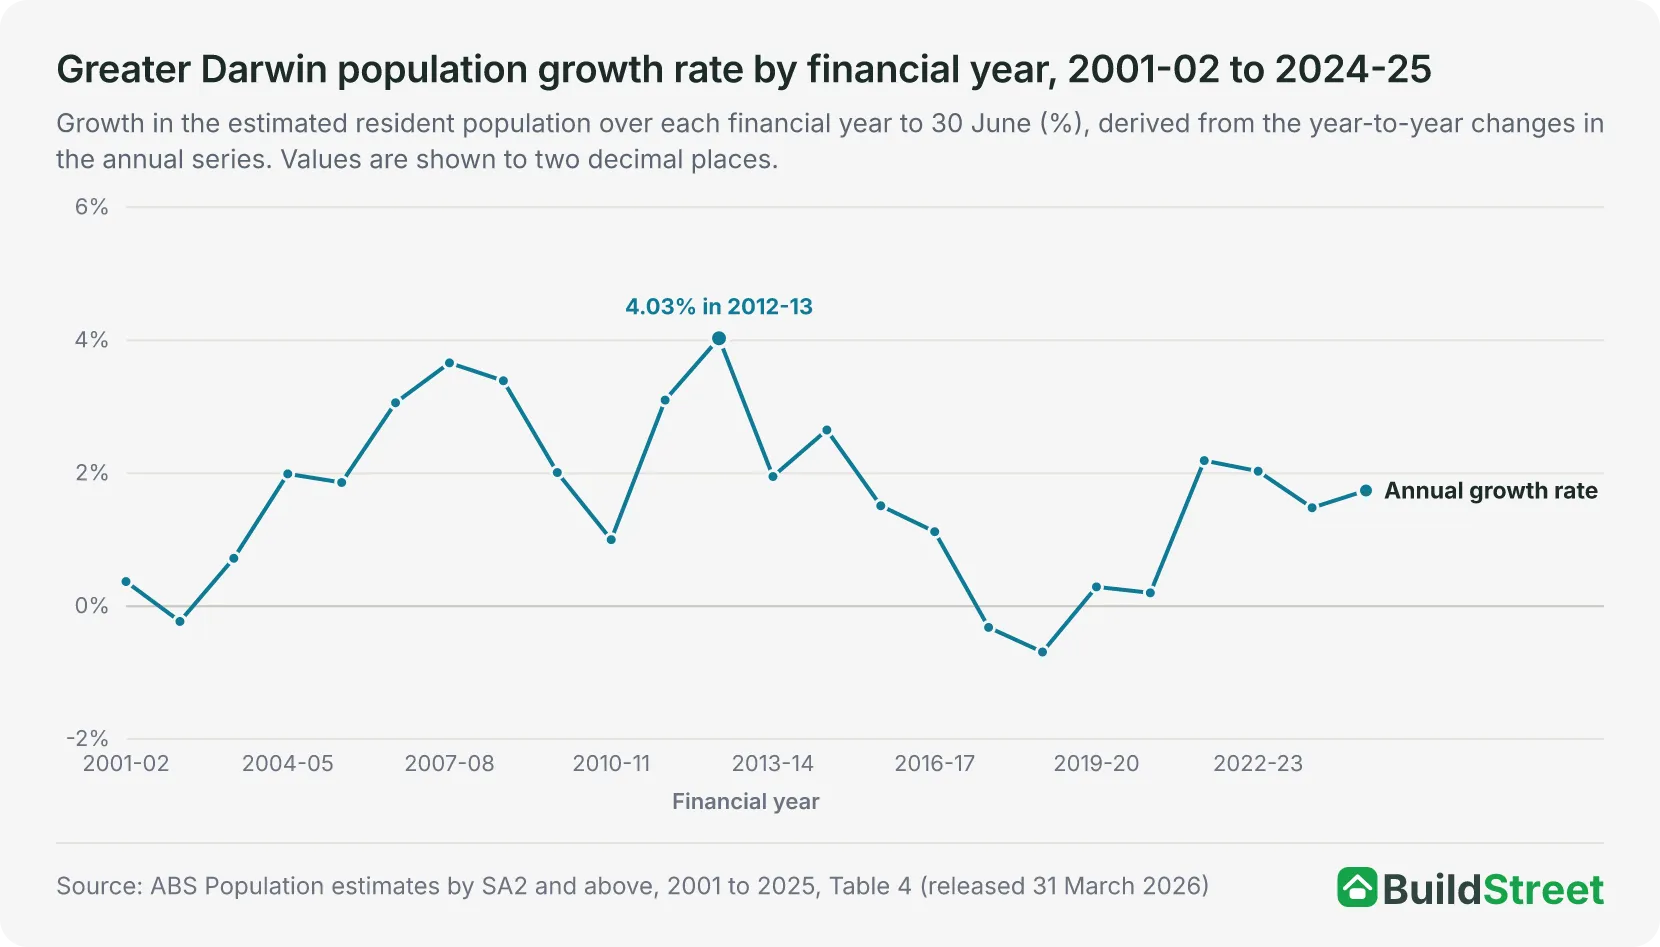 The territory's capitalGreater Darwin had 159,284 residents at 30 June 2025, and the Darwin urban area had 145,019, equal to 4.7 times the Alice Springs figure. The Darwin article covers the capital's total, drivers, growth areas and long-run series on the same ABS boundaries.
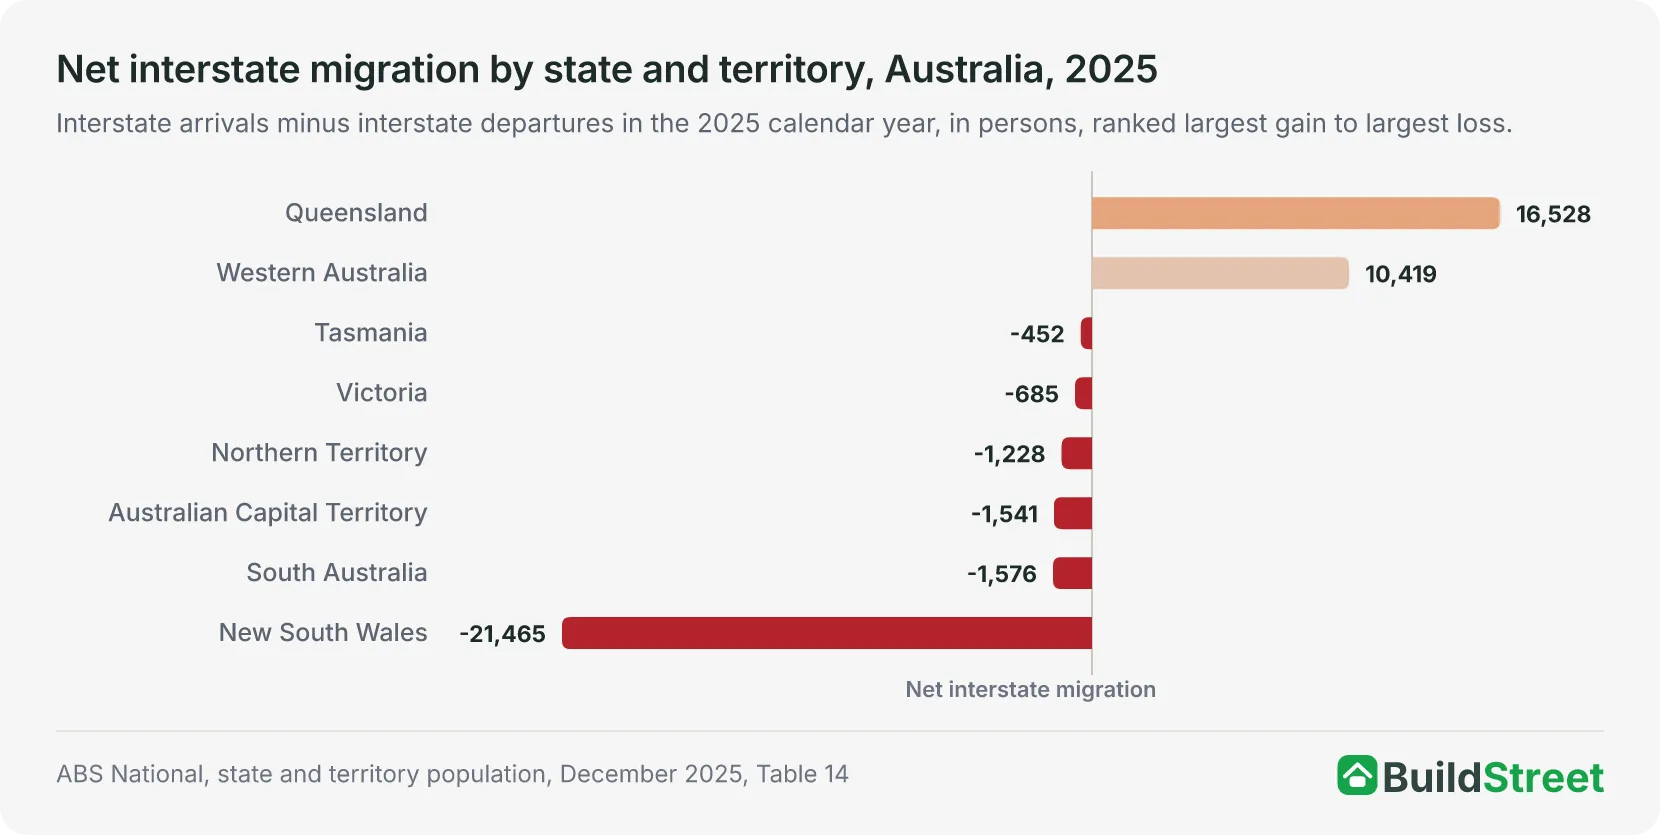 Moves between the states and territoriesNet internal migration subtracted 365 people from Alice Springs in 2024-25, a net loss in each of the four financial years from 2021-22 for which the ABS publishes components. The interstate migration article covers the annual state-to-state flows for all eight states and territories.
Section 01 · The headline number
How many people live in Alice Springs?
The Alice Springs Significant Urban Area had an estimated resident population of 30,875 at 30 June 2025, the highest annual estimate since 2001. The Northern Territory has two urban areas with at least 10,000 people. The other is Darwin, whose urban area had 145,019 people on the same date, making Alice Springs the smaller of the two. Alice Springs accounted for 11.7 per cent of the territory's 264,556 people and 0.11 per cent of Australia's 27,613,654 people1.
The ABS publishes the estimate once a year, with a reference date of 30 June. The 30 June 2025 estimate is preliminary and will be revised in the next release, covering 30 June 2026, which is due for publication on 25 March 20272.
Section 02 · The pace
How fast is the population of Alice Springs growing?
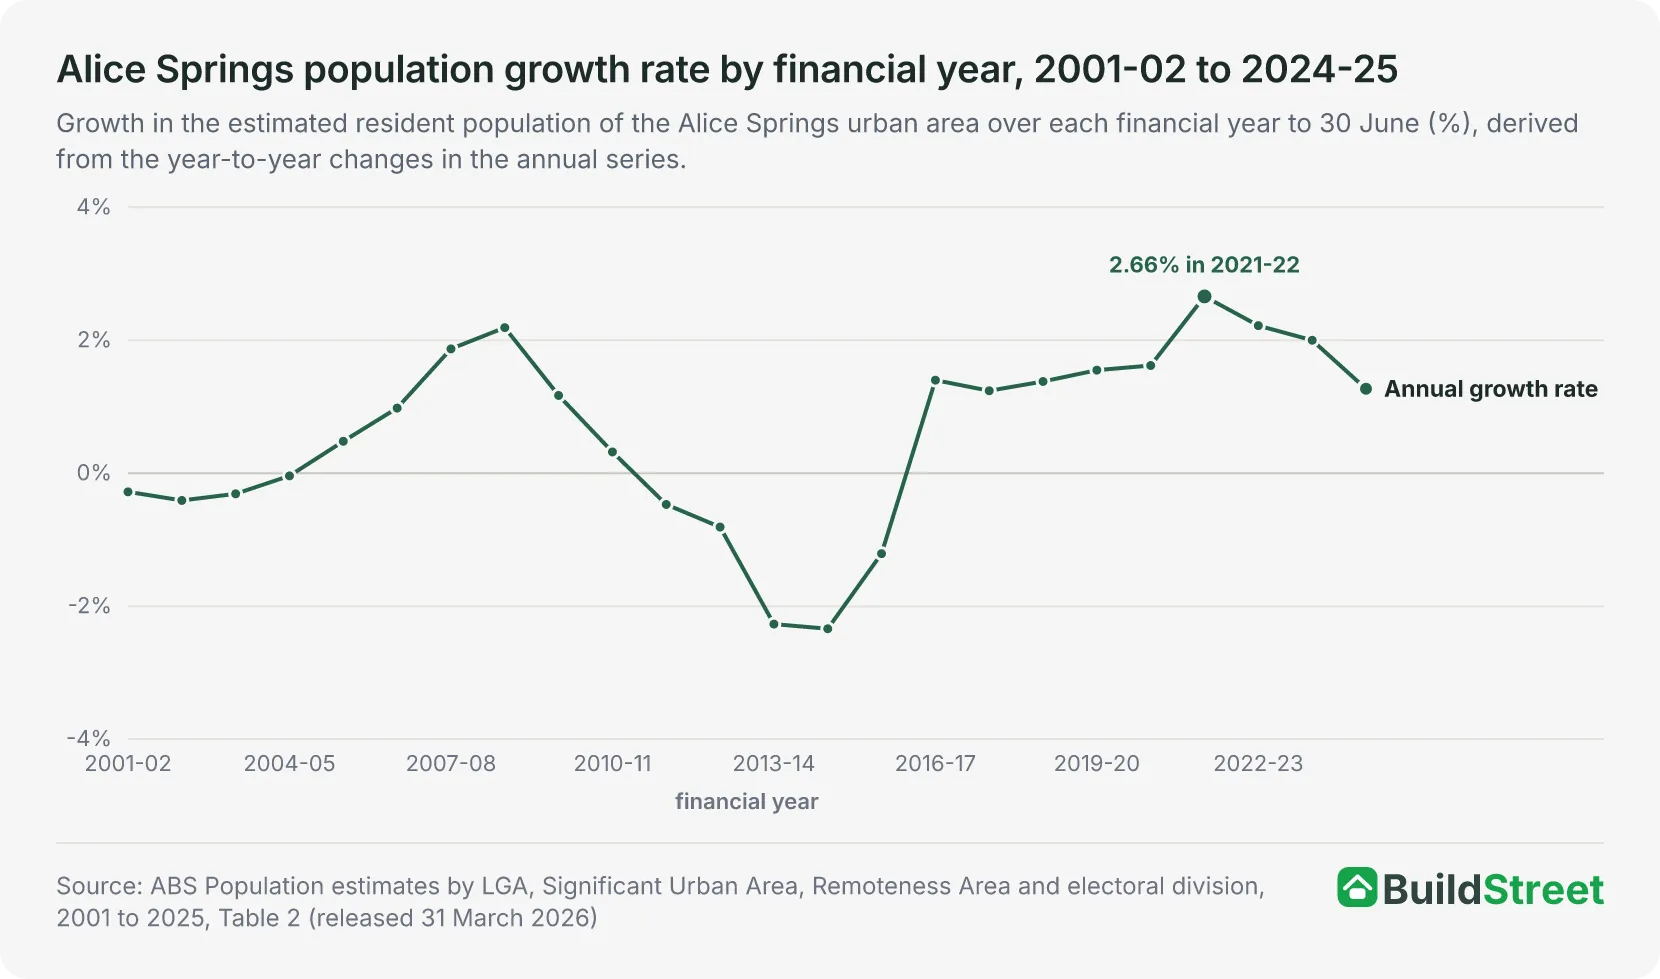
Alice Springs added 388 people, or 1.27 per cent, in 2024-25, growing from 30,487 at 30 June 2024 to 30,875 at 30 June 2025. The council-area figures show the same increase, with the growth rate rounded by the ABS to 1.3 per cent. The increase was the smallest since 2018-19, when the town added 377 people, and the rate was the lowest since the 1.24 per cent of 2017-184.
Growth slowed in each of the three years after peaking in 2021-22. The town added 759 people, or 2.66 per cent, in 2021-22, the largest increase and the highest rate since 2001-02. It then added 648 people in 2022-23, 597 in 2023-24 and 388 in 2024-25, at rates of 2.22, 2.00 and 1.27 per cent4.
Over the 24 financial years from 2001-02 to 2024-25, the population fell in nine years and grew in 15. The falls occurred during two periods, from 2001-02 to 2004-05 and from 2011-12 to 2015-16. The largest annual decline was 643 people, or 2.34 per cent, in 2014-154. The population grew in each of the nine financial years from 2016-17 to 2024-25.
Section 03 · The drivers
What drives population change in Alice Springs?
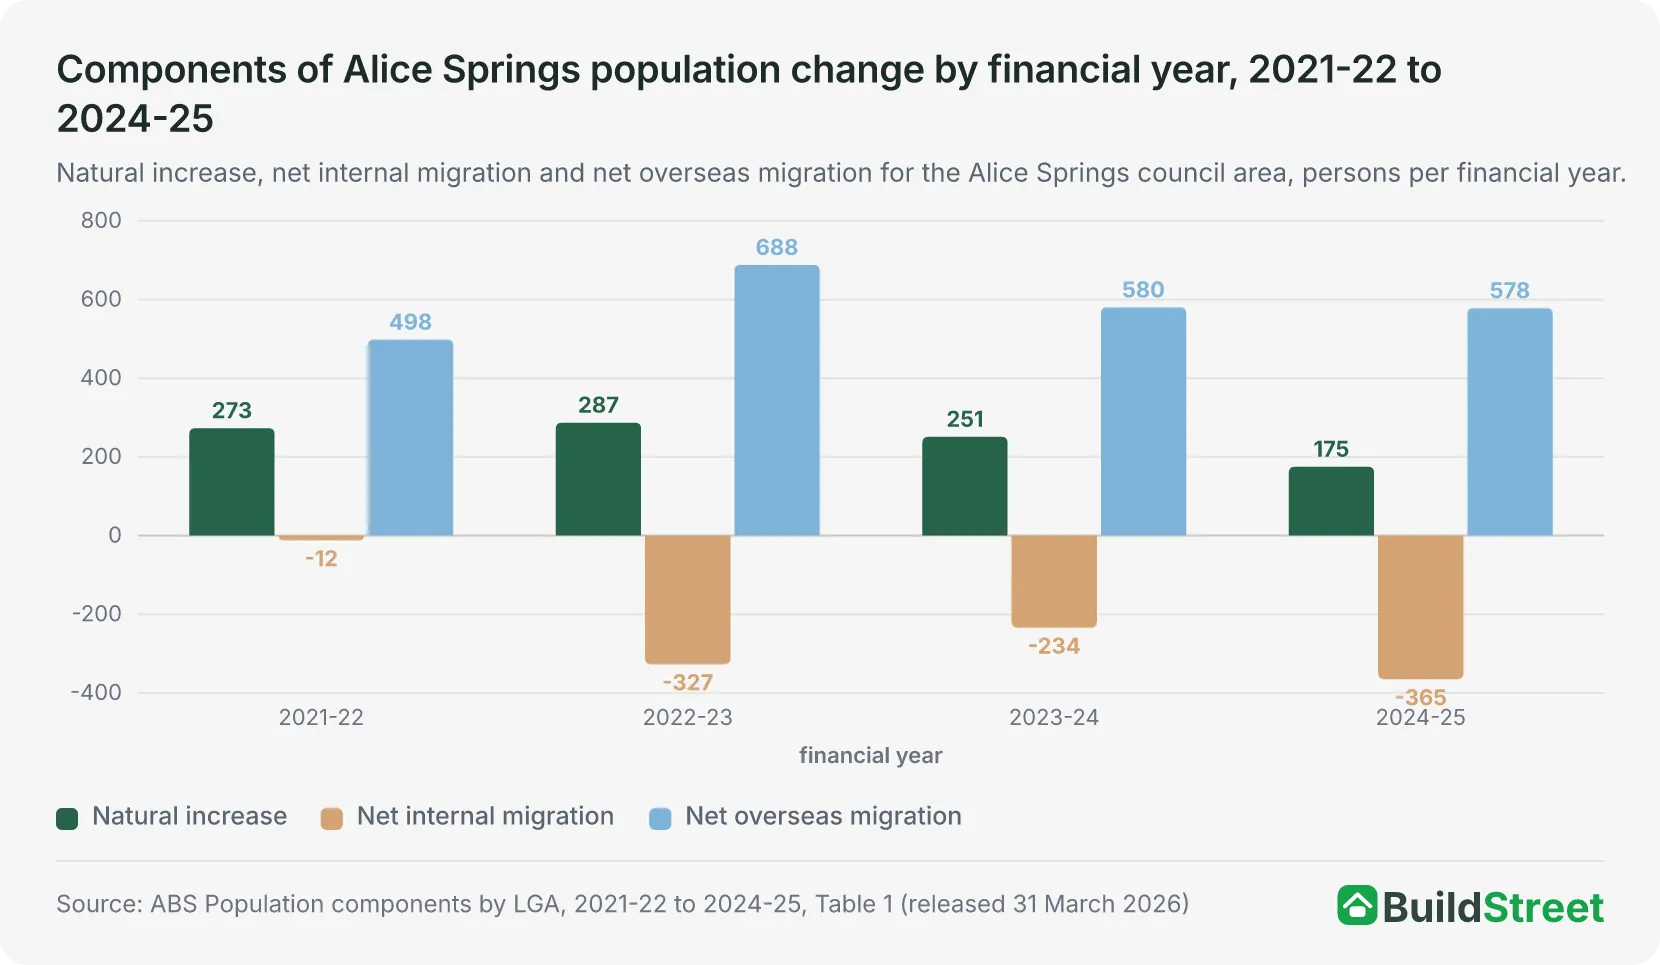
Net overseas migration was the largest component of population change in Alice Springs in 2024-25, adding 578 people. Natural increase, the excess of births over deaths, added 175 people. Net internal migration, moves to and from elsewhere in Australia, subtracted 3655. Together, the three components produced the town's total increase of 388 people. The figures are published for the Alice Springs council area, which has the same population as the urban area.
Net overseas migration was the largest component in each of the four years from 2021-22 to 2024-25. It added 498 people in 2021-22, 688 in 2022-23, 580 in 2023-24 and 578 in 2024-25. Natural increase fell from 287 in 2022-23 to 175 in 2024-25, as births fell from 458 to 370 and deaths rose from 171 to 1955.
Alice Springs recorded a net internal migration loss in each of the four years. The losses were 12 in 2021-22, 327 in 2022-23, 234 in 2023-24 and 365 in 2024-25, the largest annual loss during this period. Across the four years as a whole, net internal migration subtracted 938 people, natural increase added 986 and net overseas migration added 2,344. Together, these components increased the population by 2,392 people, from 28,483 at 30 June 2021 to 30,875 at 30 June 2025.
Alice Springs was one of six of the Northern Territory's 20 council areas to record a net internal migration loss in each of the four years. The others were Barkly, Central Desert, Darwin, East Arnhem and Roper Gulf5.
| Components of Alice Springs population change, 2024-25 | ||
|---|---|---|
| Component | People | Derivation |
| Net overseas migration | +578 | 901 overseas arrivals minus 323 overseas departures |
| Natural increase | +175 | 370 births minus 195 deaths |
| Net internal migration | -365 | 2,098 arrivals from elsewhere in Australia minus 2,463 departures |
| Total change | +388 | 30,487 at 30 June 2024 to 30,875 at 30 June 2025 |
Source · ABS Population components by LGA, 2021-22 to 2024-25, Table 1
Section 04 · The growth areas
Where in Alice Springs is the population growing fastest?
Mount Johns was the fastest-growing of the six areas that make up Alice Springs in 2024-25, adding 128 people to reach 5,069, an increase of 2.6 per cent. East Side, the largest of the six at 6,544 people, added 100 people, or 1.6 per cent. Flynn added 67 people (1.3 per cent), Larapinta added 52 (0.9 per cent), Ross added 21 (0.7 per cent) and Charles added 20 (0.4 per cent). All six areas recorded population growth.
Mount Johns also recorded the largest net overseas migration gain of the six, at 207 people, and the largest net internal migration loss, at 108. Five of the six areas recorded net internal migration losses. Ross was the exception, with a net internal migration gain of 40, and it was also the only area where deaths exceeded births, with 29 births and 63 deaths6.
In addition, 1,158 moves in 2024-25 were between the six areas of Alice Springs. Each of these counts as an arrival in one area and a departure from another, so they do not change the town's total. They are why the six areas together recorded 3,256 internal arrivals and 3,621 internal departures, against 2,098 arrivals and 2,463 departures for the council area as a whole: the difference is 1,158 in both cases7.
Mount Johns grew from 3,691 people at 30 June 2001 to 5,069 at 30 June 2025, an increase of 1,378, or 37.3 per cent, and Ross grew from 2,309 to 3,147, an increase of 838, or 36.3 per cent. Charles changed little over the same period, increasing from 4,868 in 2001 to 4,882 in 20251.
The four remote areas included in the wider Alice Springs region, outside the council boundary, had 12,559 people at 30 June 2025. They cover about 569,000 square kilometres, against the council area's 327.7 square kilometres6.
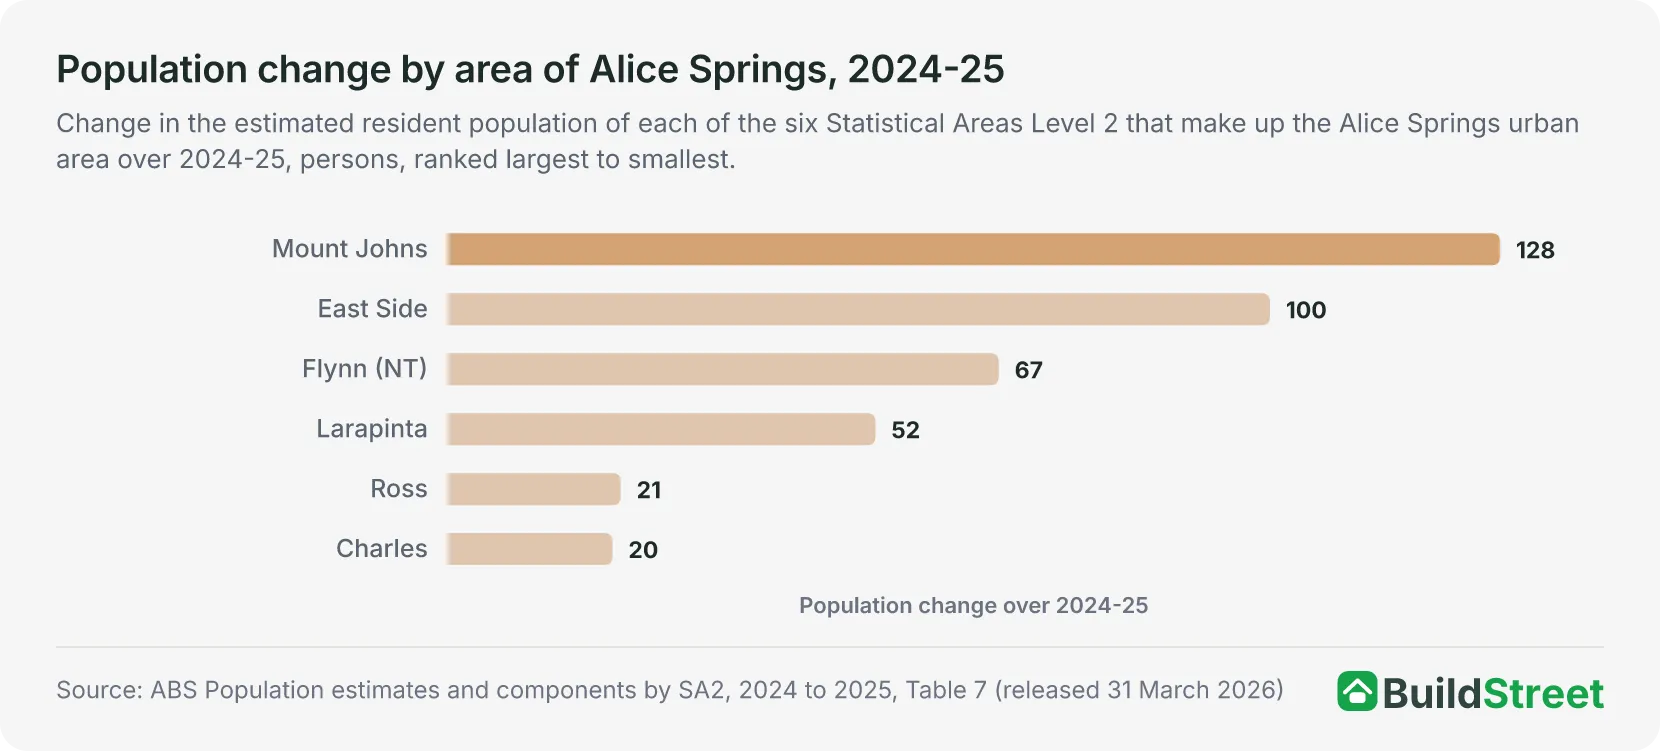
| The six areas of Alice Springs, 2024-25 | |||||||
|---|---|---|---|---|---|---|---|
| Area (SA2) | 30 June 2024 | 30 June 2025 | Change | Growth rate % | Natural increase | Net internal migration | Net overseas migration |
| Mount Johns | 4,941 | 5,069 | +128 | 2.6 | +29 | -108 | +207 |
| East Side | 6,444 | 6,544 | +100 | 1.6 | +34 | -54 | +120 |
| Flynn (NT) | 5,288 | 5,355 | +67 | 1.3 | +63 | -90 | +94 |
| Larapinta | 5,826 | 5,878 | +52 | 0.9 | +47 | -74 | +79 |
| Ross | 3,126 | 3,147 | +21 | 0.7 | -34 | +40 | +15 |
| Charles | 4,862 | 4,882 | +20 | 0.4 | +36 | -79 | +63 |
| Alice Springs | 30,487 | 30,875 | +388 | 1.3 | +175 | -365 | +578 |
Source · ABS Population estimates and components by SA2, 2024 to 2025, Table 7, and ABS Population estimates and components by LGA, 2024 to 2025, Table 7
Section 05 · The territory picture
How does Alice Springs compare with the rest of the Northern Territory?
Alice Springs was the smaller of the two urban areas the ABS lists in the Northern Territory at 30 June 2025. The Darwin urban area had 145,019 people, about 4.7 times the Alice Springs population. The territory's remaining 88,662 people lived outside any urban area with at least 10,000 people.
Among the Northern Territory's 20 council areas, Alice Springs had the third-largest population. It ranked behind Darwin at 90,035 and Palmerston at 43,193, and ahead of Litchfield at 24,849 and Katherine at 11,2828.
Alice Springs accounted for 29.3 per cent of the 105,272 people living in the Northern Territory outside Greater Darwin at 30 June 2025. The share was 28.7 per cent at 30 June 2001 and fell to a low of 26.9 per cent in 2015 and 2016. It then increased in every year from 2016 to 2025.
The population outside Greater Darwin increased by 953 people, or 0.91 per cent, in 2024-25. Alice Springs accounted for 388 of this increase1. Greater Darwin added 2,719 people (1.74 per cent) over the same year, and the territory as a whole added 3,672 (1.41 per cent).
Litchfield had the fastest growth rate among the territory's five largest council areas, at 2.2 per cent. It recorded the territory's largest net internal migration gain, at 288 people. The Alice Springs growth rate of 1.3 per cent ranked tenth among the 20 council areas.
Alice Springs recorded the territory's second-largest net overseas migration gain, at 578 people, behind Darwin at 2,235. Its net internal migration loss of 365 was the third largest, after losses of 1,602 in Darwin and 388 in Palmerston8.
Darwin's population data is covered in the Darwin population article.
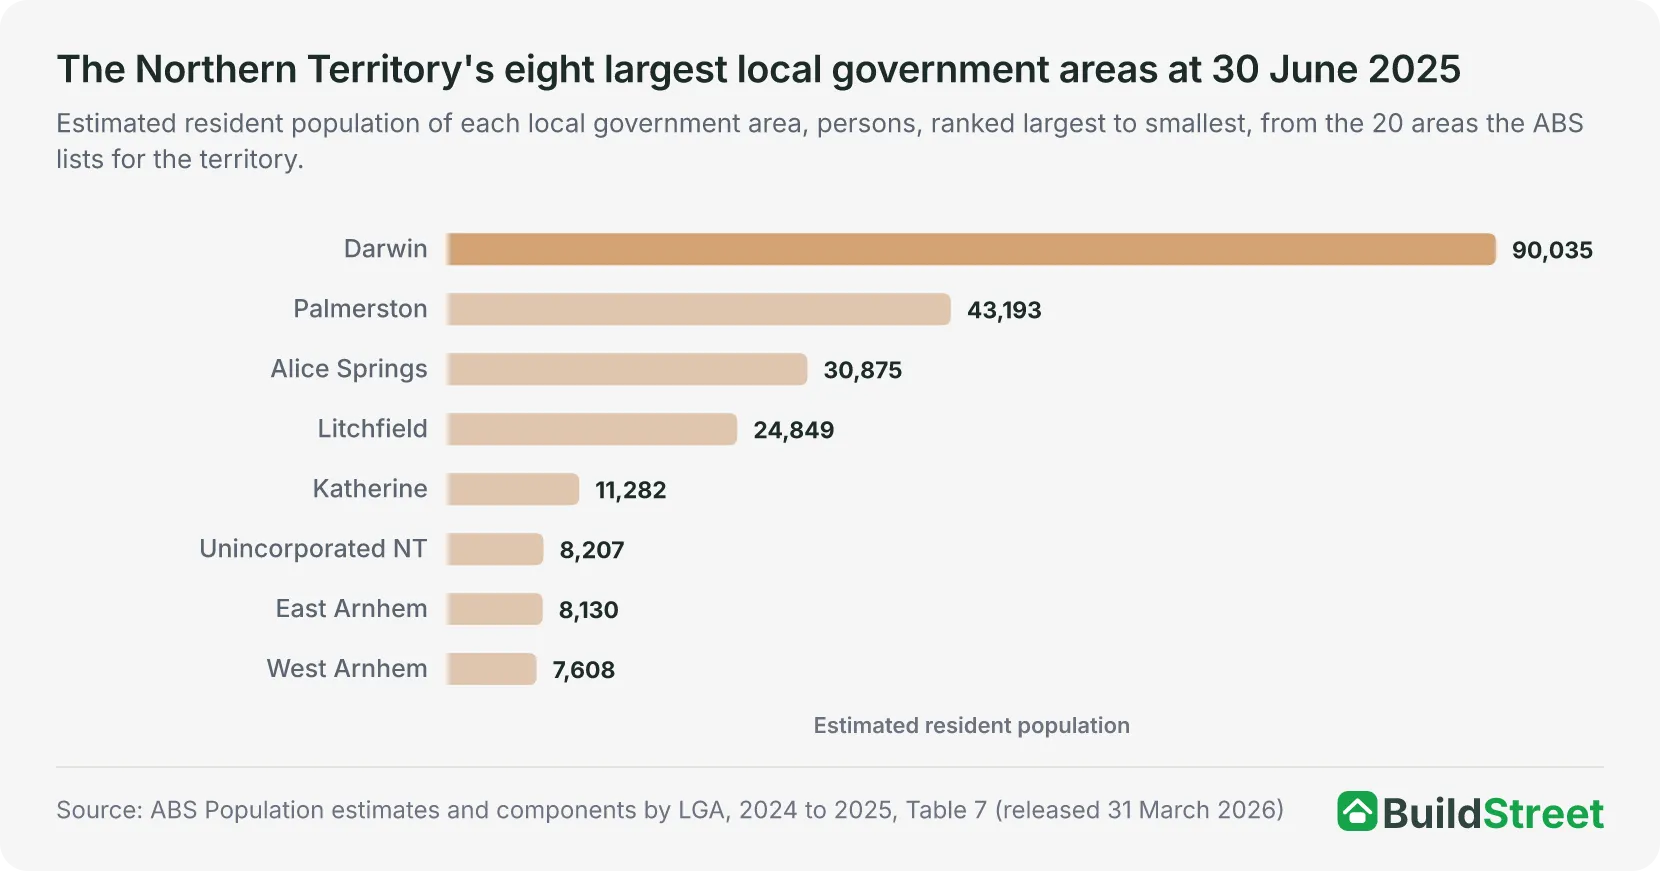
| The Northern Territory's eight largest local government areas, 2024-25 | ||||||
|---|---|---|---|---|---|---|
| Local government area | Population at 30 June 2025 | Change over 2024-25 | Growth rate % | Natural increase | Net internal migration | Net overseas migration |
| Darwin | 90,035 | +1,282 | 1.4 | +649 | -1,602 | +2,235 |
| Palmerston | 43,193 | +582 | 1.4 | +517 | -388 | +453 |
| Alice Springs | 30,875 | +388 | 1.3 | +175 | -365 | +578 |
| Litchfield | 24,849 | +544 | 2.2 | +121 | +288 | +135 |
| Katherine | 11,282 | +94 | 0.8 | +85 | -66 | +75 |
| Unincorporated NT | 8,207 | +221 | 2.8 | +68 | +86 | +67 |
| East Arnhem | 8,130 | +22 | 0.3 | +82 | -73 | +13 |
| West Arnhem | 7,608 | +74 | 1.0 | +54 | +1 | +19 |
Source · ABS Population estimates and components by LGA, 2024 to 2025, Table 7
Section 06 · The national rank
Where does Alice Springs rank among Australia's urban areas?
Alice Springs was tied with Mount Gambier as Australia's 50th-largest urban area at 30 June 2025. Both urban areas had 30,875 people, while 49 of Australia's 102 urban areas had larger populations. Mount Gambier, in South Australia, added 70 people, or 0.23 per cent, in 2024-25, while Alice Springs added 388, or 1.27 per cent.
The closest larger urban area was Victor Harbor - Goolwa at 30,900, a difference of 25 people. Kalgoorlie - Boulder had 31,016 people and Morisset - Cooranbong had 31,333. The next smaller urban area was Nelson Bay, at 29,024. Sixteen urban areas, from Bathurst at 39,013 to Goulburn at 25,647, had between 25,000 and 40,000 people4.
Using unrounded growth rates, Alice Springs ranked 28th among Australia's 102 urban areas in 2024-25. Adelaide ranked 29th, although its rate also rounds to 1.27 per cent.
The Darwin urban area ranked 18th, with a growth rate of 1.77 per cent. Between 30 June 2001 and 30 June 2025, the Alice Springs population increased by 15.0 per cent, ranking 80th among the 102 urban areas4.
| Australia's urban areas with 25,000 to 40,000 people, as at 30 June 2025 | |||||
|---|---|---|---|---|---|
| Rank | Urban area (SUA) | State or territory | Population | Change over 2024-25 | Growth rate % |
| 43 | Bathurst | New South Wales | 39,013 | +317 | 0.82 |
| 44 | Albany | Western Australia | 38,287 | +567 | 1.50 |
| 45 | Warrnambool | Victoria | 36,689 | +341 | 0.94 |
| 46 | Devonport | Tasmania | 32,938 | +44 | 0.13 |
| 47 | Morisset - Cooranbong | New South Wales | 31,333 | +827 | 2.71 |
| 48 | Kalgoorlie - Boulder | Western Australia | 31,016 | +74 | 0.24 |
| 49 | Victor Harbor - Goolwa | South Australia | 30,900 | +527 | 1.74 |
| 50= | Mount Gambier | South Australia | 30,875 | +70 | 0.23 |
| 50= | Alice Springs | Northern Territory | 30,875 | +388 | 1.27 |
| 52 | Nelson Bay | New South Wales | 29,024 | +151 | 0.52 |
| 53 | Maryborough | Queensland | 28,658 | +124 | 0.43 |
| 54 | Burnie - Somerset | Tasmania | 28,643 | +27 | 0.09 |
| 55 | Lismore | New South Wales | 27,856 | -156 | -0.56 |
| 56 | Bacchus Marsh | Victoria | 27,182 | +651 | 2.45 |
| 57 | Taree | New South Wales | 26,858 | +12 | 0.04 |
| 58 | Goulburn | New South Wales | 25,647 | +282 | 1.11 |
Source · ABS Population estimates by LGA, Significant Urban Area, Remoteness Area and electoral division, 2001 to 2025, Table 2
Section 07 · The long run
How has the population of Alice Springs changed since 2001?
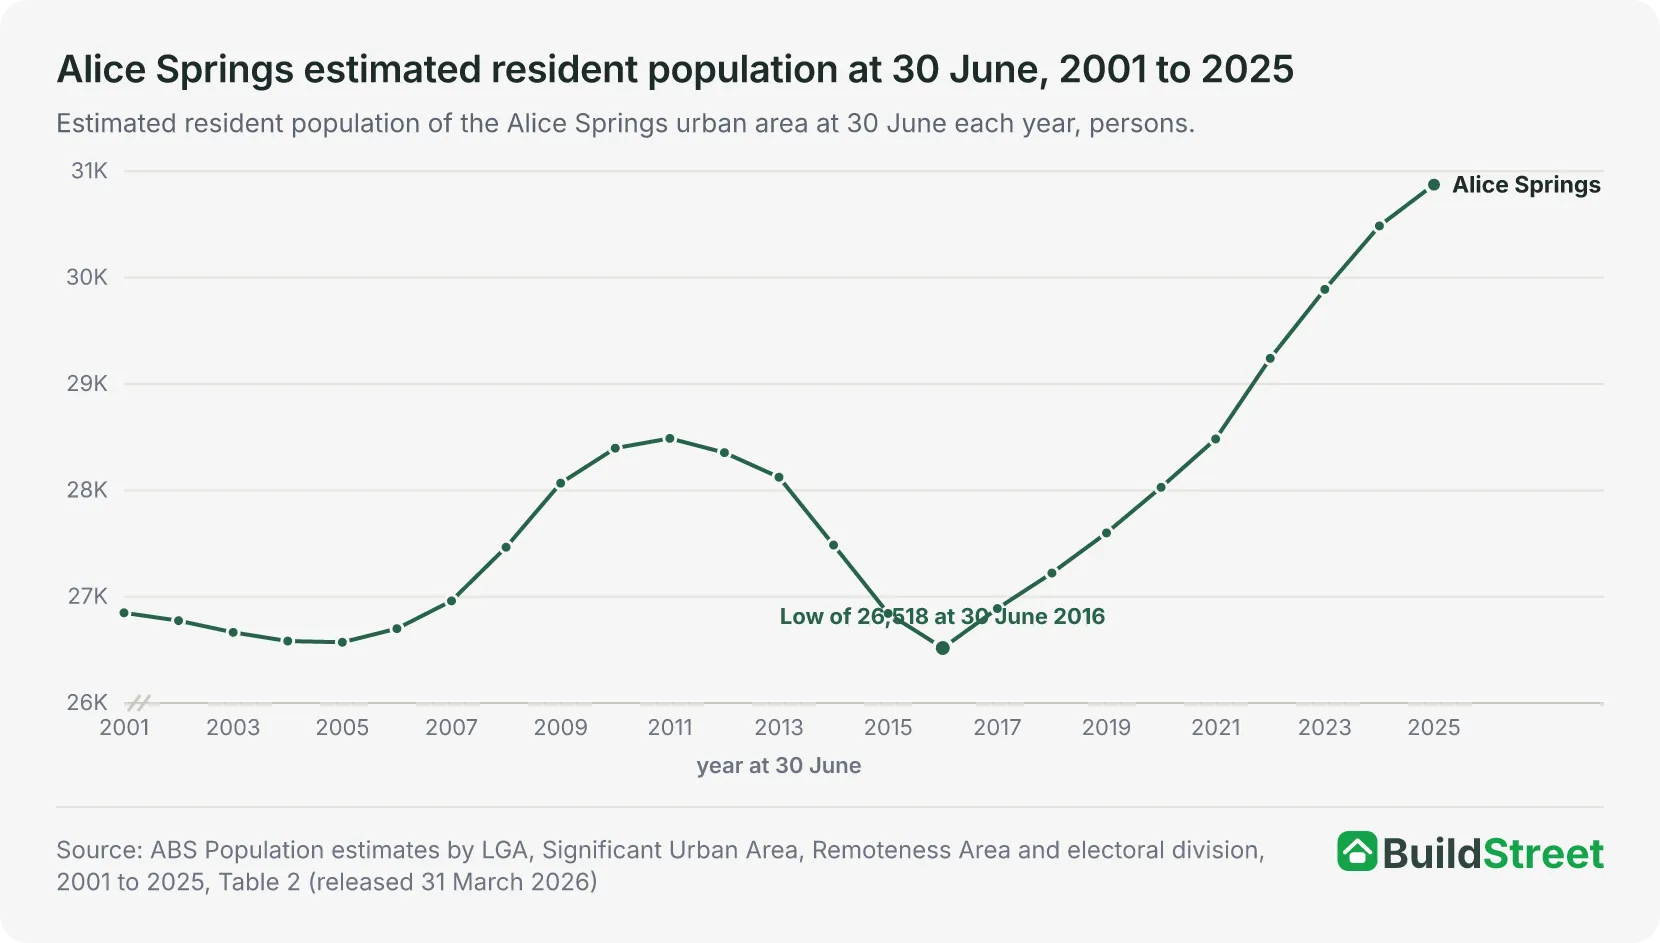
The Alice Springs population increased by 4,026 people between 30 June 2001 and 30 June 2025, growing from 26,849 to 30,875. The 2025 population was 15.0 per cent higher than in 2001 and was the highest annual estimate since 2001.
The population fell during two periods. It declined from 26,849 at 30 June 2001 to 26,572 at 30 June 2005, a loss of 277 people. It then grew for six consecutive years, reaching 28,489 at 30 June 2011.
The population then fell for five consecutive years, reaching 26,518 at 30 June 2016. This was a decline of 1,971 people, or 6.92 per cent, from the 2011 level. The population did not exceed the 2011 figure again until 30 June 2022, when it reached 29,242. One year earlier, it was still six people below the 2011 figure, at 28,4834.
The population grew in every financial year from 2016-17 to 2024-25. Across these nine years, it increased by 4,357 people, or 16.43 per cent. Of Australia's 102 urban areas, 48 recorded growth in every year from 2001-02 to 2024-25.
Six urban areas had more years of decline than the nine in Alice Springs: Broken Hill declined in 23, Mount Isa in 16, Lismore and Lithgow in 15 each, Port Pirie in 14 and Whyalla in 13. Grafton, Kalgoorlie - Boulder, Moe - Newborough and Ulverstone also recorded declines in nine years4.
Alice Springs first reached 27,000 at 30 June 2008 and 28,000 at 30 June 2009. The population later fell below 28,000 from 2014 to 2019 and below 27,000 from 2015 to 2017. It returned to at least 28,000 at 30 June 2020. It first reached 29,000 at 30 June 2022 and passed 30,000 at 30 June 2024, when the estimate was 30,4874.
| Alice Springs population milestones in the annual series | |||
|---|---|---|---|
| Milestone | First 30 June at or above | Population that year | Years below the milestone again |
| 27,000 | 30 June 2008 | 27,466 | 2015 to 2017 |
| 28,000 | 30 June 2009 | 28,068 | 2014 to 2019 |
| 29,000 | 30 June 2022 | 29,242 | None |
| 30,000 | 30 June 2024 | 30,487 | None |
Source · ABS Population estimates by LGA, Significant Urban Area, Remoteness Area and electoral division, 2001 to 2025, Table 2
Section 08
Alice Springs population: quick answers
How many people live in Alice Springs?
Alice Springs had an estimated resident population of 30,875 at 30 June 2025. The figure is the same for the Alice Springs urban area and the Alice Springs council area, which have identical estimates in every year from 2001 to 2025. The 30 June 2025 estimates are preliminary.
Is Alice Springs the second-largest town in the Northern Territory?
Alice Springs was the smaller of the two Significant Urban Areas the ABS lists in the Northern Territory at 30 June 2025, with 30,875 residents, behind the Darwin urban area at 145,019. Among the territory's 20 local government areas, which use different boundaries, Alice Springs ranked third, behind Darwin at 90,035 and Palmerston at 43,193.
How fast is the population of Alice Springs growing?
Alice Springs added 388 people, or 1.27 per cent, in 2024-25. The council-area data shows the same increase, with the growth rate rounded by the ABS to 1.3 per cent. Growth peaked at 759 people (2.66 per cent) in 2021-22 and then slowed in each of the next three years. The population has grown in every year since 2016-17, after falling in nine of the years between 2001-02 and 2015-16.
Is the Alice Springs council area the same as the town?
The Alice Springs local government area and the Alice Springs Significant Urban Area have identical estimated resident populations in every year of the ABS data from 2001 to 2025, both at 30,875 at 30 June 2025. Both are made up of the same six Statistical Areas Level 2: Charles, East Side, Flynn, Larapinta, Mount Johns and Ross. The wider Alice Springs statistical region adds four remote areas outside the council boundary and had 43,434 people at 30 June 2025.
When did the population of Alice Springs reach 30,000?
Alice Springs first reached 30,000 people at 30 June 2024, when its estimated population was 30,487. The population increased to 30,875 at 30 June 2025. On the same basis, the town reached 29,000 at 30 June 2022. It had previously reached 28,000 at 30 June 2009, before falling below that level from 2014 to 2019 and returning to it in 2020.
Where does Alice Springs rank among Australia's urban areas?
Alice Springs was tied with Mount Gambier as Australia's 50th-largest Significant Urban Area at 30 June 2025. Both had 30,875 people, while 49 urban areas had larger populations. By comparison, the Darwin urban area ranked 17th by population, with 145,019 people.
Section 09
Australia population statistics
References
- ABS Regional population, 2024-25: population estimates by SA2 and above, 2001 to 2025 (datacube 32180DS0003) · Australian Bureau of Statistics ↑ b c d
- ABS Regional population, 2024-25 · Australian Bureau of Statistics ↑
- ABS Regional population methodology, 2024-25 · Australian Bureau of Statistics ↑
- ABS Regional population, 2024-25: population estimates by LGA and Significant Urban Area, 2001 to 2025 (datacube 32180DS0004) · Australian Bureau of Statistics ↑ b c d e f g h i
- ABS Regional population, 2024-25: population components by LGA, 2021-22 to 2024-25 (datacube 32180DS0006) · Australian Bureau of Statistics ↑ b c
- ABS Regional population, 2024-25: population estimates and components by SA2, 2024 to 2025 (datacube 32180DS0001) · Australian Bureau of Statistics ↑ b
- ABS Regional population, 2024-25: population components by SA2 and above, 2021-22 to 2024-25 (datacube 32180DS0005) · Australian Bureau of Statistics ↑
- ABS Regional population, 2024-25: population estimates and components by LGA, 2024 to 2025 (datacube 32180DS0002) · Australian Bureau of Statistics ↑ b
