

Published 2 Sept 2026 · Updated 15 Sept 2026
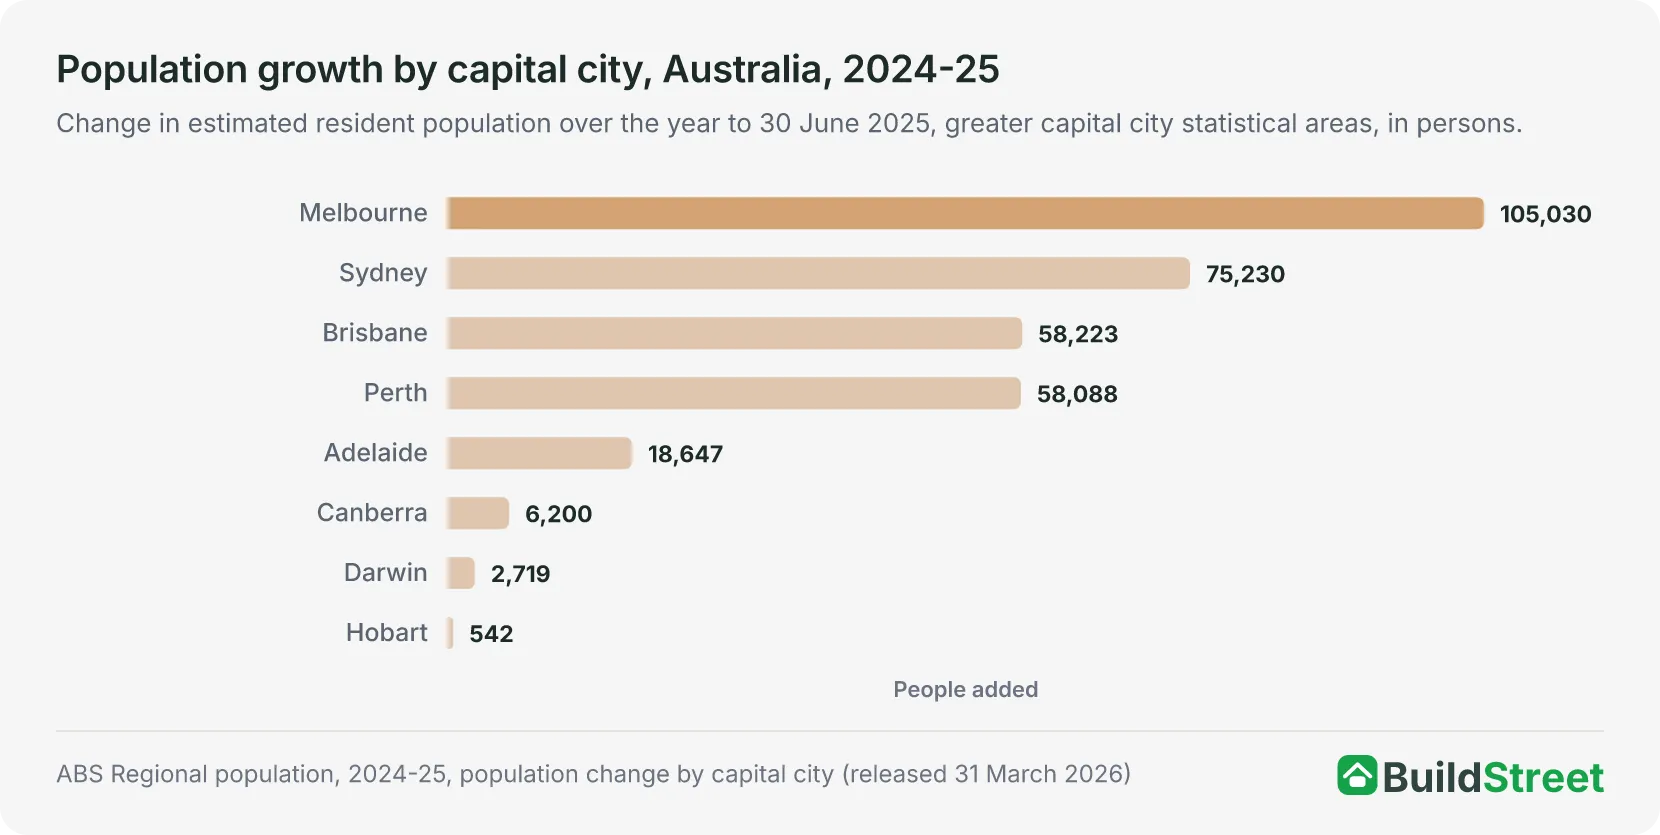 How other cities compareWollongong was Australia's eleventh largest urban area at 30 June 2025, and the fifth largest without a capital city. The cities article ranks growth across the country's capitals and regional centres.
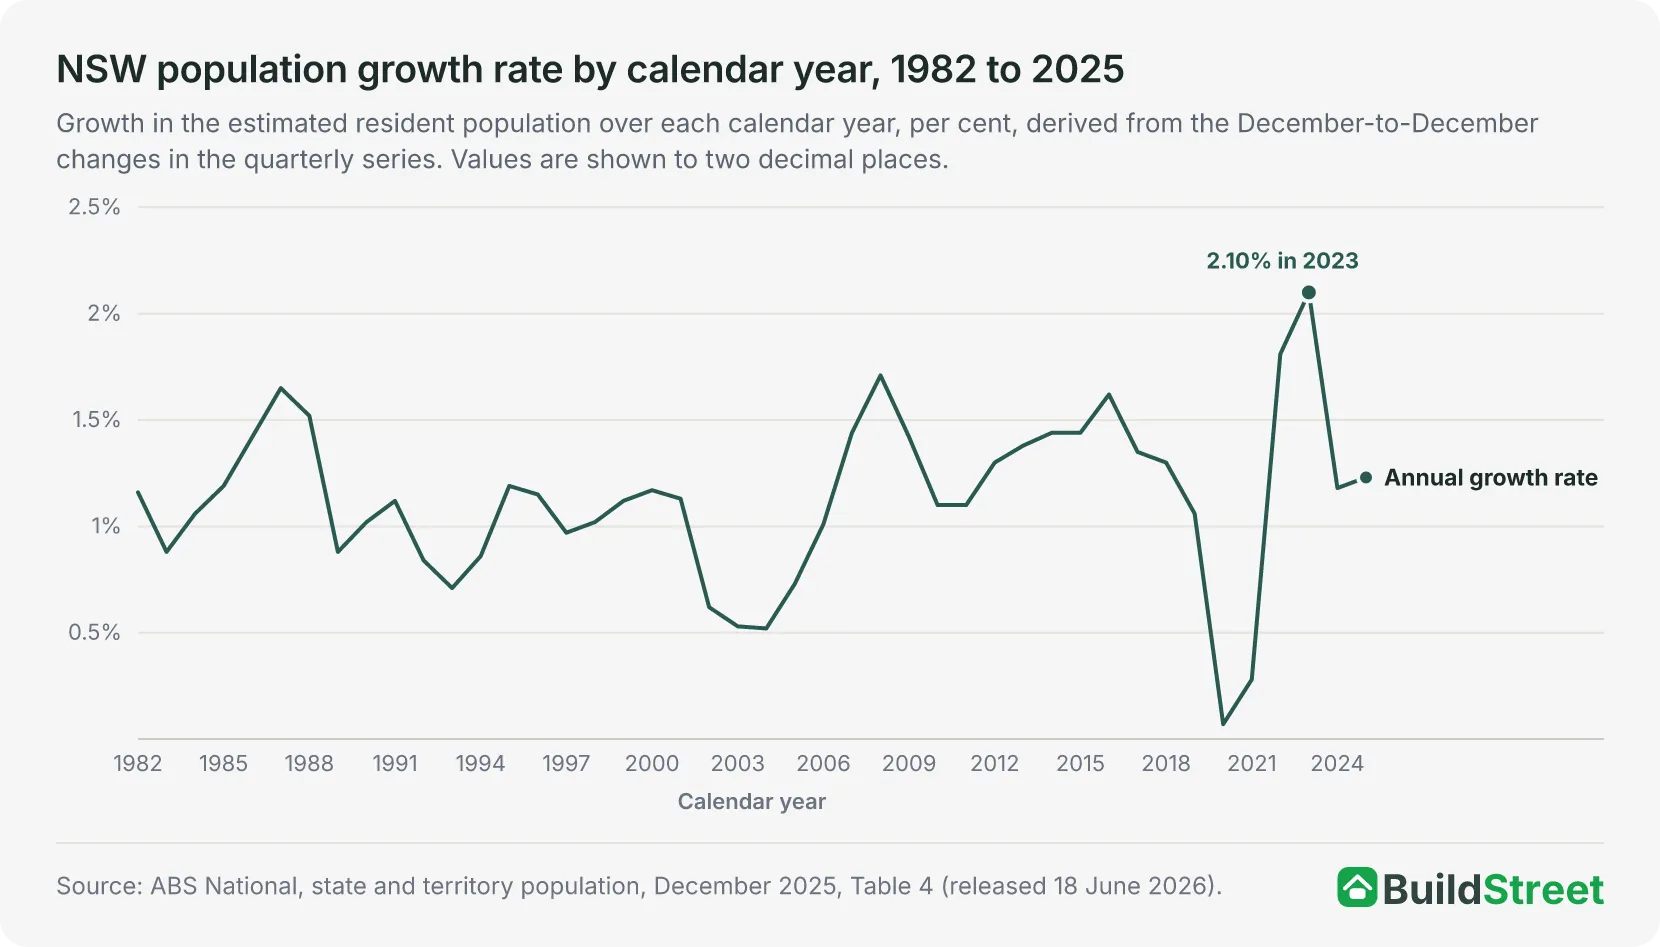 The state pictureNew South Wales had an estimated resident population of 8,592,524 at 30 June 2025 in the ABS annual series. The state article covers the total, its drivers and the split between Greater Sydney and the rest of the state.
Section 01 · The headline number
How many people live in Wollongong?
The Wollongong Significant Urban Area had an estimated resident population of 322,343 at 30 June 2025. That made Wollongong the fourth largest of the 36 urban areas in New South Wales, behind Sydney at 5,219,674, Newcastle - Maitland at 541,634 and the Central Coast at 354,1891. Wollongong accounted for 3.8 per cent of New South Wales' 8,592,524 people and 1.2 per cent of Australia's 27,613,6542.
The ABS updates the population estimate each year for 30 June. The count includes everyone who usually lives in the area regardless of citizenship or visa status, so temporary migrants such as international students are included while short-term visitors are not. In this release, the estimates are final for 2001 to 2021, revised for 2022 to 2024 and preliminary for 20253. The next release, covering 30 June 2026, is due on 25 March 20274.
Section 02 · The pace
How fast is Wollongong's population growing?
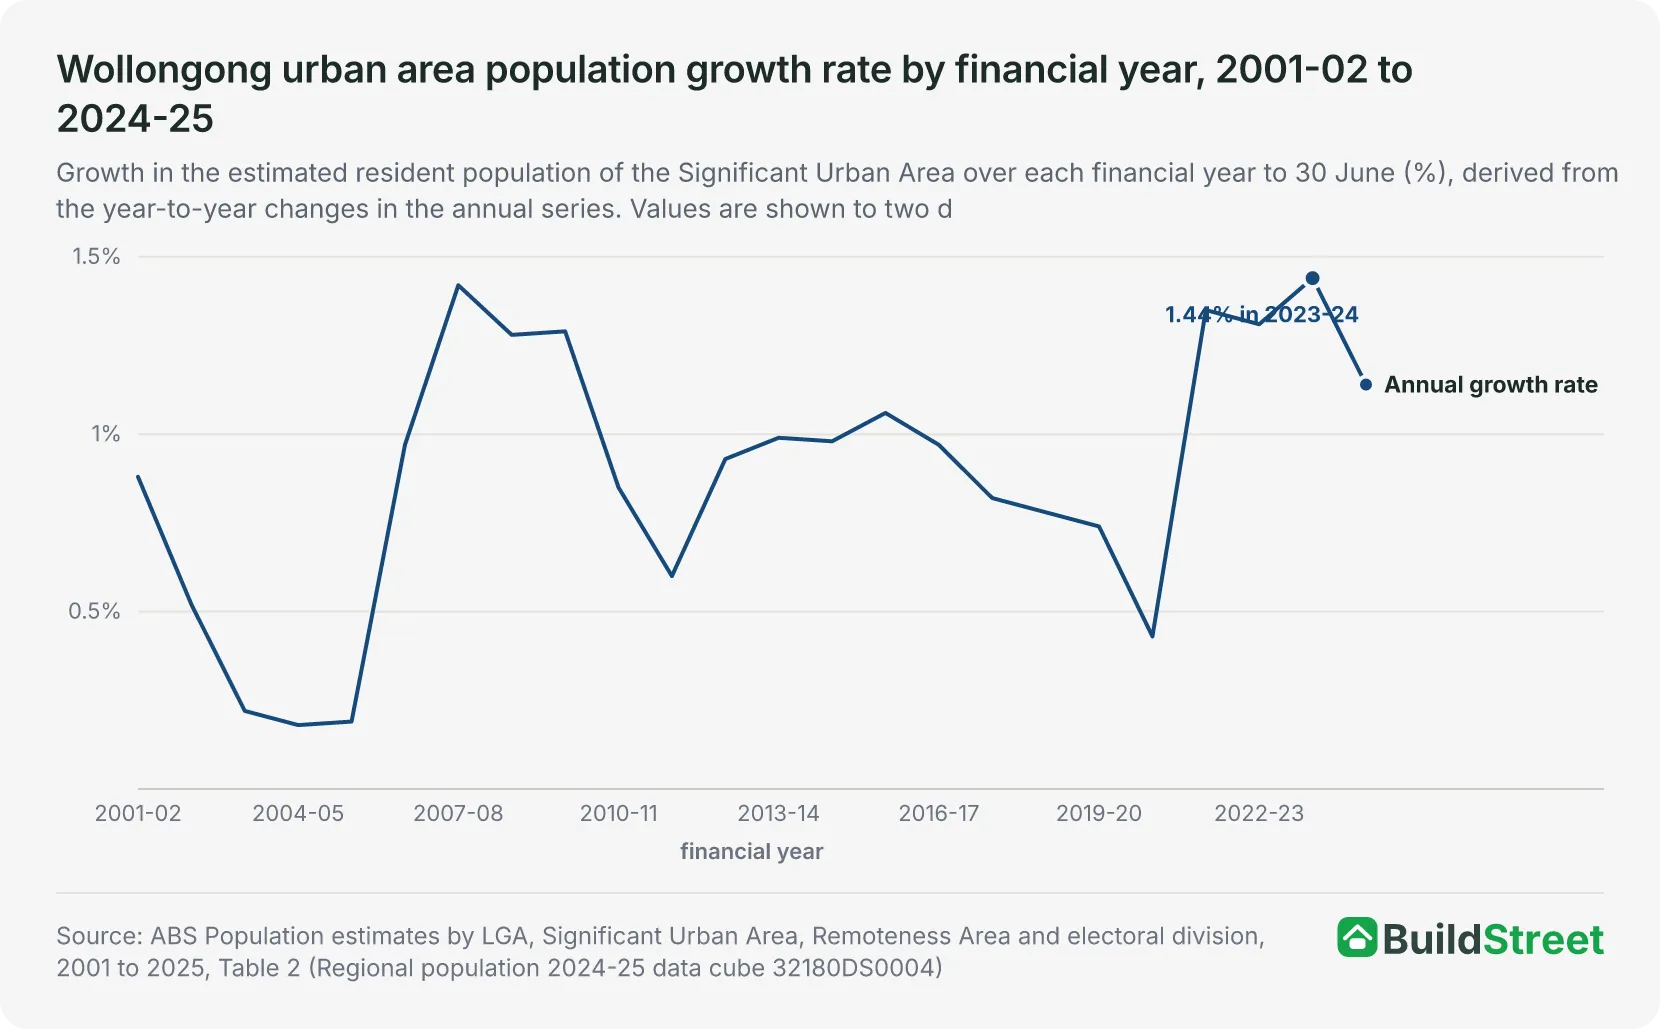
The Wollongong urban area grew by 3,642 people, or 1.14 per cent, in 2024-25. This was the smallest increase since 2020-21, when the urban area added 1,297 people. The three years between recorded larger gains of 4,116 in 2021-22, 4,076 in 2022-23 and 4,533 in 2023-241.
Across the 24 financial years from 2001-02 to 2024-25, annual growth ranged from 0.18 per cent to 1.44 per cent, and the population increased in every year. The highest rate, 1.44 per cent, was recorded in 2023-24, when Wollongong added 4,533 people, also the largest increase in this period. The slowest year was 2004-05, when the urban area added 484 people, or 0.18 per cent. Growth stayed below 0.25 per cent in each of the three years from 2003-04 to 2005-061.
The 2024-25 increase of 3,642 was larger than the increase in any year from 2010-11 to 2020-21. The largest increase during that period was 3,097 in 2015-16. Growth then slowed from 1.44 per cent in 2023-24 to 1.14 per cent in 2024-25, a decline of 0.30 percentage points1.
Section 03 · The drivers
What drives Wollongong's population growth?
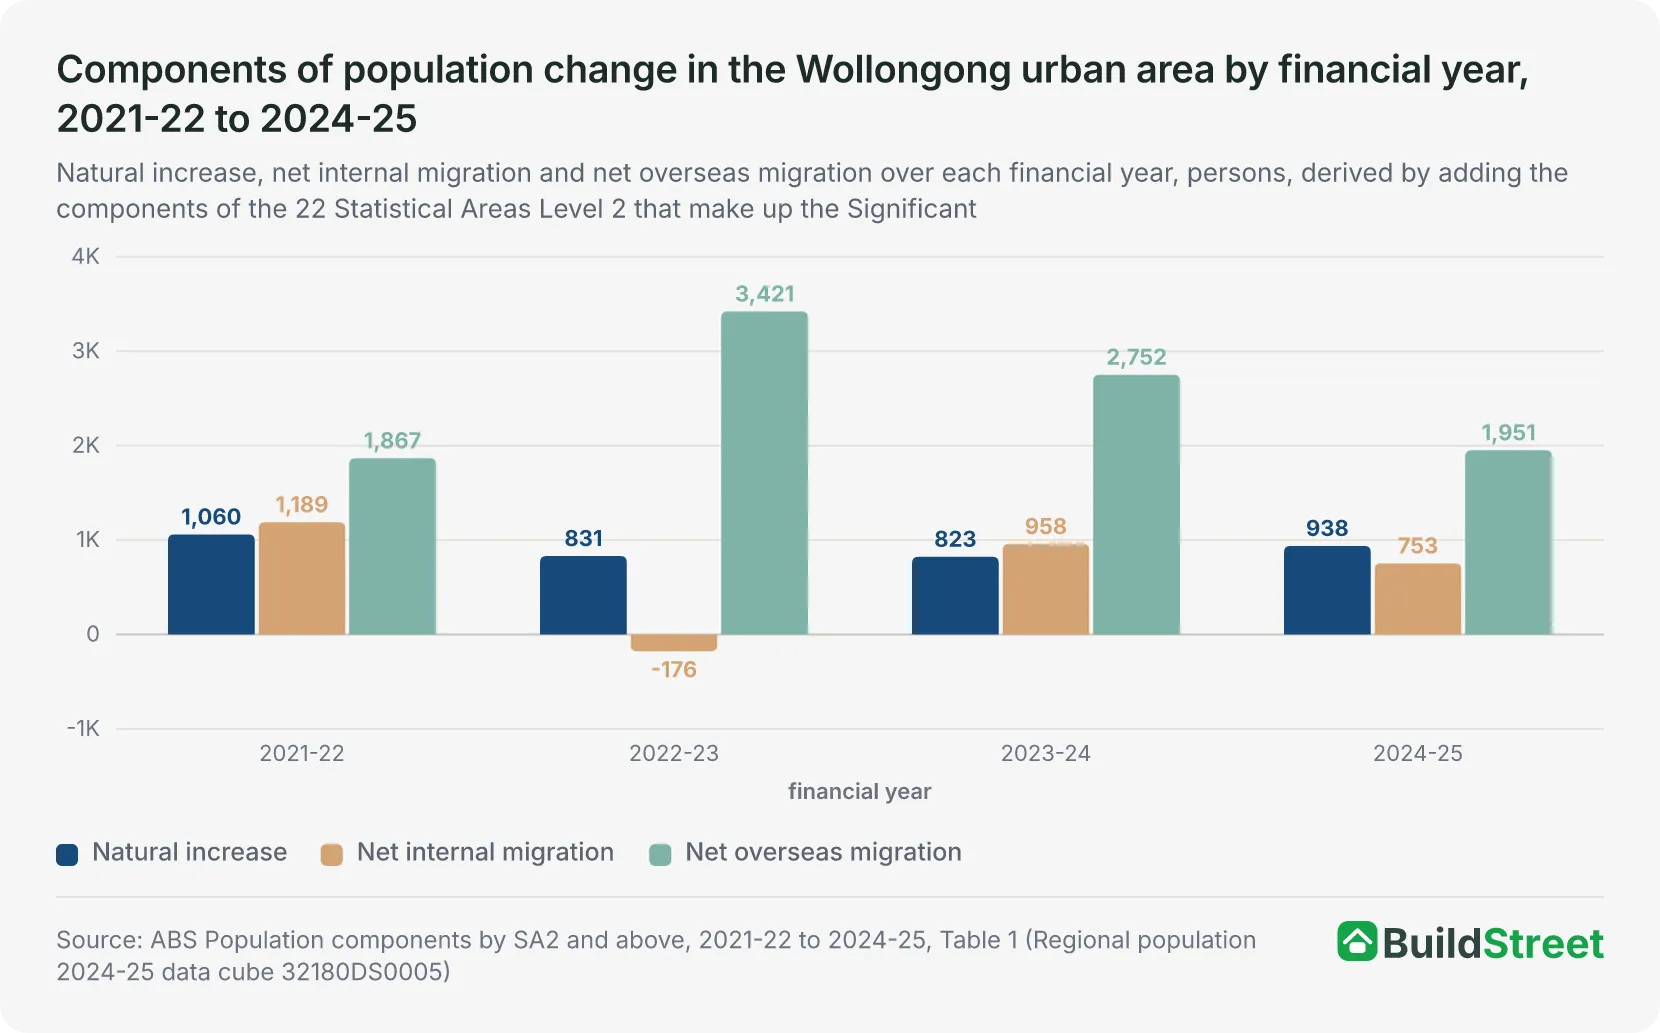
Net overseas migration was the largest contributor to Wollongong's population growth in 2024-25, adding 1,951 people, or 54 per cent of the urban area's 3,642-person increase. Natural increase (the excess of births over deaths) added 938 people, from 3,506 births and 2,568 deaths. Net internal migration (moves to and from elsewhere in Australia) added 753, from 25,258 arrivals and 24,505 departures5.
The ABS does not publish population components for urban areas, so Wollongong's figures are derived from the 22 smaller areas that make up the urban area.
Net overseas migration was also the largest component in each of the four years from 2021-22 to 2024-25. It peaked at 3,421 people in 2022-23, when net internal migration recorded a loss of 176 people. Net internal migration added 1,189 people in 2021-22, 958 in 2023-24 and 753 in 2024-25, while natural increase ranged from 823 to 1,060 across the four years.
The pattern varied by council area. Net overseas migration was the largest component of the Wollongong council area's 2024-25 increase of 2,123 people, adding 1,673, while net internal migration subtracted 112. In Shellharbour, net internal migration added 938 of the council area's 1,559-person increase. Kiama's population fell by 20, as deaths exceeded births by 62 and net internal migration subtracted 506. The Wollongong council area recorded a net internal migration loss in each of the four years from 2021-22 to 2024-25, while Shellharbour recorded a gain in each7.
| Components of population change by council area, 2024-25 | |||||
|---|---|---|---|---|---|
| Council area (LGA) | 30 June 2025 | Natural increase | Net internal migration | Net overseas migration | Total change |
| Wollongong | 224,327 | +562 | -112 | +1,673 | +2,123 |
| Shellharbour | 83,228 | +403 | +938 | +218 | +1,559 |
| Kiama | 23,139 | -62 | -50 | +92 | -20 |
Source · ABS Population estimates and components by LGA, 2024 to 2025, Table 1
Section 04 · The growth areas
Where in Wollongong is the population growing fastest?
Shellharbour had the fastest population growth of the three council areas in 2024-25, at 1.91 per cent. The Wollongong council area grew 0.96 per cent, while Kiama's population fell by 0.09 per cent6.
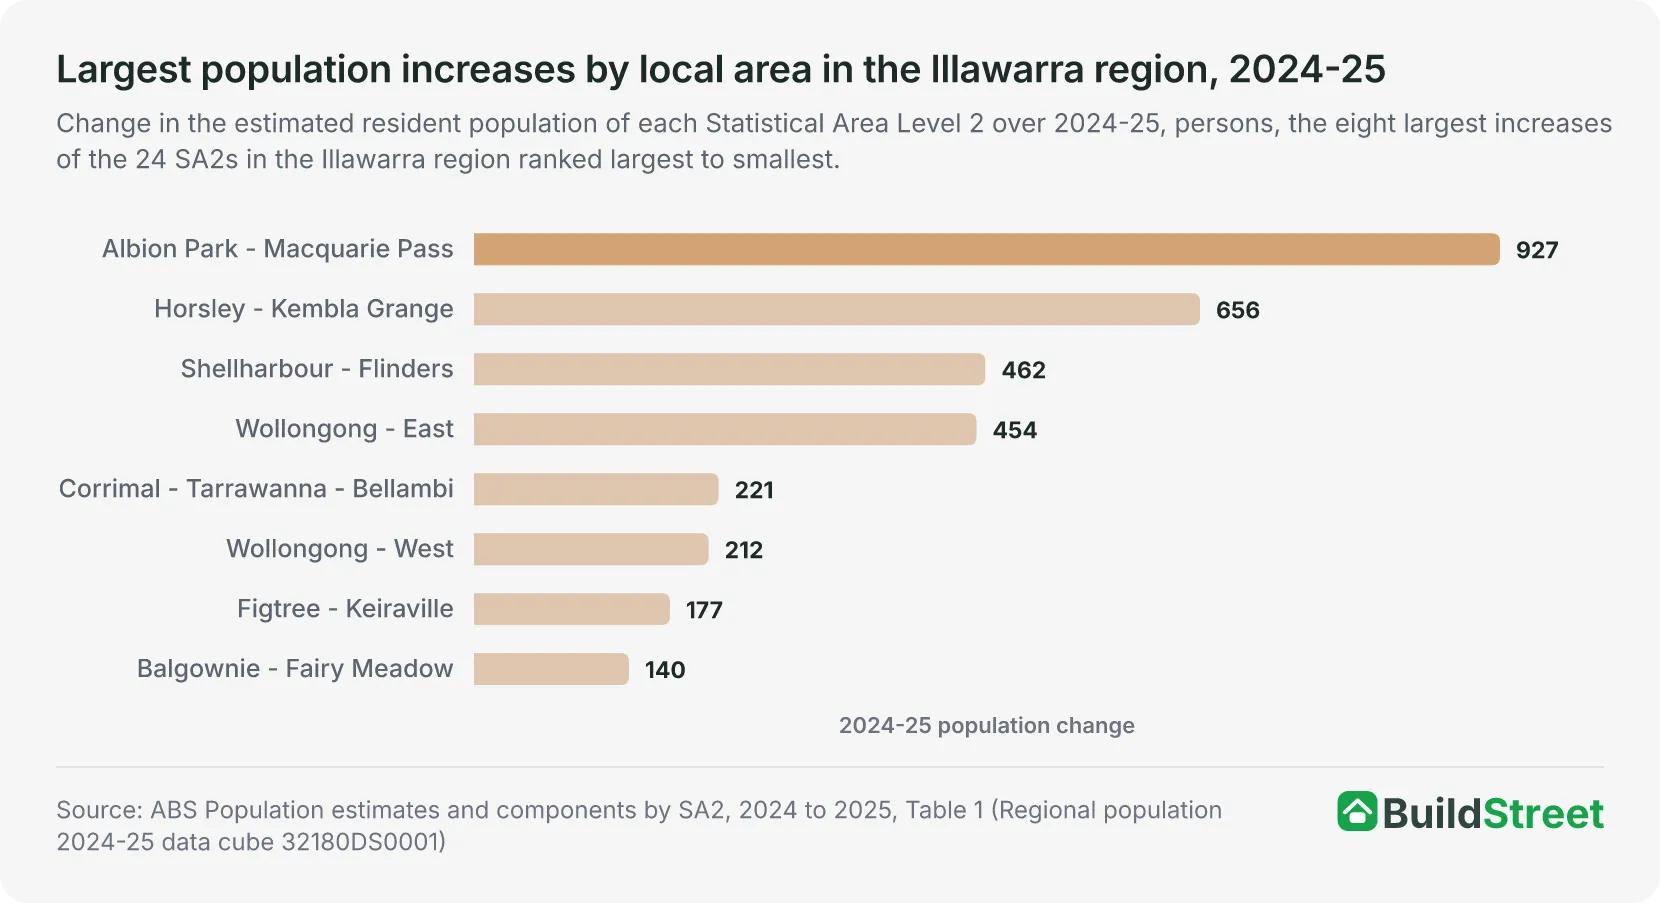
Among the 24 local areas in the Illawarra region, Albion Park - Macquarie Pass recorded the largest increase in 2024-25, adding 927 people, or 4.1 per cent, to reach 23,649. Horsley - Kembla Grange had the highest growth rate, at 4.7 per cent, adding 656 people to reach 14,750. Shellharbour - Flinders added 462 people, or 2.3 per cent, while Wollongong - East added 454, or 2.5 per cent8.
Net internal migration was the largest component of growth in Albion Park - Macquarie Pass, Horsley - Kembla Grange and Shellharbour - Flinders, adding 655, 526 and 325 people respectively. In Wollongong - East, net overseas migration added 415 of the 454-person increase. It was also the largest component in Wollongong - West, Figtree - Keiraville and Balgownie - Fairy Meadow8.
Overall, 20 of the 24 areas grew. Two were unchanged and each had fewer than 10 residents. The two areas that declined were Port Kembla - Warrawong, down 84 people, and Kiama Downs - Minnamurra, down 468.
| Local areas of the Illawarra with the largest population increases, 2024-25 | |||||
|---|---|---|---|---|---|
| Area (SA2) | Region (SA3) | 30 June 2024 | 30 June 2025 | Change | Growth rate % |
| Albion Park - Macquarie Pass | Kiama - Shellharbour | 22,722 | 23,649 | +927 | 4.1 |
| Horsley - Kembla Grange | Dapto - Port Kembla | 14,094 | 14,750 | +656 | 4.7 |
| Shellharbour - Flinders | Kiama - Shellharbour | 20,502 | 20,964 | +462 | 2.3 |
| Wollongong - East | Wollongong | 17,820 | 18,274 | +454 | 2.5 |
| Corrimal - Tarrawanna - Bellambi | Wollongong | 16,483 | 16,704 | +221 | 1.3 |
Source · ABS Population estimates and components by SA2, 2024 to 2025, Table 1
Section 05 · The state picture
How does Wollongong compare with other cities in New South Wales?
Wollongong was the fourth-largest urban area in New South Wales at 30 June 2025, a position it has held in every year since 2001. Sydney, Newcastle - Maitland and the Central Coast were the three larger urban areas. Albury - Wodonga was the next largest, with 102,435 people, less than a third of Wollongong's population. It crosses the Victorian border but is listed once in the data, under New South Wales1.
The gap between the Central Coast and Wollongong was 31,846 people at 30 June 2025, similar to the 30,930-person gap at 30 June 2001. It reached 39,775 at 30 June 2019, the widest gap during this period, before narrowing in each of the next six years1.
In 2024-25, Wollongong grew 1.14 per cent, lower than Sydney's 1.37 per cent and Newcastle - Maitland's 1.30 per cent, and higher than the Central Coast's 0.68 per cent1. Across the rest of the state outside Greater Sydney, the population grew from 2,928,450 to 2,953,694 over the year, an increase of 25,244, or 0.86 per cent2.
Sydney's population data is covered in the Sydney population article.
| The largest urban areas in New South Wales, as at 30 June 2025 | ||||
|---|---|---|---|---|
| Urban area (SUA) | 30 June 2001 | 30 June 2025 | Change over 2024-25 | Growth rate % |
| Sydney | 3,767,030 | 5,219,674 | +70,670 | 1.37 |
| Newcastle - Maitland | 412,810 | 541,634 | +6,953 | 1.30 |
| Central Coast | 291,585 | 354,189 | +2,401 | 0.68 |
| Wollongong | 260,655 | 322,343 | +3,642 | 1.14 |
| Albury - Wodonga | 76,451 | 102,435 | +1,183 | 1.17 |
| Coffs Harbour | 58,374 | 77,244 | +511 | 0.67 |
| Wagga Wagga | 49,075 | 58,117 | -13 | -0.02 |
Source · ABS Population estimates by LGA, Significant Urban Area, Remoteness Area and electoral division, 2001 to 2025, Table 2
Section 06 · The national rank
Where does Wollongong rank among Australia's largest cities?
Wollongong was Australia's eleventh-largest urban area, out of 102 at 30 June 2025. The ten larger areas ranged from Melbourne, at 5,328,274 people, to the Central Coast, at 354,189. Wollongong ranked tenth from 2001 to 2005 and eleventh from 2006 onwards, when the Sunshine Coast, with 270,853 people, overtook it1. Among the urban areas that do not contain a capital city, Wollongong was the fifth largest, after Gold Coast - Tweed Heads, Newcastle - Maitland, the Sunshine Coast and the Central Coast.
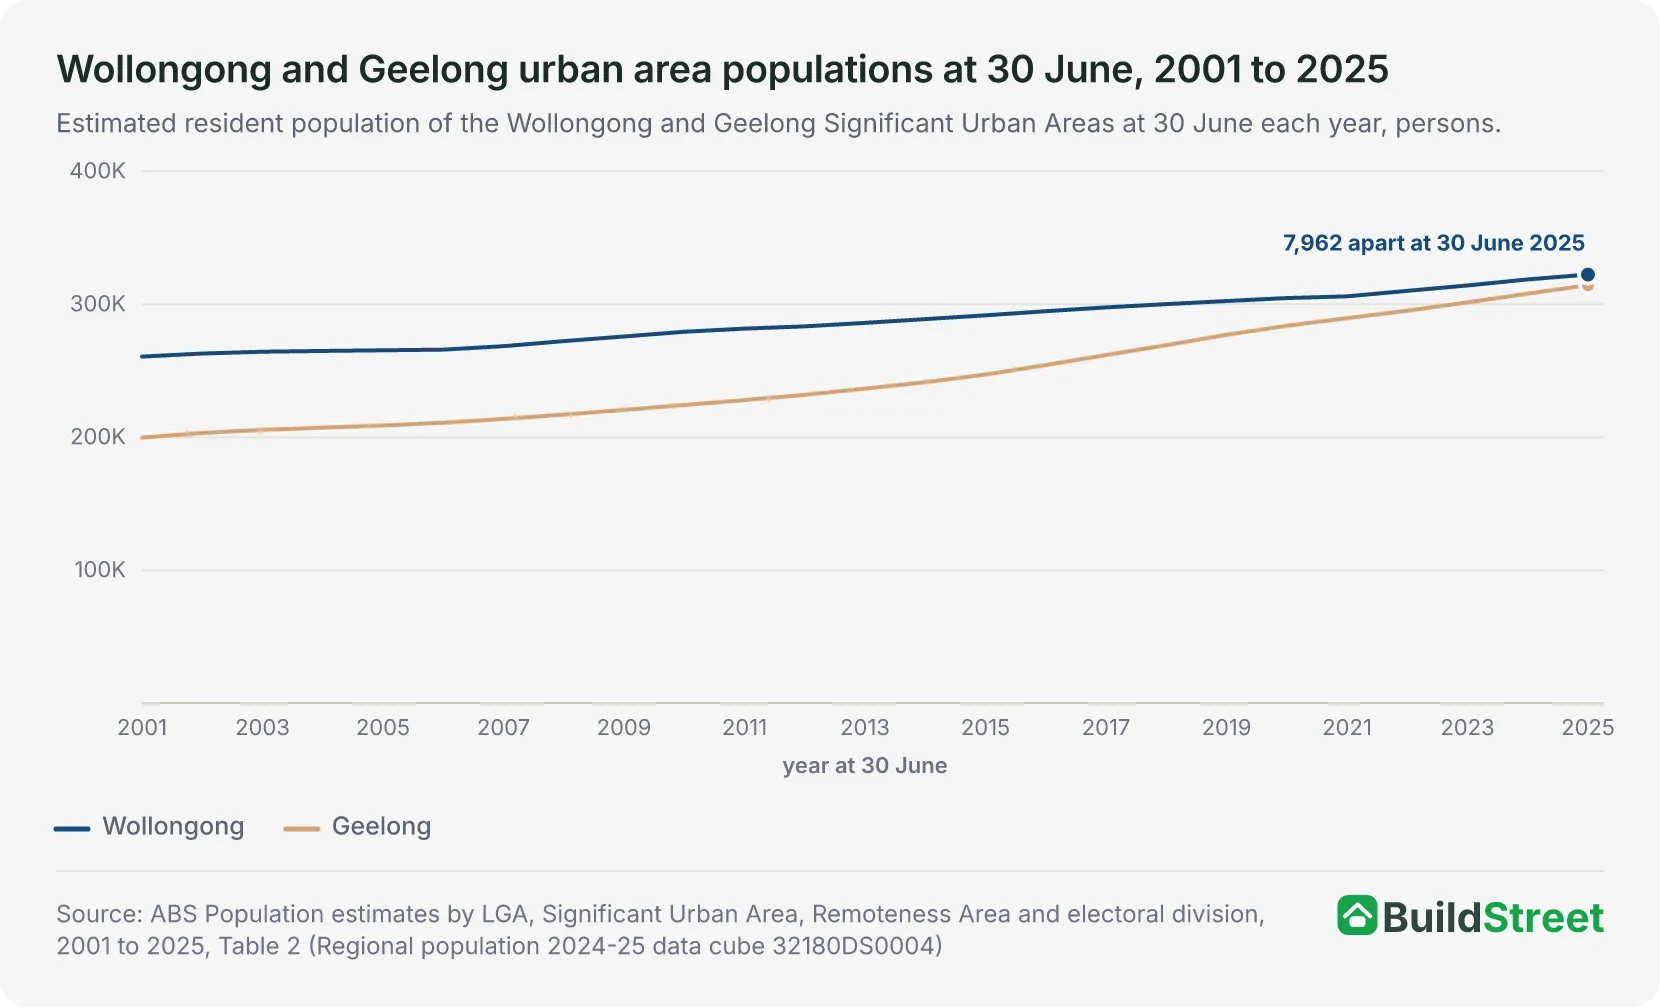
Geelong, the twelfth largest at 314,381, had 7,962 fewer people than Wollongong at 30 June 2025. The gap was 60,923 at 30 June 2001. Geelong added more people than Wollongong in 23 of the 24 years between 2001 and 2025, with 2007-08 the only exception. In 2024-25, Geelong added 6,360 people, or 2.06 per cent, compared with Wollongong's 3,642, or 1.14 per cent1.
Geelong's data is covered in the Geelong population article.
Among Australia's 12 largest urban areas, 2024-25 growth ranged from 0.68 per cent on the Central Coast to 2.40 per cent in Perth. Wollongong's 1.14 per cent matched Canberra - Queanbeyan's rate to two decimal places, while only the Central Coast grew more slowly1.
| Australia's twelve largest urban areas, as at 30 June 2025 | |||
|---|---|---|---|
| Urban area (SUA) | Population | Change over 2024-25 | Growth rate % |
| Melbourne | 5,328,274 | +102,910 | 1.97 |
| Sydney | 5,219,674 | +70,670 | 1.37 |
| Brisbane | 2,745,086 | +56,017 | 2.08 |
| Perth | 2,430,757 | +56,991 | 2.40 |
| Adelaide | 1,470,938 | +18,417 | 1.27 |
| Gold Coast - Tweed Heads | 761,634 | +12,279 | 1.64 |
| Newcastle - Maitland | 541,634 | +6,953 | 1.30 |
| Canberra - Queanbeyan | 521,049 | +5,894 | 1.14 |
| Sunshine Coast | 424,741 | +8,018 | 1.92 |
| Central Coast | 354,189 | +2,401 | 0.68 |
| Wollongong | 322,343 | +3,642 | 1.14 |
| Geelong | 314,381 | +6,360 | 2.06 |
Source · ABS Population estimates by LGA, Significant Urban Area, Remoteness Area and electoral division, 2001 to 2025, Table 2
Section 07 · The long run
How has Wollongong's population changed since 2001?
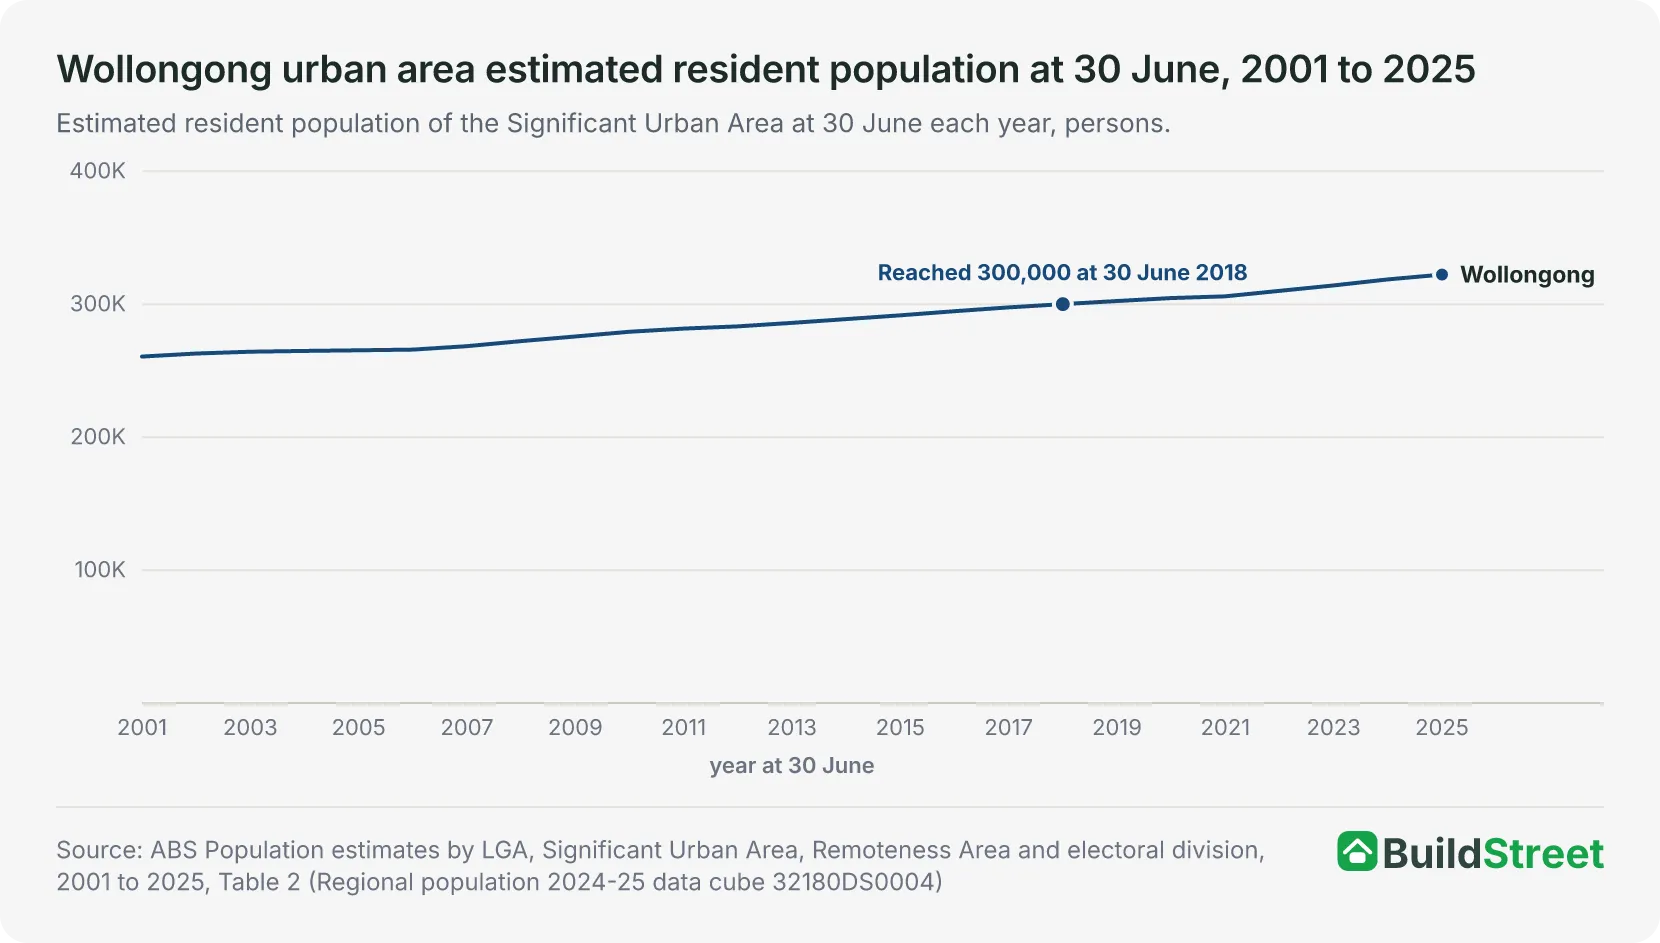
The urban area added 61,688 people from 30 June 2001 to 30 June 2025, growing from 260,655 to 322,343, an increase of 23.7 per cent1.
Wollongong first reached 300,000 people at 30 June 2018 and 320,000 at 30 June 20251. It took three or four years to move between each 10,000-person milestone from 270,000 to 320,000.
The three council areas grew at different rates over the same period. The Wollongong council area grew from 188,275 people in 2001 to 224,327 in 2025, an increase of 36,052, or 19.1 per cent. It first reached 200,000 residents at 30 June 2010, when its population was 200,4681.
Shellharbour recorded the fastest growth of the three council areas, increasing from 59,383 to 83,228, a rise of 40.2 per cent. Kiama grew from 19,793 to 23,139, an increase of 16.9 per cent. Its population fell by 20 people in 2024-25, the first annual decline since 2005-061.
| Wollongong urban area population milestones in the annual series | ||
|---|---|---|
| Milestone | First 30 June at or above | Population that year |
| 270,000 | 30 June 2008 | 272,289 |
| 280,000 | 30 June 2011 | 281,700 |
| 290,000 | 30 June 2015 | 291,687 |
| 300,000 | 30 June 2018 | 300,103 |
| 310,000 | 30 June 2022 | 310,092 |
| 320,000 | 30 June 2025 | 322,343 |
Source · ABS Population estimates by LGA, Significant Urban Area, Remoteness Area and electoral division, 2001 to 2025, Table 2
Section 08
Wollongong population: quick answers
How many people live in Wollongong?
The Wollongong Significant Urban Area had an estimated resident population of 322,343 at 30 June 2025. That was the fourth-largest population of the 36 urban areas in New South Wales and the eleventh-largest in Australia. The 30 June 2025 estimates are preliminary. The next release, covering 30 June 2026, is due on 25 March 2027.
Is Wollongong the third-largest city in New South Wales?
Wollongong was the fourth largest of the 36 Significant Urban Areas in New South Wales at 30 June 2025, with 322,343 residents, after Sydney at 5,219,674, Newcastle - Maitland at 541,634 and the Central Coast at 354,189. The ABS lists the Central Coast as a separate urban area, although the Central Coast region sits within Greater Sydney on the capital-city boundaries.
How fast is Wollongong's population growing?
The Wollongong urban area grew by 3,642 people, or 1.14 per cent, in 2024-25. The population increased in every year from 2001-02. Growth peaked at 4,533 people, or 1.44 per cent, in 2023-24, while the 2024-25 increase was the smallest since 2020-21.
What is the difference between the Wollongong urban area and the Wollongong council area?
The Wollongong urban area is a Significant Urban Area, covering 22 smaller areas from Helensburgh to Kiama. It had 322,343 people at 30 June 2025. The Wollongong council area uses a different boundary, and it had 224,327 people on the same date. The two population figures therefore measure different areas.
Is Geelong bigger than Wollongong?
Wollongong was larger than Geelong at 30 June 2025, with 322,343 residents compared with 314,381 in the Geelong urban area, a gap of 7,962 people. The margin was 60,923 at 30 June 2001. Geelong added more people than Wollongong in 23 of the 24 years from 2001-02 to 2024-25, with 2007-08 the only exception.
When did Wollongong's population pass 300,000?
The Wollongong urban area first reached 300,000 people at 30 June 2018, when its estimated resident population was 300,103. It passed 280,000 at 30 June 2011, 310,000 at 30 June 2022 and 320,000 at 30 June 2025. The Wollongong council area passed 200,000 residents at 30 June 2010.
References
- ABS Regional population, 2024-25: population estimates by LGA and Significant Urban Area, 2001 to 2025 (datacube 32180DS0004) · Australian Bureau of Statistics ↑ b c d e f g h i j k l m n o
- ABS Regional population, 2024-25: population estimates by SA2 and above, 2001 to 2025 (datacube 32180DS0003) · Australian Bureau of Statistics ↑ b c
- ABS Regional population methodology, 2024-25 · Australian Bureau of Statistics ↑ b
- ABS Regional population, 2024-25 · Australian Bureau of Statistics ↑
- ABS Regional population, 2024-25: population components by SA2 and above, 2021-22 to 2024-25 (datacube 32180DS0005) · Australian Bureau of Statistics ↑
- ABS Regional population, 2024-25: population estimates and components by LGA, 2024 to 2025 (datacube 32180DS0002) · Australian Bureau of Statistics ↑ b
- ABS Regional population, 2024-25: population components by LGA, 2021-22 to 2024-25 (datacube 32180DS0006) · Australian Bureau of Statistics ↑
- ABS Regional population, 2024-25: population estimates and components by SA2, 2024 to 2025 (datacube 32180DS0001) · Australian Bureau of Statistics ↑ b c
