

Published 2 Sept 2026 · Updated 15 Sept 2026
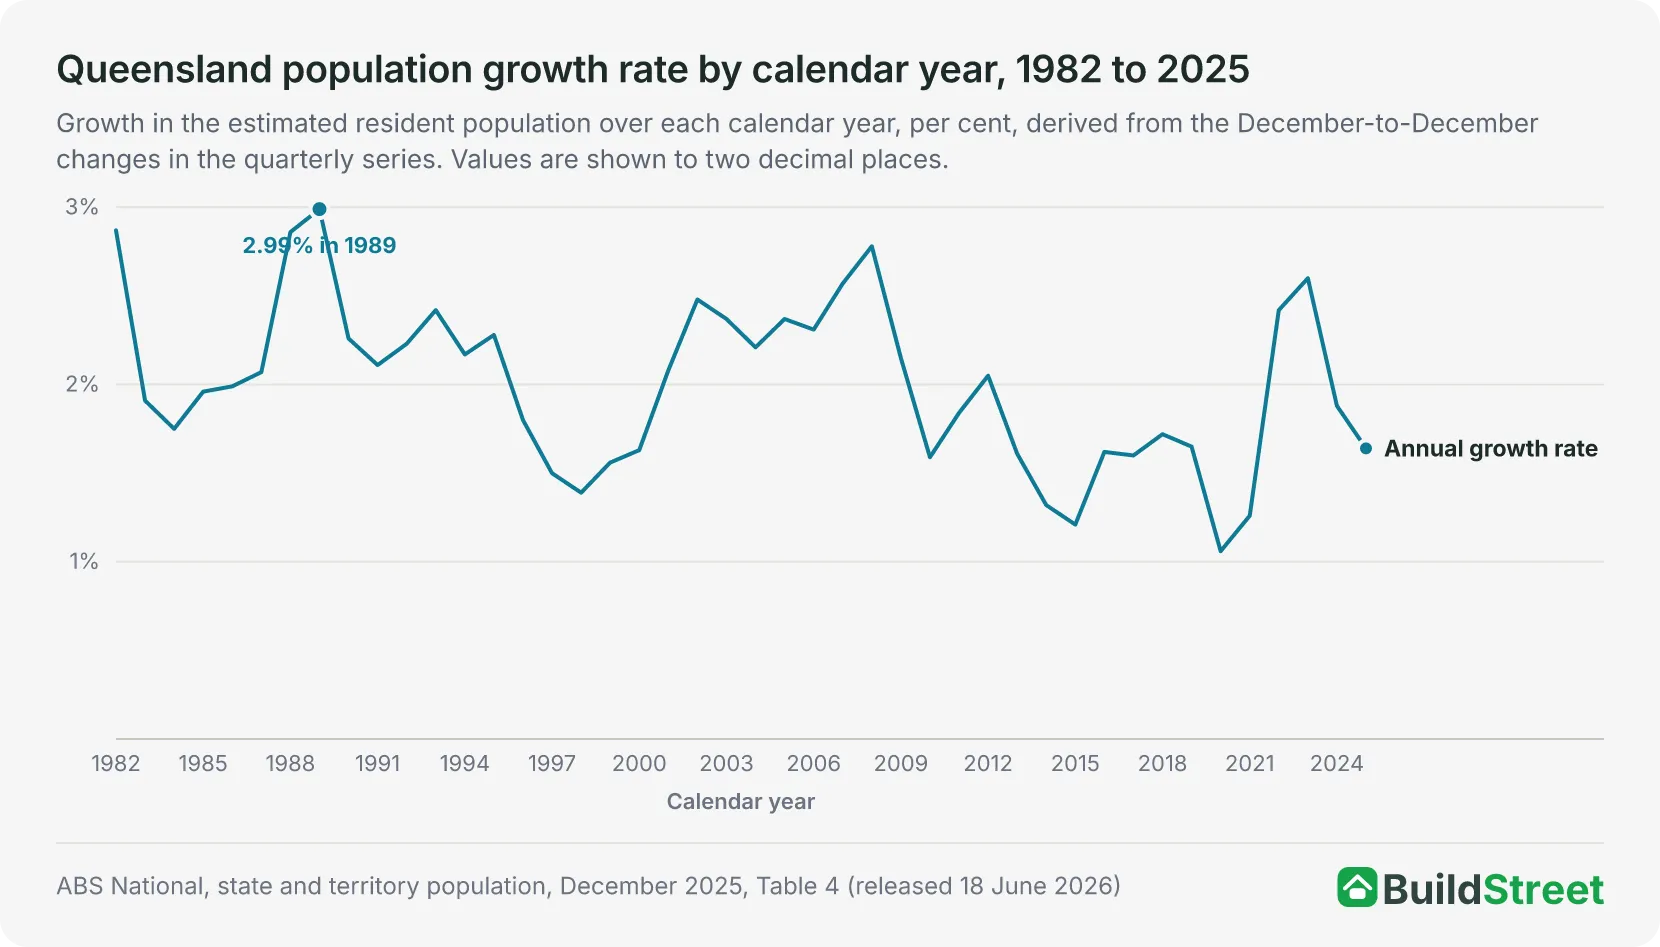 The state pictureQueensland had an estimated resident population of 5,669,764 at 30 June 2025 in the ABS annual series, after adding 97,874 people over 2024-25. The state article covers the total, its drivers and the split between Greater Brisbane and the rest of the state.
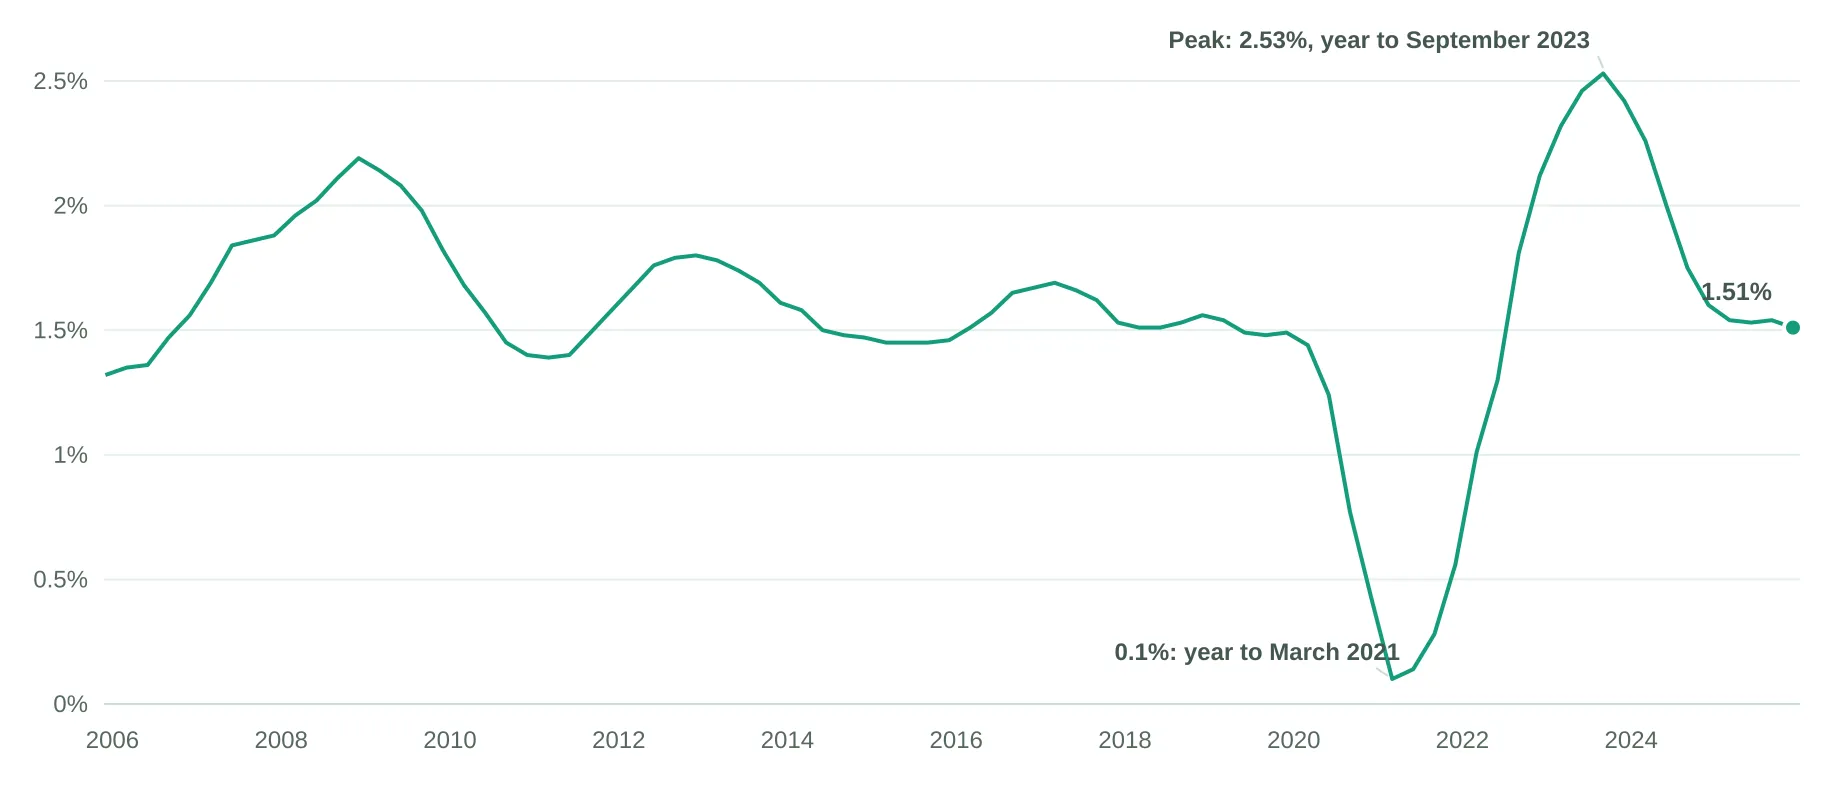 The national pictureAustralia had an estimated resident population of 27,613,654 at 30 June 2025, and Toowoomba's urban area ranked 16th among its 102 Significant Urban Areas. The national article covers the total, its growth and its drivers.
Section 01 · The headline number
How many people live in Toowoomba?
The Toowoomba Significant Urban Area had an estimated resident population of 153,781 at 30 June 2025. That was the sixth-largest of Queensland's 19 urban areas, behind Brisbane, Gold Coast - Tweed Heads, the Sunshine Coast, Townsville and Cairns, and the 16th-largest of Australia's 102 urban areas1. Toowoomba accounted for 2.7 per cent of Queensland's estimated 5,669,764 people and 0.56 per cent of Australia's 27,613,654 people2.
The ABS publishes population estimates annually for 30 June. In the 2024-25 release, the estimates are final for 2001 to 2021, revised for 2022 to 2024 and preliminary for 20253. The next release, covering 30 June 2026, is due on 25 March 20274.
Section 02 · The pace
How fast is Toowoomba's population growing?
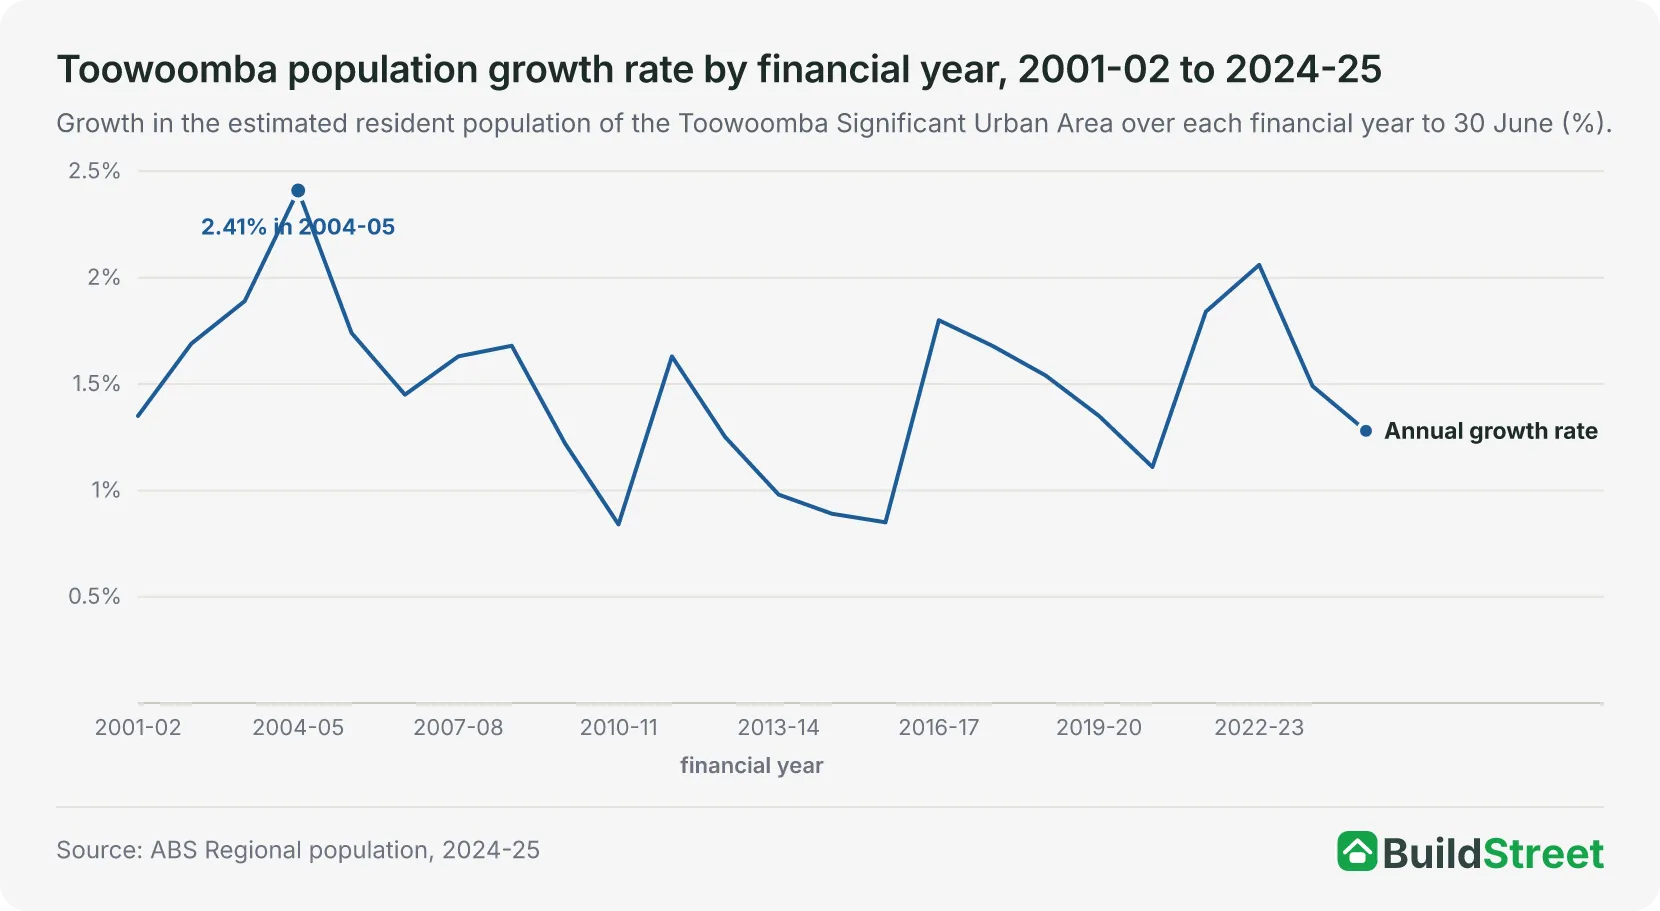
The Toowoomba urban area grew by 1,943 people, or 1.28 per cent, in 2024-25. The increase was the smallest since 2020-21, when the urban area added 1,581 people. The three years in between recorded larger gains of 2,649 in 2021-22, 3,022 in 2022-23 and 2,225 in 2023-241.
Across the 24 financial years from 2001-02 to 2024-25, annual growth ranged from 0.84 per cent to 2.41 per cent, and the population increased in every year. The highest rate, 2.41 per cent, was recorded in 2004-05, when the urban area added 2,737 people. The largest increase came later, at 3,022 people (2.06 per cent) in 2022-23. The lowest rate was 0.84 per cent in 2010-11, when the urban area added 1,051 people1.
Growth exceeded 1 per cent in each of the nine years from 2016-17 to 2024-25, after three years below 1 per cent from 2013-14 to 2015-16. Toowoomba's rate was below Queensland's in 19 of the 24 years. In 2024-25, the state grew 1.76 per cent, adding 97,874 people2.
Section 03 · The drivers
What drives Toowoomba's population growth?
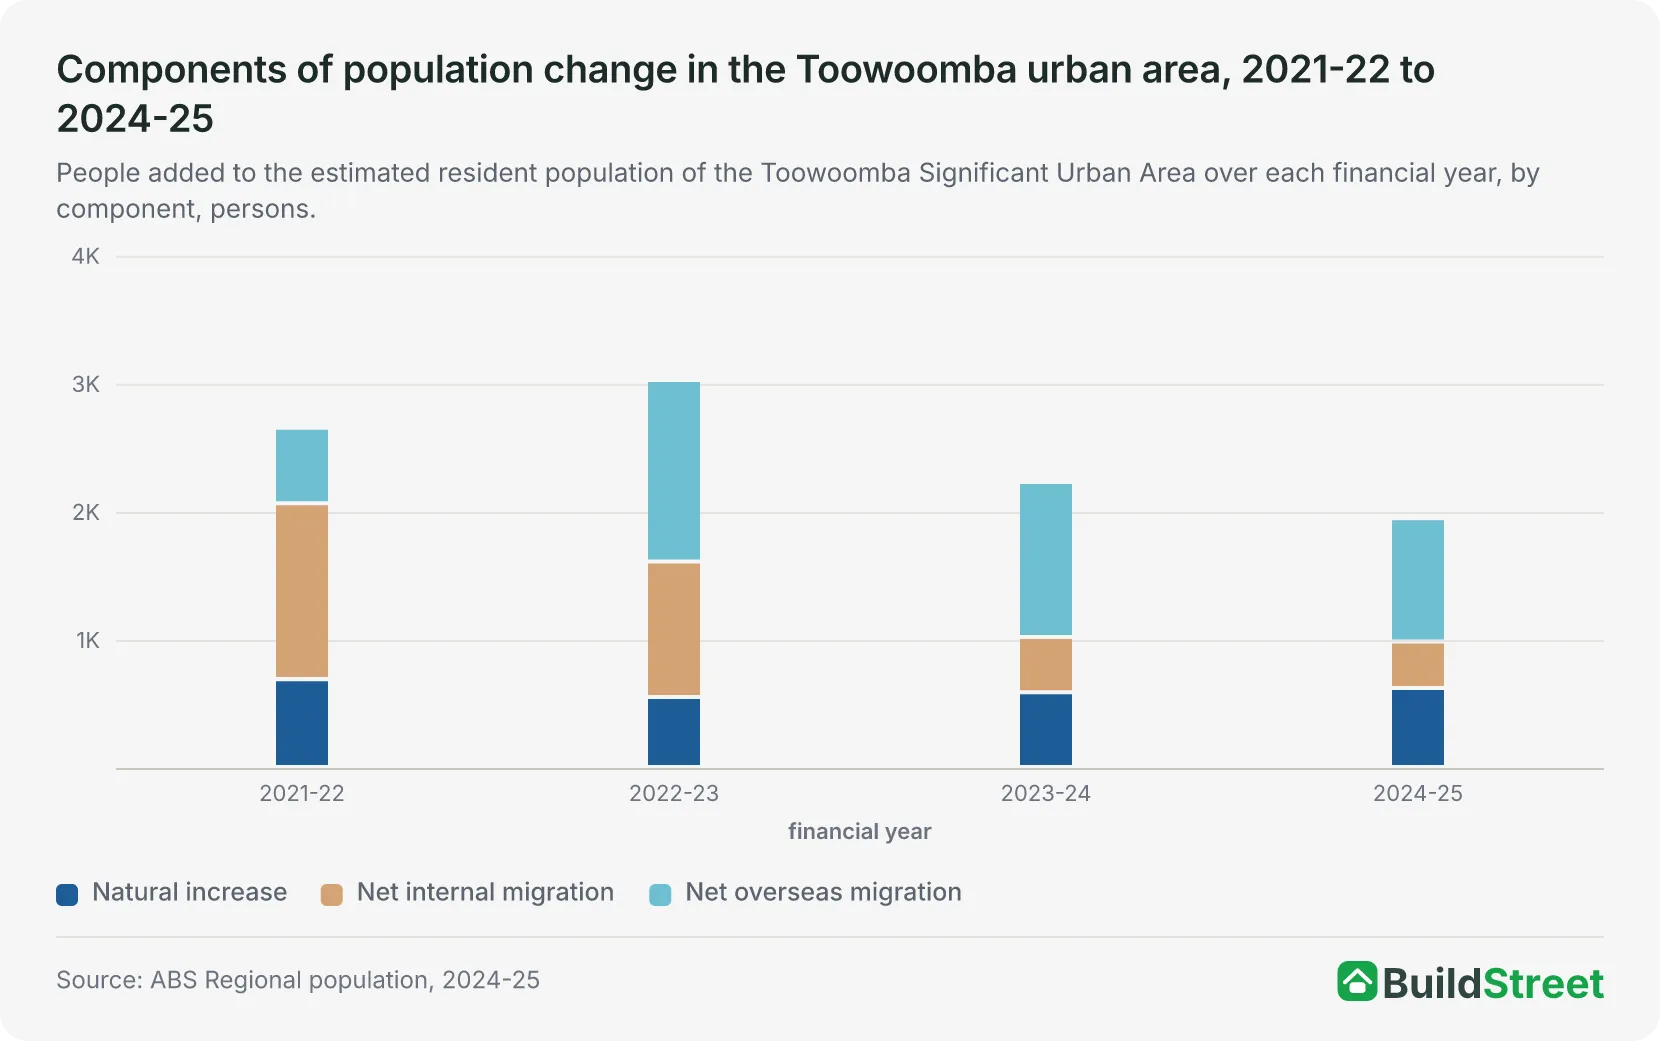
Net overseas migration was the largest component of the Toowoomba urban area's growth in 2024-25, adding 964 people. It accounted for 49.6 per cent of the area's increase of 1,943 people. Natural increase (the excess of births over deaths) added 617 people, and net internal migration (moves to and from elsewhere in Australia) added 3626. Together, the three components accounted for the urban area's increase of 1,943.
The ABS does not publish population components for urban areas, so the Toowoomba figures are calculated by adding the published data for the 13 smaller areas (SA2s) that make up the urban area2.
In 2021-22, net internal migration was the largest component, adding 1,373 of the 2,649 people the urban area gained. Net overseas migration was the largest component in each of the three years that followed, at 1,417 in 2022-23, 1,209 in 2023-24 and 964 in 2024-25. Net internal migration fell from 1,059 in 2022-23 to 432 in 2023-24 and 362 in 2024-257.
The Toowoomba Regional Council area gained 2,201 people in 2024-25. Net overseas migration was the largest component, adding 1,017 of those people, natural increase added 620 and net internal migration added 564. The council area recorded 2,179 births and 1,559 deaths over the year, along with 9,486 arrivals from elsewhere in Australia and 8,922 departures8.
| Components of population change by Toowoomba boundary, 2024-25 | ||||
|---|---|---|---|---|
| Boundary | Natural increase | Net internal migration | Net overseas migration | Total change |
| Toowoomba urban area (derived) | +617 | +362 | +964 | +1,943 |
| Toowoomba Regional Council (LGA) | +620 | +564 | +1,017 | +2,201 |
| Toowoomba statistical region (SA4) | +699 | +364 | +1,277 | +2,340 |
Source · ABS Population estimates and components by SA2, 2024 to 2025 (Table 3), ABS Population estimates and components by LGA, 2024 to 2025 (Table 3) and ABS Population components by SA2 and above, 2021-22 to 2024-25 (Table 3)
Section 04 · The growth areas
Where in Toowoomba is the population growing fastest?
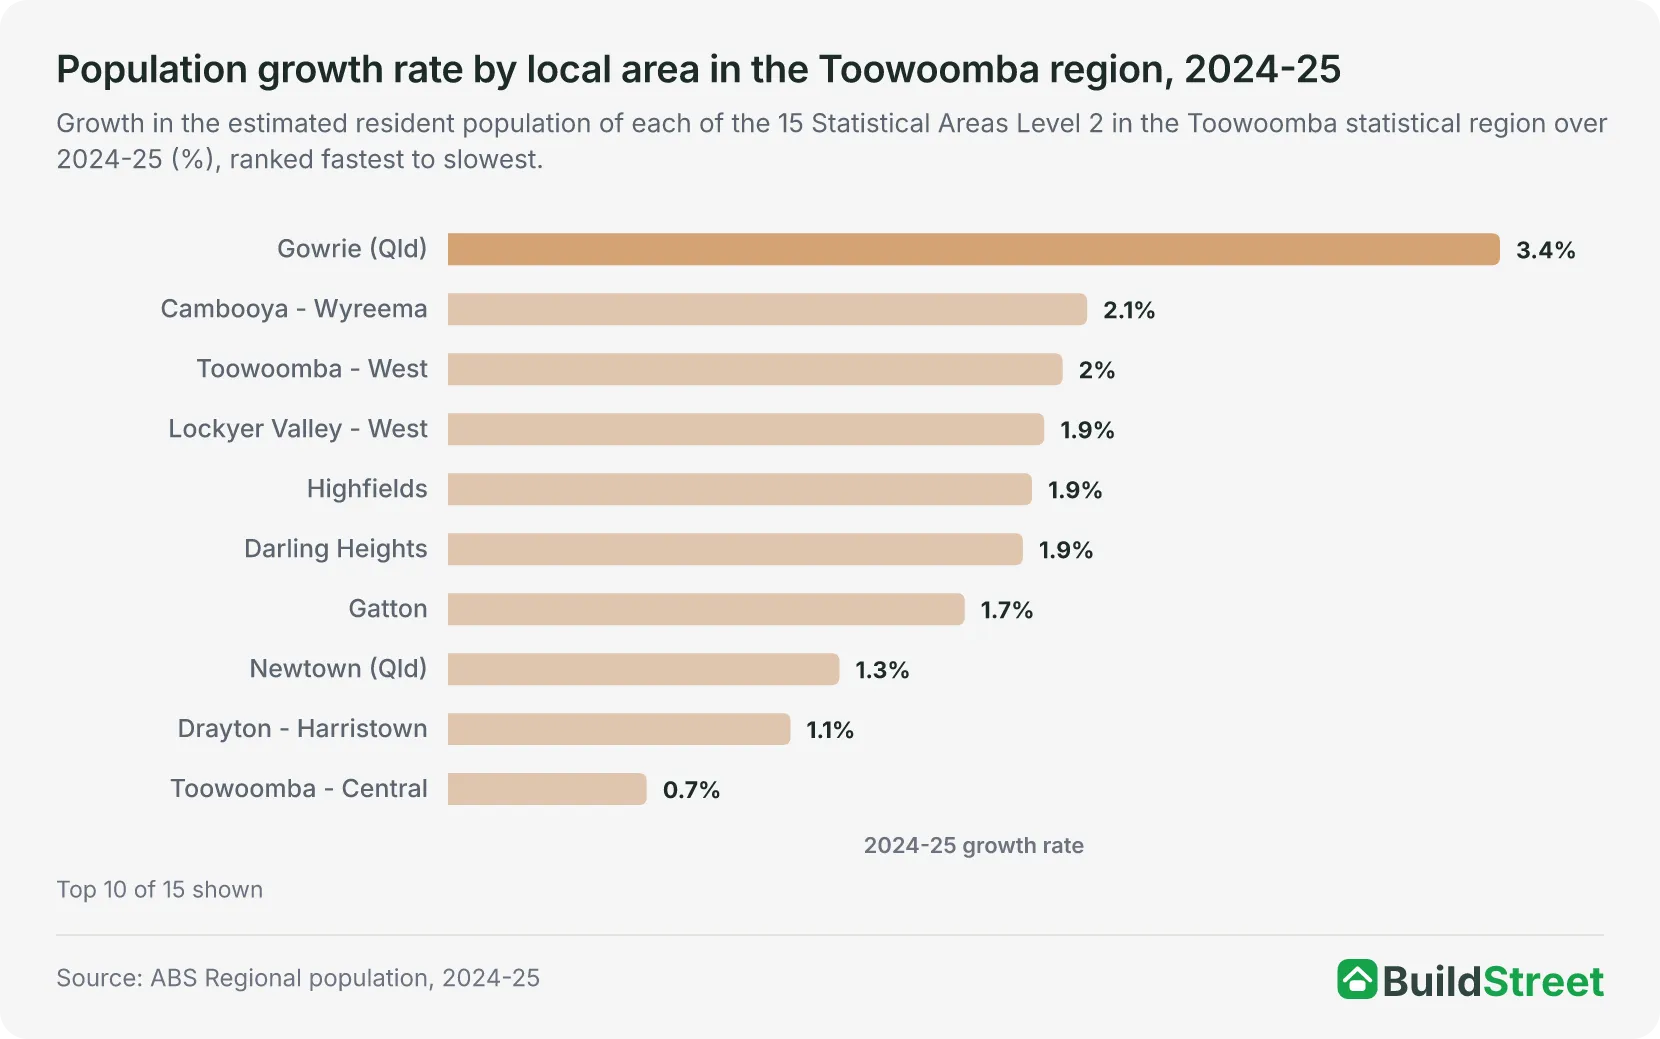
Gowrie (Qld) had the highest growth rate among the 15 smaller areas in the Toowoomba region in 2024-25, at 3.4 per cent, adding 271 people to reach 8,154. Toowoomba - West recorded the largest increase, at 352 people (2.0 per cent), followed by Highfields at 312 (1.9 per cent) and Darling Heights at 303 (1.9 per cent)6. All 15 areas grew over the year. The statistical region covers the 13 smaller areas (SA2s) of the urban area plus Gatton and Lockyer Valley - West. North Toowoomba - Harlaxton recorded the smallest increase at five people2.
The two areas with the largest increases in 2024-25 also recorded the largest increases since 2001. Toowoomba - West grew from 7,648 people at 30 June 2001 to 17,905 at 30 June 2025, an increase of 10,257. Highfields grew from 6,433 to 16,630 over the same period, an increase of 10,197. Toowoomba - Central, which was the largest of the 15 areas at 30 June 2001 with 14,288 people, grew by 146 over the same 24 years, to 14,4342.
The migration pattern varied across the areas. Darling Heights recorded the largest net overseas migration gain of the 15 areas in 2024-25, at 287 people, alongside a net internal migration loss of 73. Highfields recorded the largest net internal migration gain, at 254, with a net overseas migration gain of 256.
| Local areas with the largest population increases in the Toowoomba region, 2024-25 | ||||
|---|---|---|---|---|
| Area (SA2) | 30 June 2024 | 30 June 2025 | Change | Growth rate % |
| Toowoomba - West | 17,553 | 17,905 | +352 | 2.0 |
| Highfields | 16,318 | 16,630 | +312 | 1.9 |
| Darling Heights | 16,079 | 16,382 | +303 | 1.9 |
| Gowrie (Qld) | 7,883 | 8,154 | +271 | 3.4 |
| Lockyer Valley - West | 12,780 | 13,029 | +249 | 1.9 |
| Cambooya - Wyreema | 8,723 | 8,905 | +182 | 2.1 |
Source · ABS Population estimates and components by SA2, 2024 to 2025, Table 3
Section 05 · The state picture
How does Toowoomba compare with other cities in Queensland?
Toowoomba was the sixth-largest of the 19 urban areas in Queensland at 30 June 2025. The five larger urban areas ranged from Brisbane, with 2,745,086 people, to Cairns, with 164,149. Mackay, the next largest after Toowoomba, had 89,761 people, equal to 58 per cent of Toowoomba's total1.
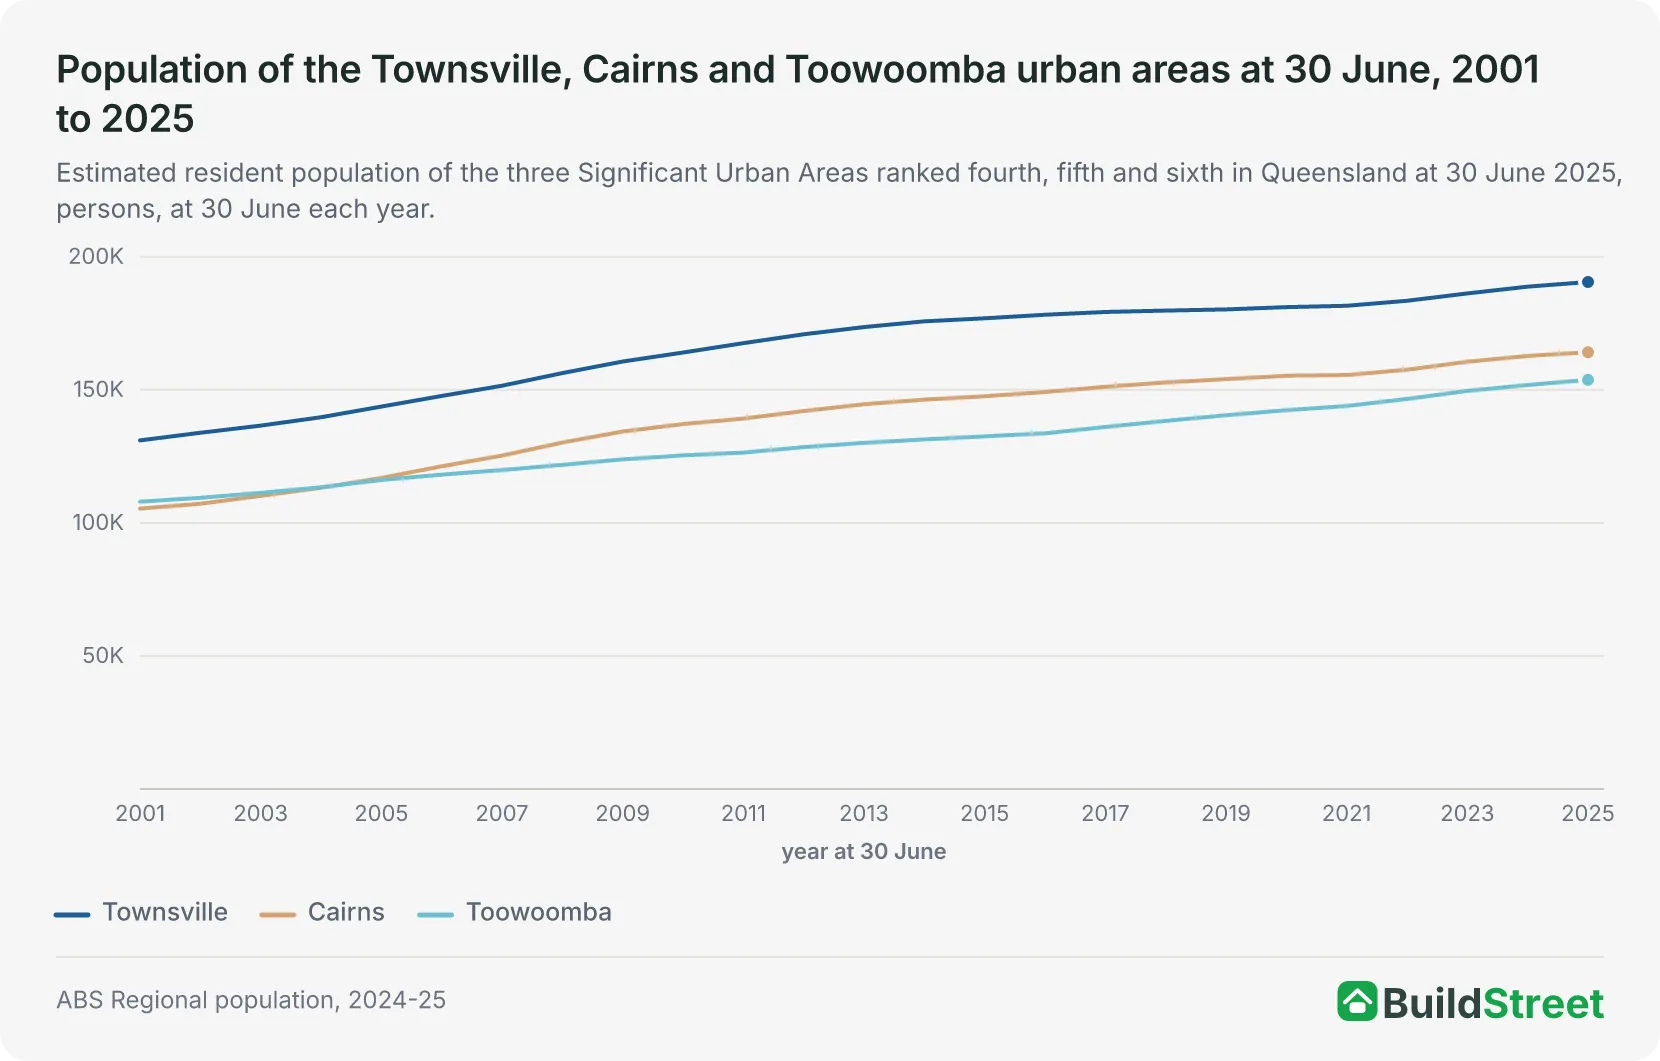
Toowoomba was larger than Cairns at each 30 June from 2001 to 2004, while Cairns was larger from 2005 onwards. At 30 June 2001, Toowoomba had 2,602 more people than Cairns. By 30 June 2025, Cairns had 10,368 more people than Toowoomba. Townsville had a larger population than Toowoomba in every year from 2001 to 20251.
In 2024-25, Toowoomba added 1,943 people, more than Townsville's 1,752 and Cairns' 1,404, the two larger regional cities. Its growth rate of 1.28 per cent ranked eighth of the 19 Queensland urban areas. Gympie recorded the highest rate, at 2.56 per cent, while Brisbane grew by 2.08 per cent. Townsville, at 0.93 per cent, and Cairns, at 0.86 per cent, grew more slowly than Toowoomba1. Across Queensland outside Greater Brisbane, the population increased by about 39,700 people, or 1.4 per cent, in 2024-254.
Brisbane's population data is covered in the Brisbane population article.
| Queensland's ten largest urban areas, as at 30 June 2025 | |||
|---|---|---|---|
| Urban area (SUA) | Population | Change over 2024-25 | Growth rate % |
| Brisbane | 2,745,086 | +56,017 | 2.08 |
| Gold Coast - Tweed Heads | 761,634 | +12,279 | 1.64 |
| Sunshine Coast | 424,741 | +8,018 | 1.92 |
| Townsville | 190,551 | +1,752 | 0.93 |
| Cairns | 164,149 | +1,404 | 0.86 |
| Toowoomba | 153,781 | +1,943 | 1.28 |
| Mackay | 89,761 | +746 | 0.84 |
| Rockhampton | 83,508 | +775 | 0.94 |
| Bundaberg | 79,283 | +858 | 1.09 |
| Hervey Bay | 63,312 | +1,327 | 2.14 |
Source · ABS Population estimates by LGA, Significant Urban Area, Remoteness Area and electoral division, 2001 to 2025, Table 2
Section 06 · The national rank
Where does Toowoomba rank among Australia's largest cities?
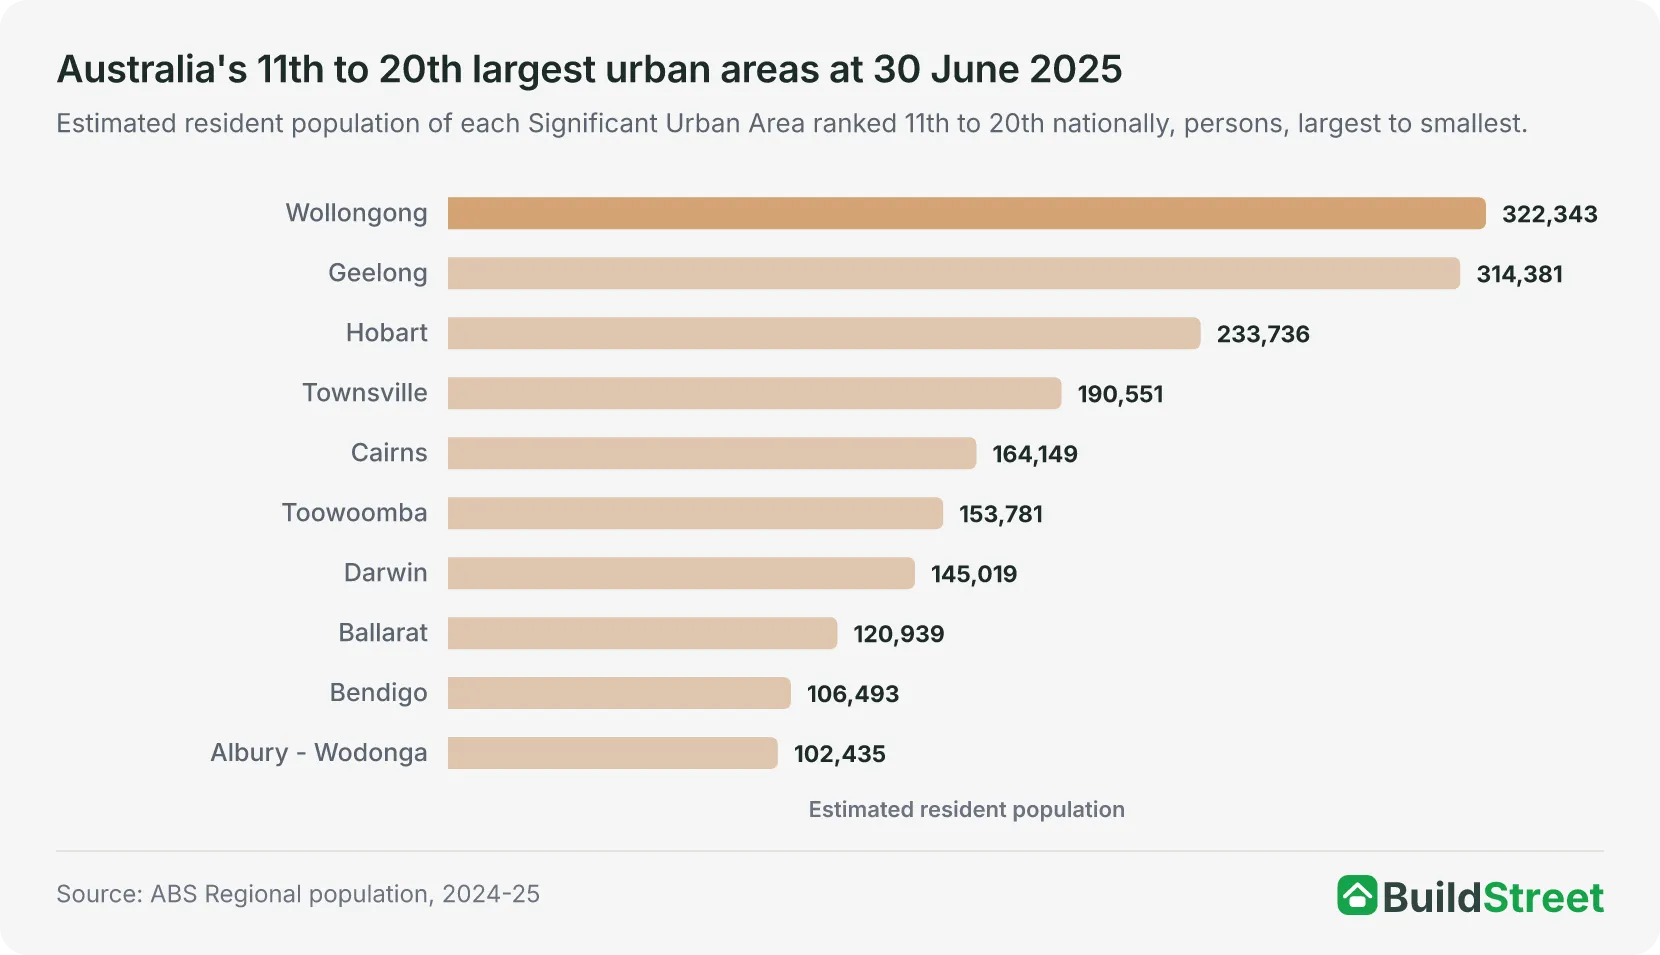
Toowoomba was Australia's 16th-largest urban area at 30 June 2025. Among the 94 urban areas that do not contain a capital city, it ranked ninth. It ranked between Cairns, at 164,149 people, and Darwin, at 145,0191.
The urban area had a larger population than Darwin at every 30 June from 2001 to 2025, with a difference of 8,762 at 30 June 20251. Urban-area boundaries give different population figures from the Greater Capital City areas used for capital-city reporting. Greater Darwin, for example, had 159,284 people at 30 June 20252, compared with 145,019 for Darwin's urban area1.
Toowoomba ranked 15th from 30 June 2001 to 30 June 2004 and 16th in every year from 30 June 2005 to 30 June 2025, after Cairns' urban area became the larger of the two1.
Growth in 2024-25 varied across the 20 largest urban areas, from 0.15 per cent in Hobart to 2.40 per cent in Perth. Toowoomba's 1.28 per cent ranked 11th of the 20, just below Newcastle - Maitland's 1.30 per cent and above Adelaide's 1.27 per cent. Among the 94 urban areas without a capital city, Toowoomba's increase of 1,943 people was the eighth-largest1.
| Australia's 20 largest urban areas, as at 30 June 2025 | ||||
|---|---|---|---|---|
| Rank | Urban area (SUA) | Population | Change over 2024-25 | Growth rate % |
| 1 | Melbourne | 5,328,274 | +102,910 | 1.97 |
| 2 | Sydney | 5,219,674 | +70,670 | 1.37 |
| 3 | Brisbane | 2,745,086 | +56,017 | 2.08 |
| 4 | Perth | 2,430,757 | +56,991 | 2.40 |
| 5 | Adelaide | 1,470,938 | +18,417 | 1.27 |
| 6 | Gold Coast - Tweed Heads | 761,634 | +12,279 | 1.64 |
| 7 | Newcastle - Maitland | 541,634 | +6,953 | 1.30 |
| 8 | Canberra - Queanbeyan | 521,049 | +5,894 | 1.14 |
| 9 | Sunshine Coast | 424,741 | +8,018 | 1.92 |
| 10 | Central Coast | 354,189 | +2,401 | 0.68 |
| 11 | Wollongong | 322,343 | +3,642 | 1.14 |
| 12 | Geelong | 314,381 | +6,360 | 2.06 |
| 13 | Hobart | 233,736 | +346 | 0.15 |
| 14 | Townsville | 190,551 | +1,752 | 0.93 |
| 15 | Cairns | 164,149 | +1,404 | 0.86 |
| 16 | Toowoomba | 153,781 | +1,943 | 1.28 |
| 17 | Darwin | 145,019 | +2,520 | 1.77 |
| 18 | Ballarat | 120,939 | +2,098 | 1.77 |
| 19 | Bendigo | 106,493 | +883 | 0.84 |
| 20 | Albury - Wodonga | 102,435 | +1,183 | 1.17 |
Source · ABS Population estimates by LGA, Significant Urban Area, Remoteness Area and electoral division, 2001 to 2025, Table 2
Section 07 · The long run
How has Toowoomba's population changed since 2001?
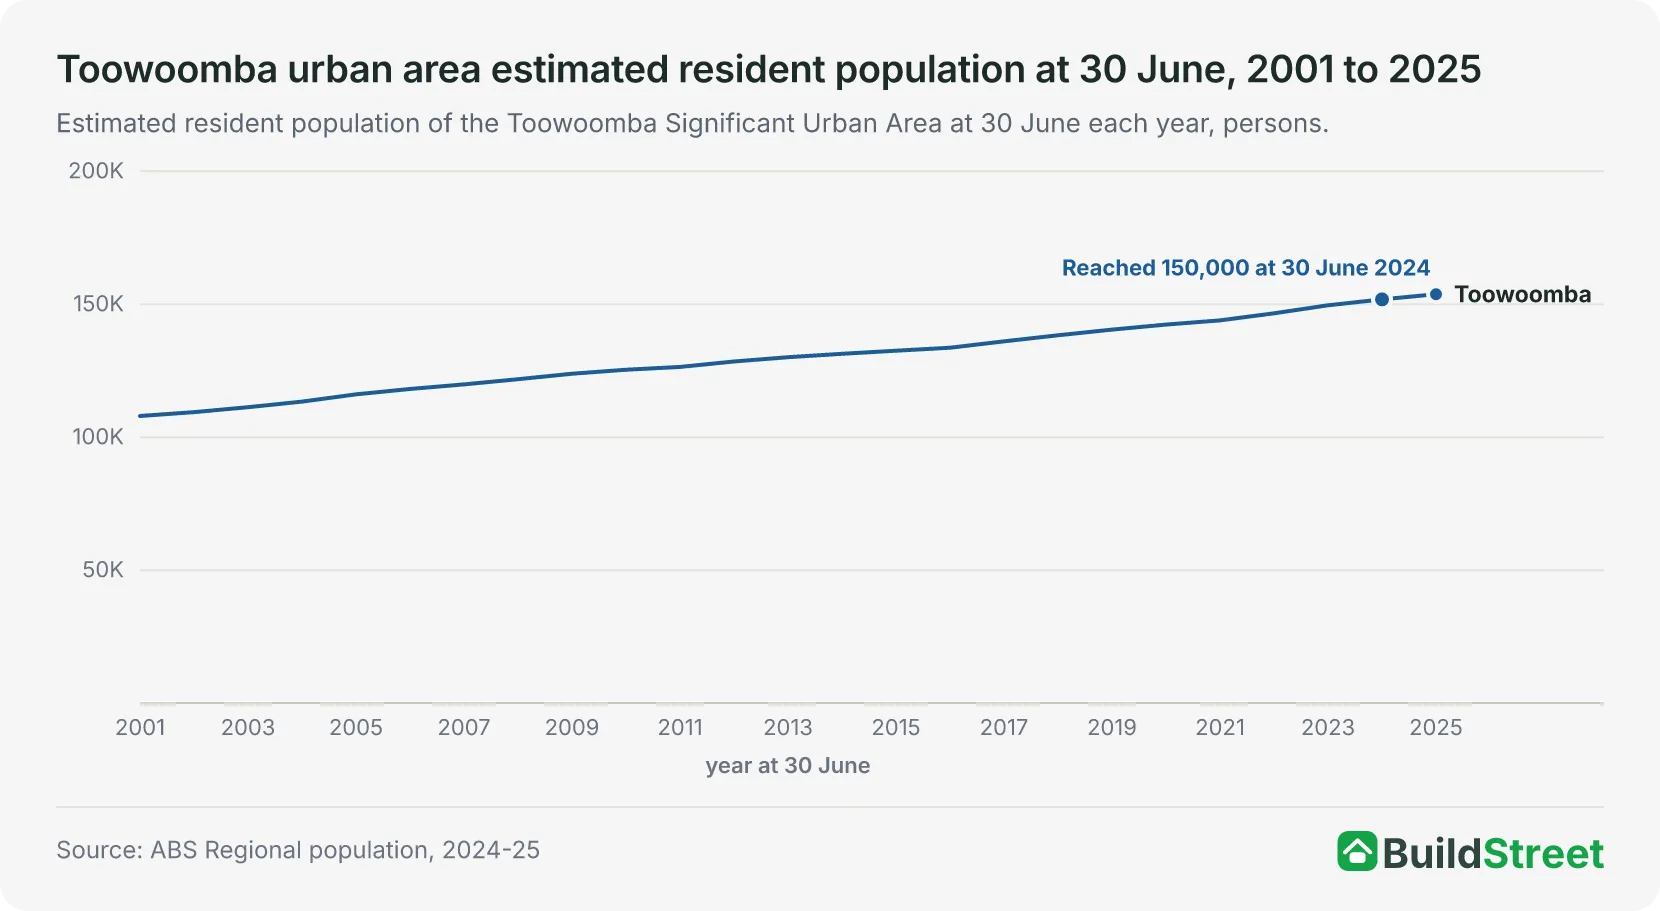
The urban area added 45,806 people between 30 June 2001 and 30 June 2025, growing from 107,975 to 153,781, an increase of 42.4 per cent1.
Toowoomba first reached 150,000 people at 30 June 2024, when its population was 151,8381. The urban area first reached 110,000 at 30 June 2003, 120,000 at 30 June 2008, 130,000 at 30 June 2013 and 140,000 at 30 June 2019. Each milestone is the first 30 June at which the annual estimate was at or above the threshold. The intervals between successive milestones were five, five, six and five years.
Over the same period, the Toowoomba Regional Council area grew from 134,955 at 30 June 2001 to 186,276 at 30 June 2025, an increase of 51,321 people or 38.0 per cent. The council area's growth rate was lower than the urban area's 42.4 per cent. The council area first reached 150,000 at 30 June 2008 and 175,000 at 30 June 20211. Queensland's population grew by 58.8 per cent over the same 24 years, while Toowoomba's share of the state's population declined from 3.0 per cent at 30 June 2001 to 2.7 per cent at 30 June 20252.
| Toowoomba urban area population milestones, 2001 to 2025 | ||
|---|---|---|
| Milestone | First 30 June at or above | Population that year |
| 110,000 | 30 June 2003 | 111,283 |
| 120,000 | 30 June 2008 | 121,820 |
| 130,000 | 30 June 2013 | 130,089 |
| 140,000 | 30 June 2019 | 140,465 |
| 150,000 | 30 June 2024 | 151,838 |
Source · ABS Population estimates by LGA, Significant Urban Area, Remoteness Area and electoral division, 2001 to 2025, Table 2
Section 08
Toowoomba population: quick answers
How many people live in Toowoomba?
The Toowoomba Significant Urban Area had an estimated resident population of 153,781 at 30 June 2025. That was the sixth-largest of Queensland's 19 urban areas and the 16th-largest of Australia's 102 urban areas. The Toowoomba Regional Council area, a larger boundary that includes rural districts, had 186,276 people on the same date. The 30 June 2025 estimates are preliminary. The next release, covering 30 June 2026, is due on 25 March 2027.
What is the difference between the Toowoomba urban area and Toowoomba Regional Council?
The Toowoomba urban area is a Significant Urban Area, an ABS statistical boundary covering the connected urban centre, and it had 153,781 people at 30 June 2025. Toowoomba Regional Council is a local government area covering 12,957.2 square kilometres, including the rural districts around the city. It had 186,276 people on the same date, at a density of 14.4 people per square kilometre. The urban area accounted for 82.6 per cent of the council area's population. The two sets of ABS figures describe different boundaries and are not interchangeable.
How fast is Toowoomba's population growing?
The Toowoomba urban area grew by 1,943 people, or 1.28 per cent, in 2024-25. Its population increased in every year from 2001-02 to 2024-25. Annual growth ranged from 0.84 per cent in 2010-11 to 2.41 per cent in 2004-05. The largest annual increase was 3,022 people (2.06 per cent) in 2022-23, and growth exceeded 1 per cent in each of the nine years from 2016-17 to 2024-25.
Is Toowoomba bigger than Cairns or Townsville?
Toowoomba's urban area, at 153,781 people at 30 June 2025, was smaller than both Cairns, at 164,149, and Townsville, at 190,551. Toowoomba was larger than Cairns at each 30 June from 2001 to 2004, while Cairns was larger from 2005 to 2025. In 2024-25, Toowoomba added 1,943 people, more than Townsville's 1,752 and Cairns' 1,404.
Where does Toowoomba rank among Australian cities?
Toowoomba was Australia's 16th-largest urban area at 30 June 2025, and the ninth-largest of the 94 urban areas that do not contain a capital city. It ranked between Cairns, at 164,149 people, and Darwin, at 145,019. Toowoomba's urban area had a larger population than Darwin at every 30 June from 2001 to 2025.
When did Toowoomba's population pass 150,000?
The Toowoomba urban area first reached 150,000 people at 30 June 2024, when its population was 151,838. The urban area first reached 130,000 at 30 June 2013 and 140,000 at 30 June 2019. The Toowoomba Regional Council area first reached 175,000 residents at 30 June 2021, when its population was 175,255.
References
- ABS Regional population, 2024-25: population estimates by LGA and Significant Urban Area, 2001 to 2025 (datacube 32180DS0004) · Australian Bureau of Statistics ↑ b c d e f g h i j k l m n
- ABS Regional population, 2024-25: population estimates by SA2 and above, 2001 to 2025 (datacube 32180DS0003) · Australian Bureau of Statistics ↑ b c d e f g
- ABS Regional population methodology, 2024-25 · Australian Bureau of Statistics ↑ b
- ABS Regional population, 2024-25 · Australian Bureau of Statistics ↑ b
- ABS Regional population, 2024-25: population estimates and components by LGA, 2024 to 2025 (datacube 32180DS0002) · Australian Bureau of Statistics ↑
- ABS Regional population, 2024-25: population estimates and components by SA2, 2024 to 2025 (datacube 32180DS0001) · Australian Bureau of Statistics ↑ b c
- ABS Regional population, 2024-25: population components by SA2 and above, 2021-22 to 2024-25 (datacube 32180DS0005) · Australian Bureau of Statistics ↑
- ABS Regional population, 2024-25: population components by LGA, 2021-22 to 2024-25 (datacube 32180DS0006) · Australian Bureau of Statistics ↑
