

Published 31 Aug 2026
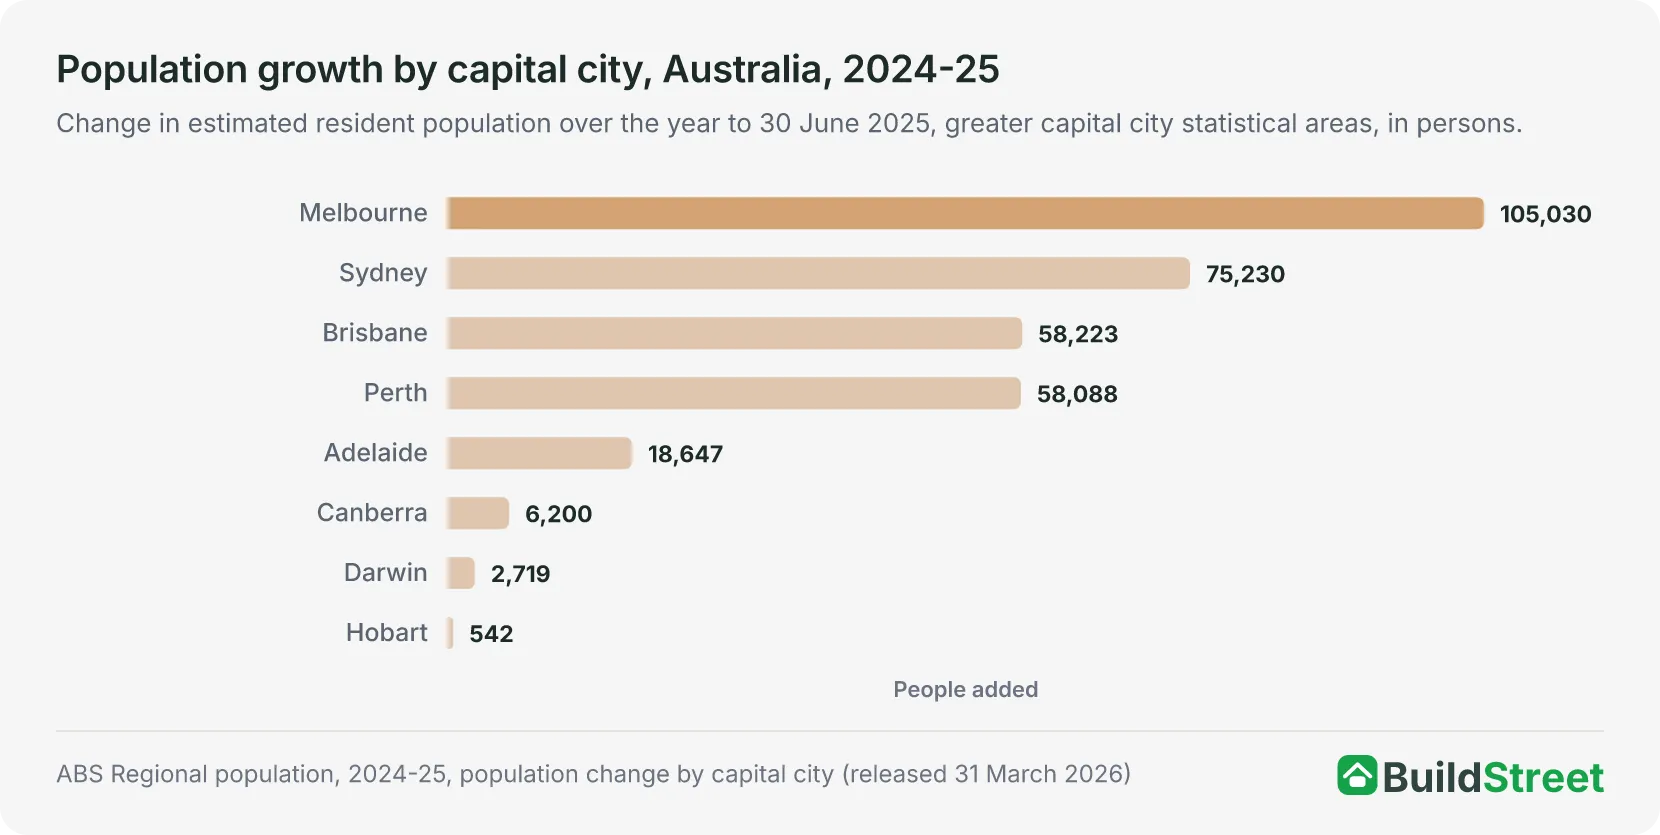 How other cities compareMelbourne added the most people of any capital in 2024-25 and Perth grew at the fastest rate, and Adelaide was the fifth largest. The cities article ranks growth across Australia's capitals and regional centres.
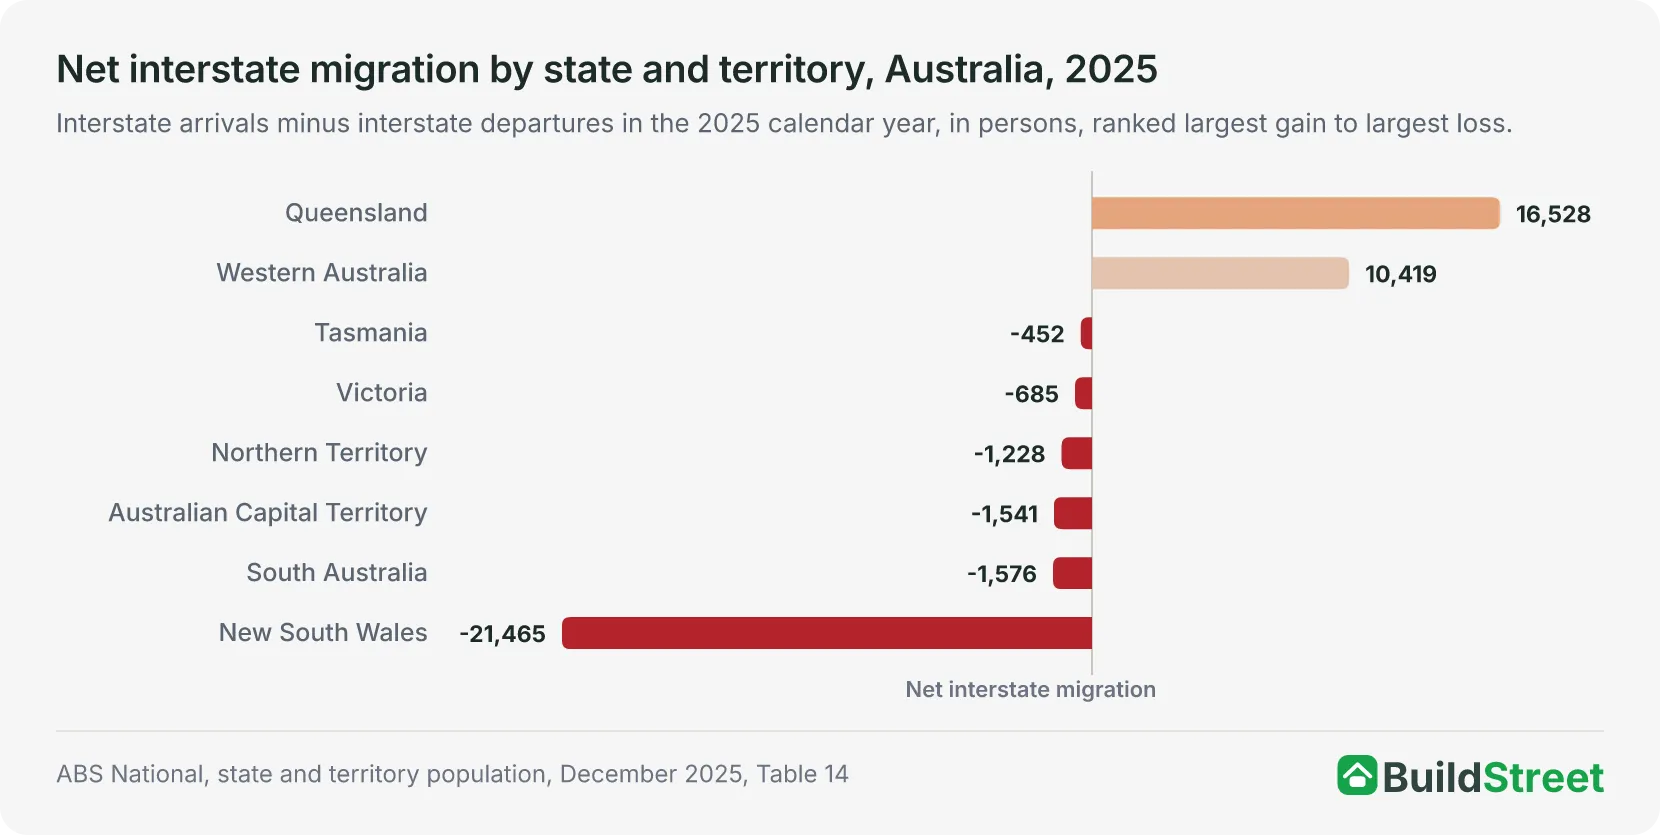 Moves between the statesNet internal migration subtracted 2,425 people from Greater Adelaide in 2024-25. The interstate migration article covers the annual state-to-state flows for all eight states and territories.
Section 01 · The headline number
How many people live in Adelaide?
Greater Adelaide had an estimated resident population of 1,491,015 at 30 June 2025, the fifth-largest population of the eight capital cities1. Perth, the fourth largest, had 2,452,765 people, and Canberra, the sixth largest, had 484,630.
Greater Adelaide accounted for 5.4 per cent of Australia's population of 27,613,654 at 30 June 20252.
The ABS updates the city estimate once a year, at 30 June, and the 2025 figures are preliminary and subject to revision. The next release, covering 30 June 2026, is due on 25 March 20271.
Section 02 · The pace
How fast is Adelaide's population growing?
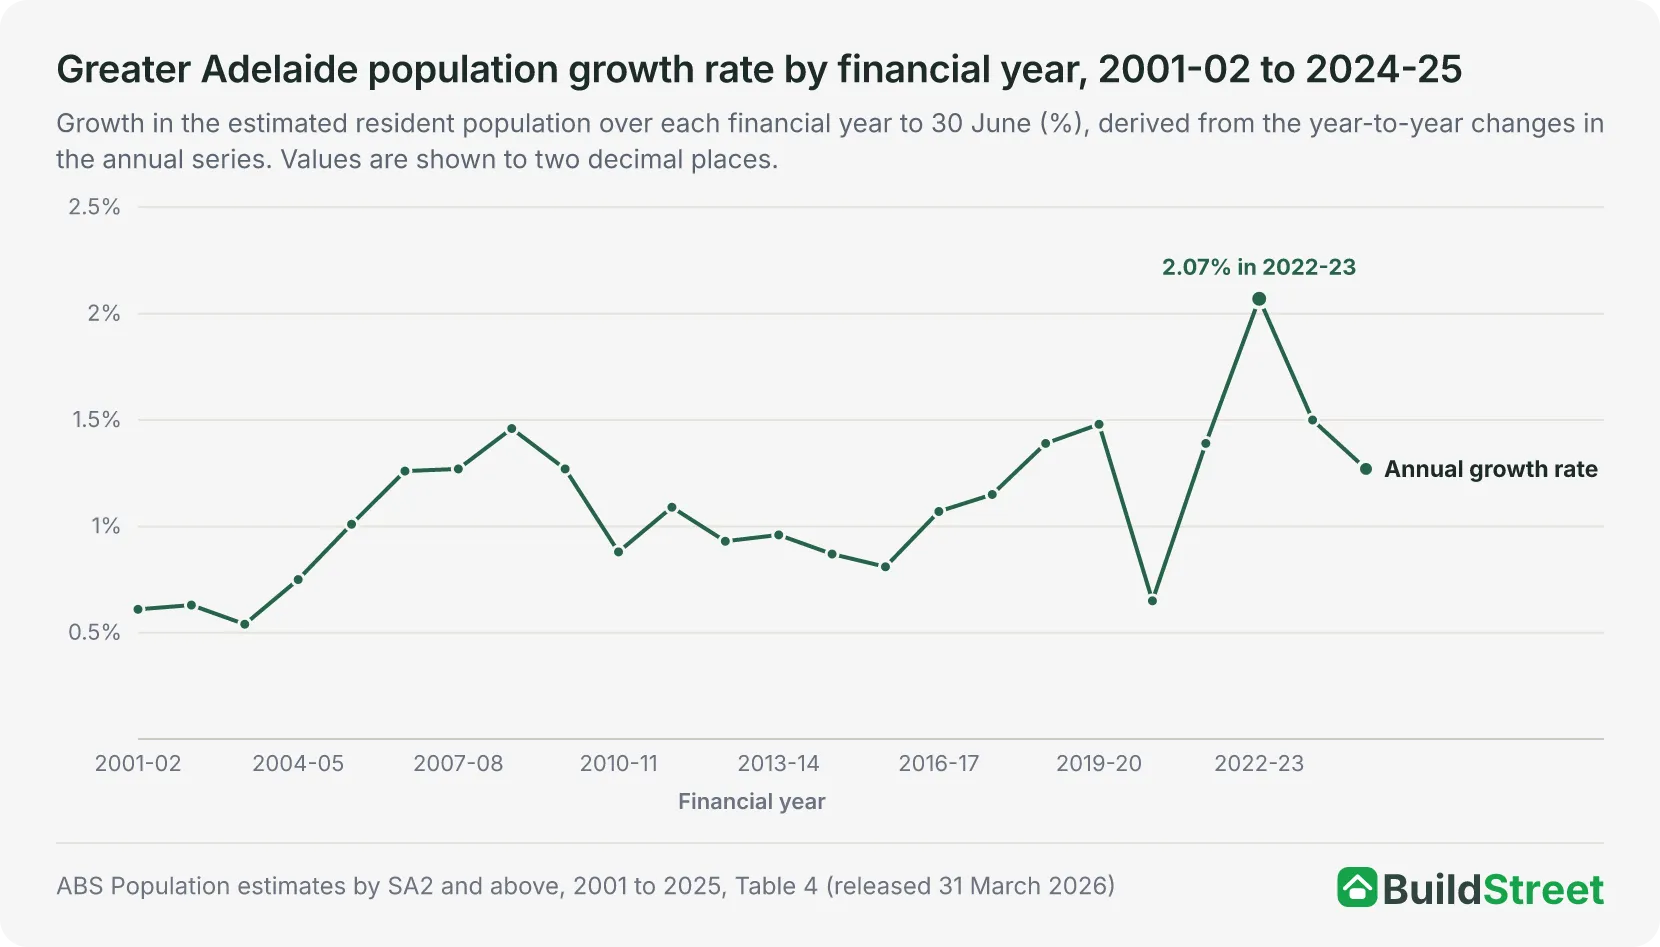
Greater Adelaide added 18,647 people, or 1.27 per cent, over the 2024-25 financial year. The ABS capital city data rounds the change to 18,600 people (1.3 per cent). The increase was the smallest since 2020-21. Each of the three years in between added more people: 19,426 in 2021-22, 29,364 in 2022-23 and 21,706 in 2023-242.
Across the 24 financial years from 2001-02 to 2024-25, growth ranged from 0.54 per cent to 2.07 per cent, and the population increased in every year over the period. The fastest year was 2022-23, when the city added 29,364 people, equivalent to 2.07 per cent, the largest increase and the highest rate over the period. The smallest increase came in 2003-04, at 6,291 people (0.54 per cent), and the slowest year since 2015-16 was 2020-21, when the city added 9,117 people (0.65 per cent)2.
Growth slowed in each of the two years after the 2022-23 peak, from 2.07 per cent to 1.50 per cent and then to 1.27 per cent.
Section 03 · The drivers
What drives Adelaide's population growth?
Net overseas migration was the largest component of Greater Adelaide's population growth in 2024-25, adding 17,824 people. Natural increase, the excess of births over deaths, added 3,248 people. Net internal migration (moves to and from elsewhere in Australia) subtracted 2,4253. Together, the three components added 18,647 people, matching the city's total population change.
Net internal migration shifted from a gain to losses over the four published years. Greater Adelaide gained 2,086 people from net internal migration in 2021-22, then recorded net losses of 1,201 in 2022-23, 3,508 in 2023-24 and 2,425 in 2024-253. Brisbane and Perth were the only capitals with net internal migration gains in 2024-25, while Sydney and Melbourne recorded the largest losses1.
Net overseas migration was larger than the net internal migration loss in each of the three years Adelaide recorded a loss. It peaked at 27,316 people in 2022-23, then fell to 21,777 in 2023-24 and 17,824 in 2024-25. All eight capitals recorded net overseas migration gains in 2024-25. Adelaide's was the fifth largest, behind Melbourne's 81,168, Sydney's 78,403, Perth's 37,289 and Brisbane's 33,9343.
| Components of Greater Adelaide population change, 2024-25 | ||
|---|---|---|
| Component | People | Derivation |
| Net overseas migration | +17,824 | 27,392 arrivals minus 9,568 departures |
| Natural increase | +3,248 | 14,645 births minus 11,397 deaths |
| Net internal migration | -2,425 | 24,444 arrivals minus 26,869 departures |
| Total growth | +18,647 | Derived sum; the release's summary rounds it to 18,600 |
Source · ABS Population components by SA2 and above, 2021-22 to 2024-25, Table 4
Section 04 · The growth areas
Where in Adelaide is the population growing fastest?
The city's fastest-growing areas in 2024-25 were in its outer north and the Adelaide Hills. The ABS identifies Munno Para West - Angle Vale (up by 2,400 people) and Virginia - Waterloo Corner (1,300), both in the outer north, and Mount Barker (1,200) in the Adelaide Hills as the South Australian areas with the largest growth in 2024-25. Munno Para West - Angle Vale grew from 21,901 to 24,343 people, Virginia - Waterloo Corner from 7,510 to 8,799 and Mount Barker from 25,742 to 26,939 people over the year4.
The highest growth rates in the state were all in Adelaide's outer north: Virginia - Waterloo Corner at 17.2 per cent, Munno Para West - Angle Vale at 11.2 per cent and Lewiston - Two Wells at 5.0 per cent.
Munno Para West - Angle Vale also recorded both the state's largest natural increase, at 389 people, and its largest net internal migration gain, at 1,982 people. The central Adelaide area had the largest net overseas migration gain, at 1,0544.
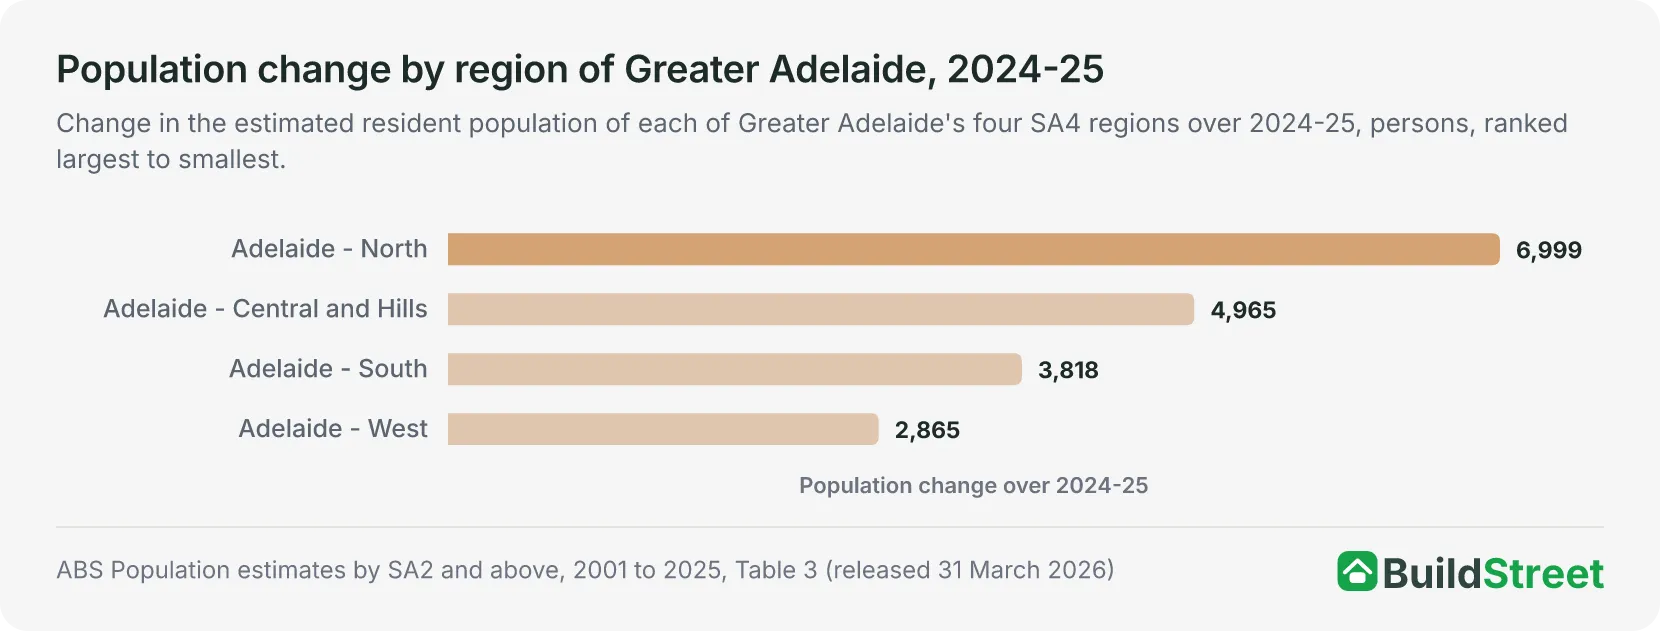
Every broad region of the city grew over 2024-25. Adelaide - North added 6,999 people and Adelaide - Central and Hills added 4,965, the two largest increases of Greater Adelaide's four broad regions. Central and Hills had the highest growth rate, at 1.49 per cent, and Adelaide - South recorded the smallest increase, at 3,818 people2. The city's centre of population was close to the River Torrens, just north of Botanic Park, at June 2025, and moved little over the year, with growth in the city's north and south broadly similar1.
| The fastest growing areas of Adelaide, 2024-25 | |||||
|---|---|---|---|---|---|
| Area (SA2) | Region (SA4) | 30 June 2024 | 30 June 2025 | Change | Growth rate % |
| Munno Para West - Angle Vale | North | 21,901 | 24,343 | +2,442 | 11.2 |
| Virginia - Waterloo Corner | North | 7,510 | 8,799 | +1,289 | 17.2 |
| Mount Barker | Central and Hills | 25,742 | 26,939 | +1,197 | 4.6 |
Source · ABS Population estimates and components by SA2, 2024 to 2025, Table 4
Section 05 · The state share
How much of South Australia's population lives in Adelaide?
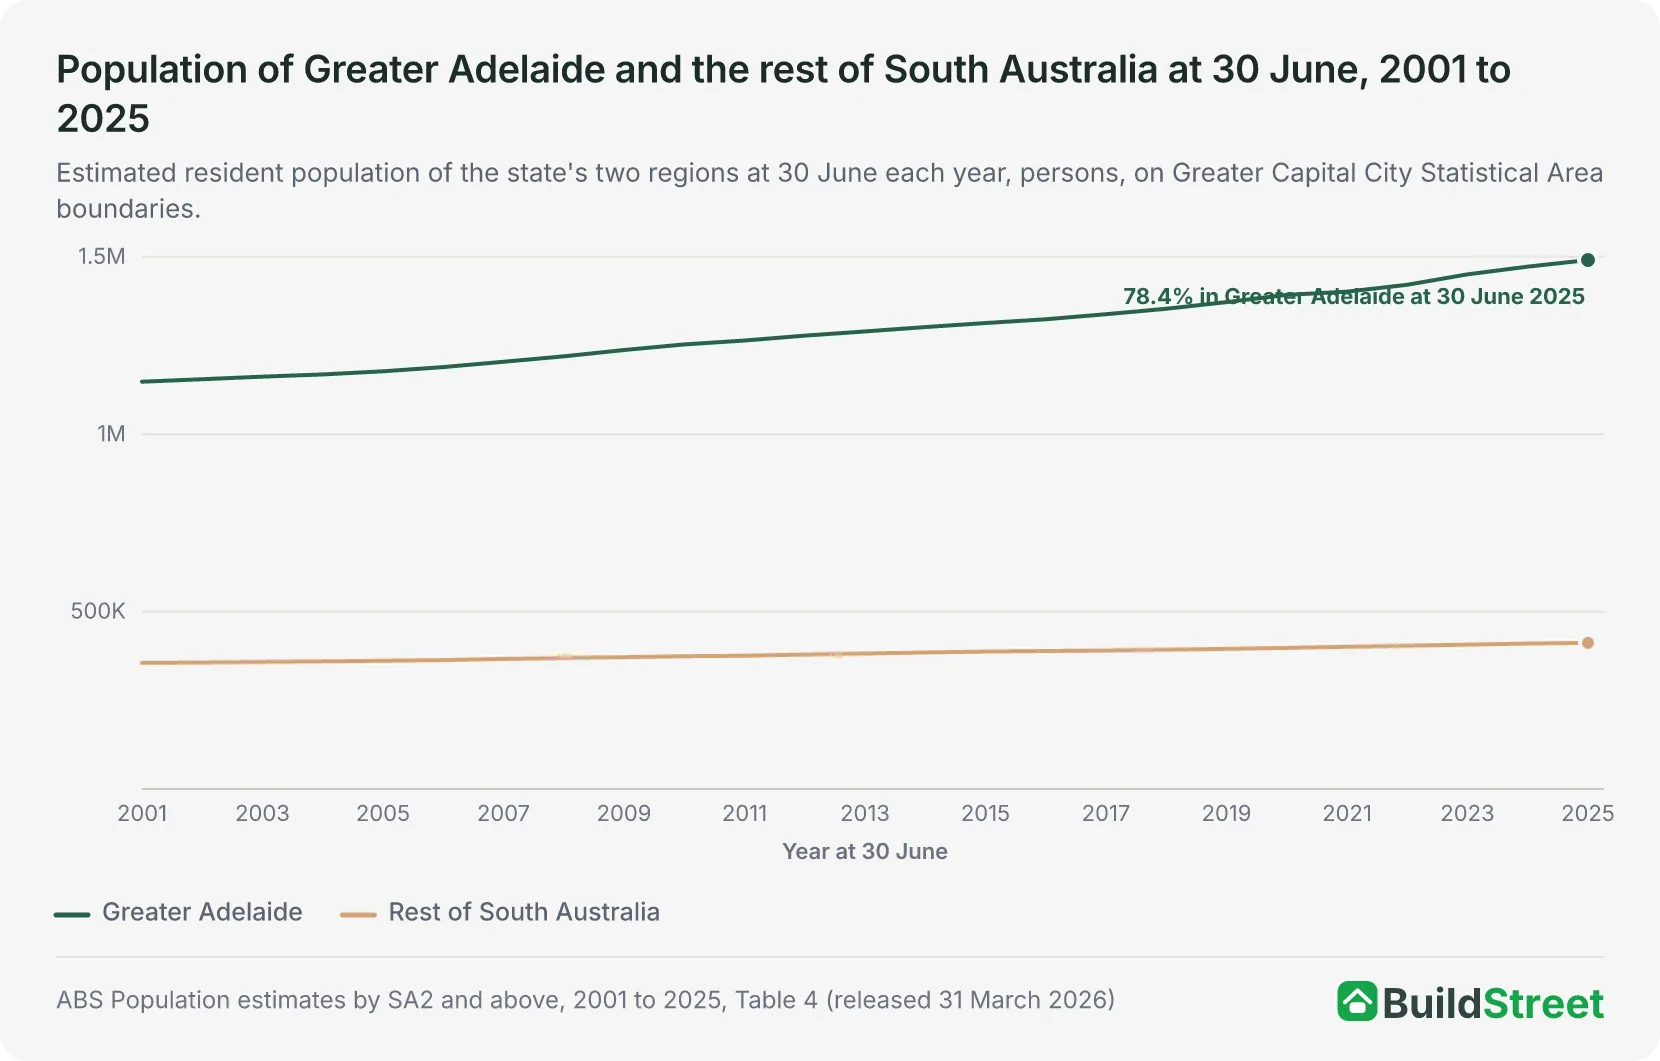
Greater Adelaide accounted for 78.4 per cent of South Australia's population at 30 June 2025. The capital had 1,491,015 people and the rest of South Australia 411,650, out of a combined population of 1,902,665. The share was 76.4 per cent at 30 June 2001, when the capital had 1,148,006 of the state's 1,503,461 people2.
The gap between the capital and the rest of the state widened from 792,551 people at 30 June 2001 to 1,079,365 at 30 June 2025. The rest of the state added 1,854 people (0.45 per cent) over 2024-25, which the ABS rounds to 1,900 or 0.5 per cent. That rate was about a third of the capital's 1.27 per cent2.
The share of the state's people living in the capital was the second highest of the six states at 30 June 2025. Perth held 80.6 per cent of Western Australia's population, Adelaide held 78.4 per cent and Melbourne held 76.8 per cent, while Sydney held 65.6 per cent, Brisbane 50.0 per cent and Hobart 44.3 per cent2.
Section 06 · The other capitals
How does Adelaide compare with Australia's other capital cities?
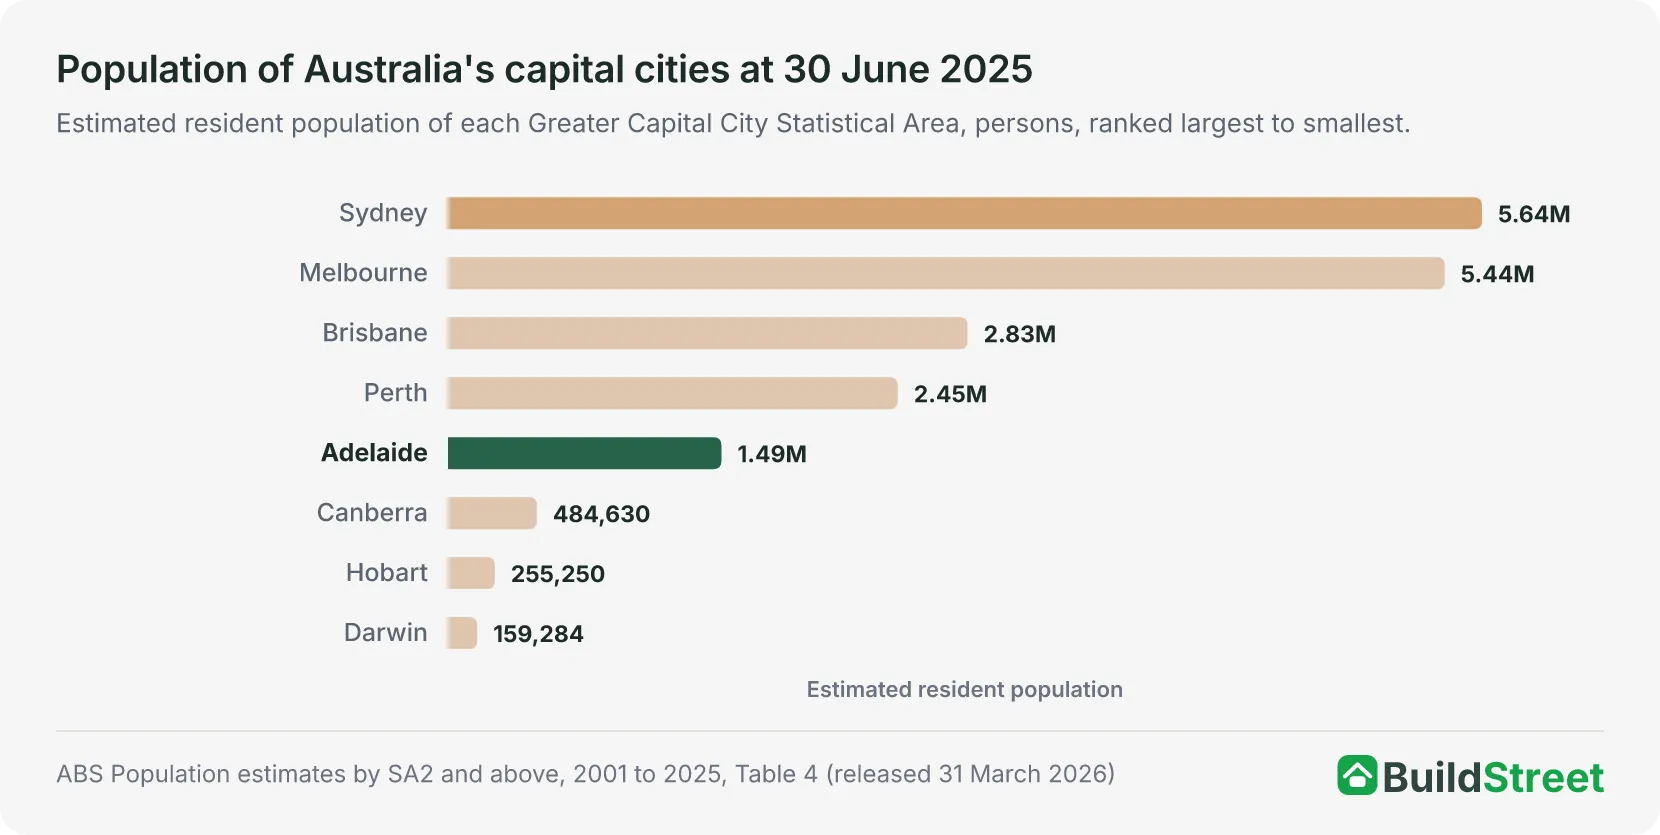
Adelaide was the fifth largest of the eight capital cities by population at 30 June 2025, with 1,491,015 people. The four larger capitals were Sydney at 5,638,830, Melbourne at 5,435,590, Brisbane at 2,833,524 and Perth at 2,452,765. The three smaller capitals were Canberra at 484,630, Hobart at 255,250 and Darwin at 159,2842.
The growth rankings differed from the size rankings in 2024-25. Melbourne recorded the largest increase of the eight capitals, at 105,030 people, followed by Sydney's 75,230, Brisbane's 58,223 and Perth's 58,088. Adelaide's increase of 18,647 was the fifth largest. Perth had the highest growth rate, at 2.4 per cent, followed by Brisbane at 2.1 per cent and Melbourne at 2.0 per cent. Adelaide's rate of 1.27 per cent ranked seventh of the eight, just below Canberra's 1.30 per cent and ahead of Hobart's 0.21 per cent1.
The eight capitals together had 18,750,888 people at 30 June 2025, after growing by 324,679 (1.8 per cent) over the year. Greater Adelaide accounted for 8.0 per cent of the combined capital population1.
Perth's population data is covered in the Perth population article.
| Population of Australia's capital cities, as at 30 June 2025 | |||
|---|---|---|---|
| Capital city | Population | Change over 2024-25 | Growth rate % |
| Sydney | 5,638,830 | +75,230 | 1.35 |
| Melbourne | 5,435,590 | +105,030 | 1.97 |
| Brisbane | 2,833,524 | +58,223 | 2.10 |
| Perth | 2,452,765 | +58,088 | 2.43 |
| Adelaide | 1,491,015 | +18,647 | 1.27 |
| Canberra | 484,630 | +6,200 | 1.30 |
| Hobart | 255,250 | +542 | 0.21 |
| Darwin | 159,284 | +2,719 | 1.74 |
| All capital cities | 18,750,888 | +324,679 | 1.76 |
Source · ABS Population estimates by SA2 and above, 2001 to 2025, Table 4
Section 07 · The long run
How has Adelaide's population changed since 2001?
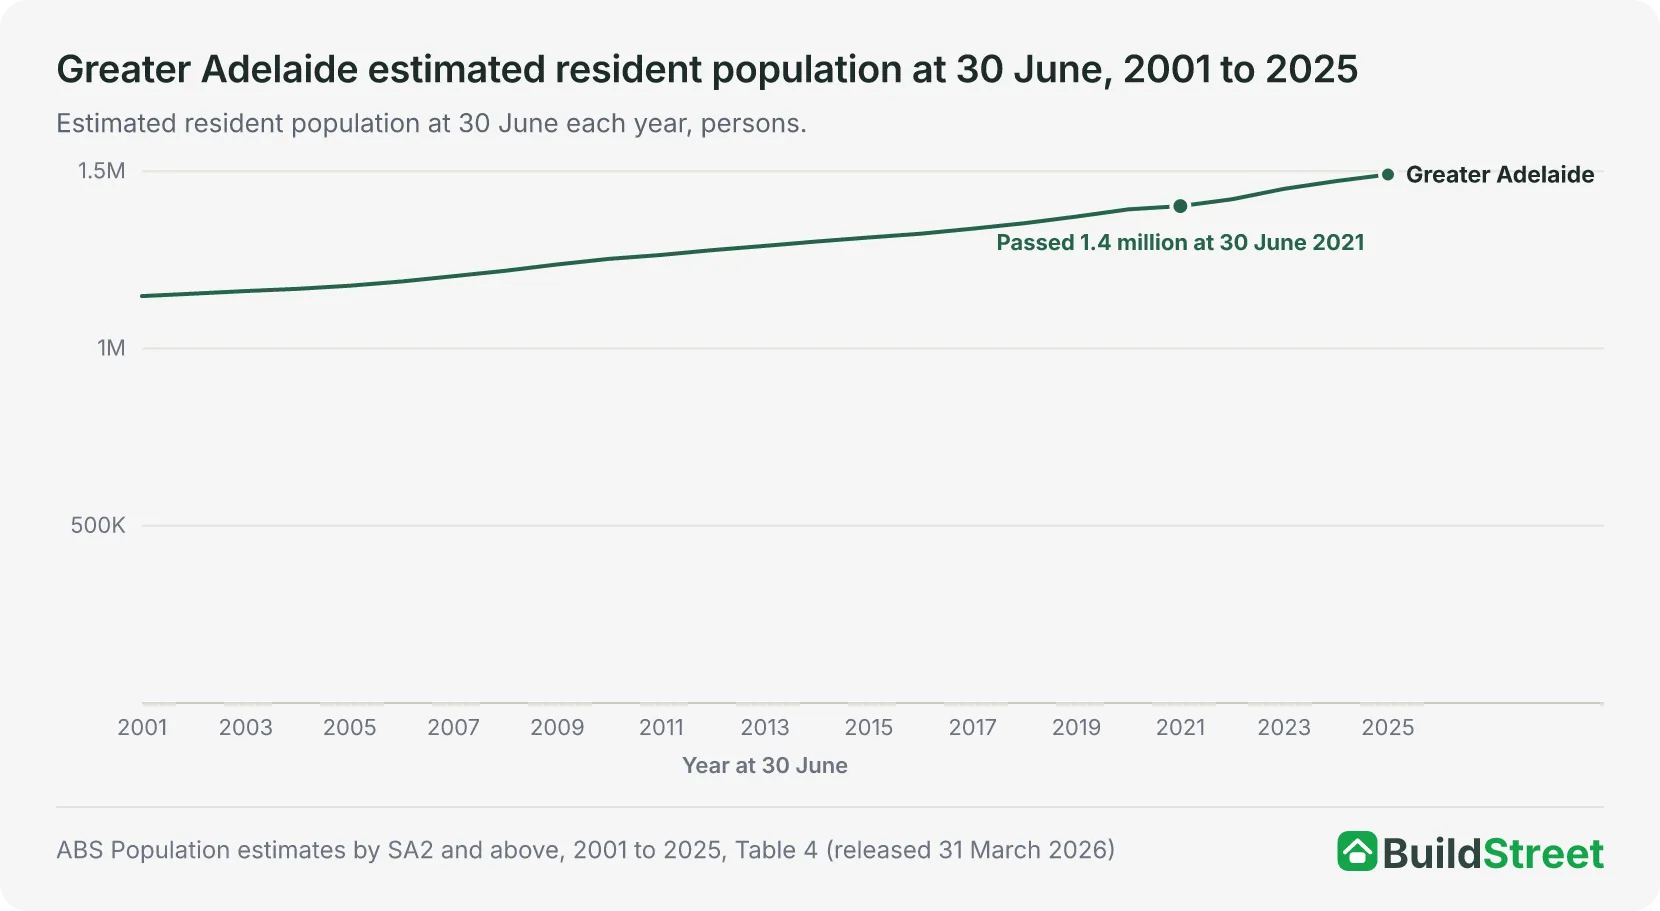
The city added 343,009 people between 30 June 2001 and 30 June 2025, growing from 1,148,006 to 1,491,015. The 2025 population was 30 per cent larger than in 20012.
Greater Adelaide first exceeded 1.2 million people at 30 June 2007, 1.3 million at 30 June 2014 and 1.4 million at 30 June 2021. At 30 June 2001, the city had 1,148,006 people2. The 1.3 million and 1.4 million milestones were each reached seven years after the previous threshold.
The smallest and largest annual increases since 2015-16 occurred two years apart. The annual increase slowed from 20,341 in 2019-20 to 9,117 in 2020-21, then rose to 19,426 in 2021-22 and peaked at 29,364 in 2022-23, before falling to 21,706 in 2023-24 and 18,647 in 2024-252.
| Greater Adelaide population milestones in the annual series | ||
|---|---|---|
| Milestone | First 30 June at or above | Population that year |
| 1.2 million | 30 June 2007 | 1,204,210 |
| 1.3 million | 30 June 2014 | 1,302,079 |
| 1.4 million | 30 June 2021 | 1,401,872 |
Source · ABS Population estimates by SA2 and above, 2001 to 2025, Table 4
Section 08
Adelaide population: quick answers
How many people live in Adelaide?
Greater Adelaide had an estimated resident population of 1,491,015 at 30 June 2025, the most recent year in the ABS Regional population data, published on 31 March 2026. That was the fifth largest population of Australia's eight capital cities and accounted for 5.4 per cent of the national total of 27,613,654 at the same date. The 30 June 2025 estimates are preliminary. The next release, covering 30 June 2026, is due on 25 March 2027.
Is Adelaide the fifth biggest city in Australia?
Adelaide was the fifth largest of the eight capital cities at 30 June 2025 using ABS Greater Capital City Statistical Area boundaries, with 1,491,015 residents. Perth, the fourth largest, had 2,452,765 people and Canberra, the sixth largest, had 484,630.
How fast is Adelaide's population growing?
Greater Adelaide added 18,647 people, or 1.27 per cent, over the 2024-25 financial year. The ABS reports the rounded change as 18,600 (1.3 per cent). The rate was the seventh fastest of the eight capital cities. Growth peaked at 29,364 people (2.07 per cent) in 2022-23, and the population increased in every year of the series from 2001-02.
Section 09
Australia population statistics
References
- ABS Regional population, 2024-25 · Australian Bureau of Statistics ↑ b c d e f
- ABS Regional population, 2024-25: population estimates by SA2 and above, 2001 to 2025 (datacube 32180DS0003) · Australian Bureau of Statistics ↑ b c d e f g h i j k
- ABS Regional population, 2024-25: population components by SA2 and above, 2021-22 to 2024-25 (datacube 32180DS0005) · Australian Bureau of Statistics ↑ b c
- ABS Regional population, 2024-25: population estimates and components by SA2, 2024 to 2025 (datacube 32180DS0001) · Australian Bureau of Statistics ↑ b
- ABS Regional population methodology, 2024-25 · Australian Bureau of Statistics
