

Published 2 Sept 2026 · Updated 16 Sept 2026
 How many people live in AustraliaThis page covers the age of the population. The main population article covers the total, how fast it is growing and the births, deaths and migration behind the growth, from the same ABS release.
 How much older Australia is projected to becomeThe ABS projects the median age and the share of people aged 65 and over to 2071 under high, medium and low series. The projections article covers those series and what they assume.
Section 01 · The headline number
What is Australia’s median age?
Australia’s median age was 38.4 years at 30 June 2025. Half of the estimated resident population of 27,611,026 people were older than that age and half were younger. The median age for females was 39.3 years, 1.8 years higher than the 37.5-year median for males1.
The median is a midpoint, not the mean. The mean age is calculated by adding the ages of all residents and dividing by the number of residents. Australia’s mean age was 40.0 years, 1.6 years above the median1. The mean is higher because ages extend to 100 and over while the population is concentrated at younger ages. In 2025, 59.2 per cent of people were aged under 45.
The 30 June 2025 estimates are preliminary and will be revised2. The next quarterly update, covering the March quarter 2026, is due on 17 September 20261.
| Median age, mean age and population by sex, Australia, 30 June 2025 | |||
|---|---|---|---|
| Sex | Median age (years) | Mean age (years) | Population |
| Males | 37.52 | 39.22 | 13,706,621 |
| Females | 39.34 | 40.82 | 13,904,405 |
| Persons | 38.43 | 40.02 | 27,611,026 |
Source · ABS Population by age and sex, national, Tables 3, 4 and 8
Section 02 · The change since 1971
How has Australia’s median age changed since 1971?
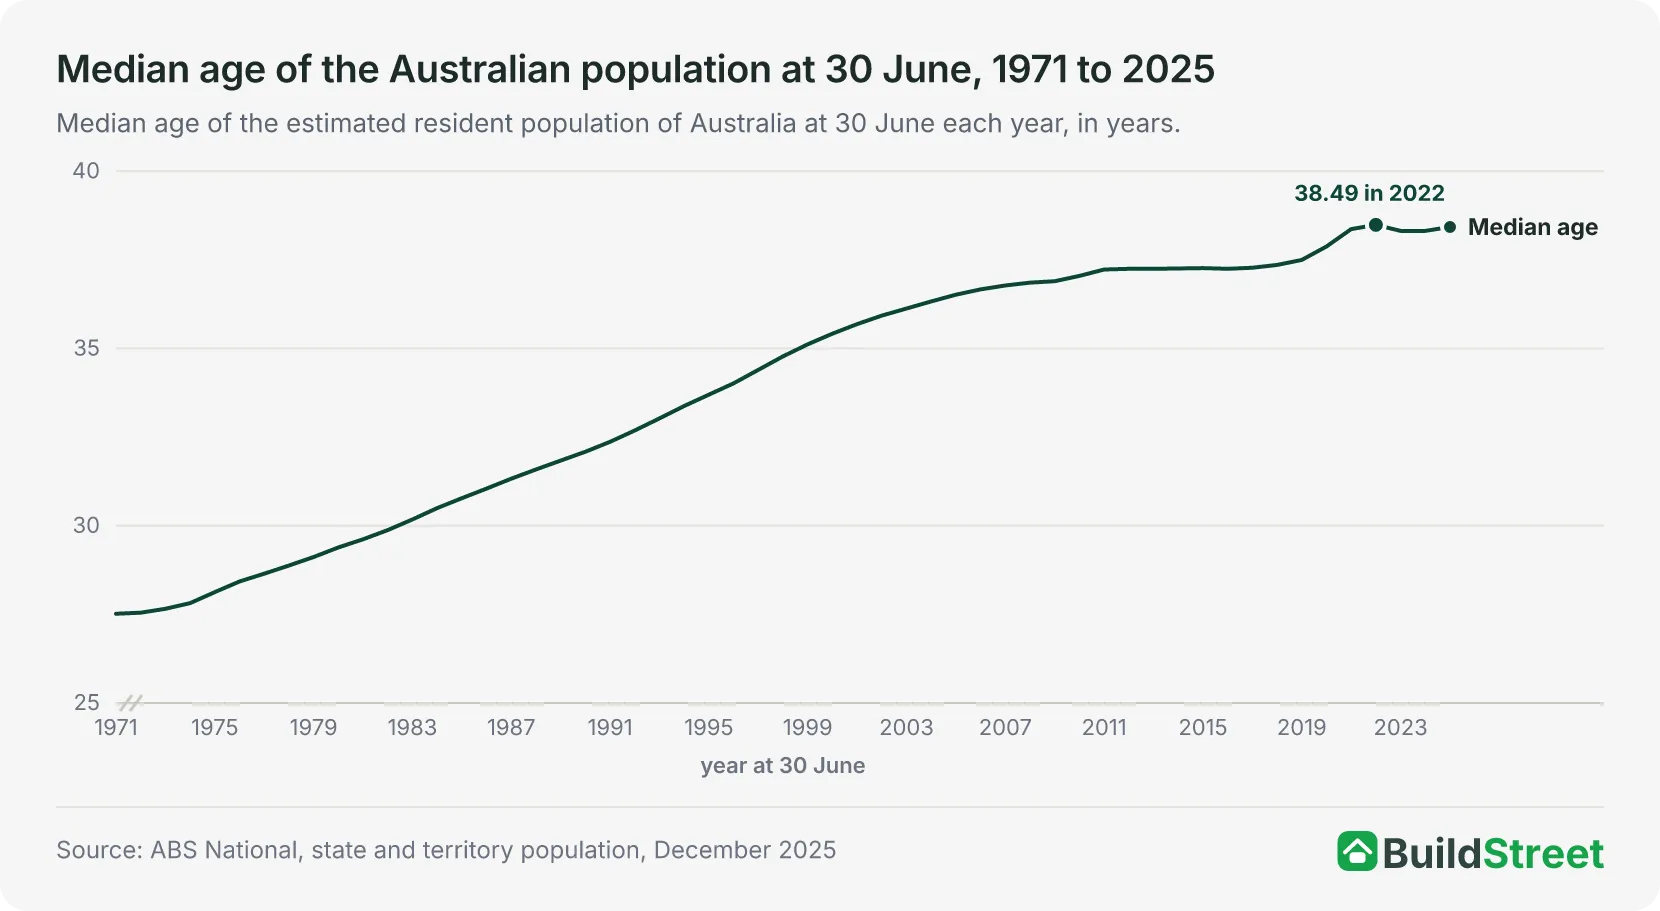
Australia’s median age increased from 27.5 years at 30 June 1971 to 38.4 years in 2025, a rise of 10.9 years over 54 years1. The largest 10-year increase was between 1991 and 2001, when the median rose 3.32 years, from 32.37 to 35.69 years. It rose by 2.10 years between 1971 and 1981, and by 2.75 years between 1981 and 1991. The increase slowed to 1.54 years in the ten years from 2001 to 2011, and to 1.14 years between 2011 and 2021.
The median first reached 30 years in 1983, 34 years in 1996 and 38 years in 20211. The ABS publishes the median age directly from 2006 onwards. Between 2006 and 2025, it increased by 1.76 years, from 36.67 to 38.43.
Across the 54 year-to-year changes, the median fell only twice. It reached 38.49 years in June 2022, the highest value since 1971, before falling to 38.32 in 2023. It remained at 38.32 in 2024 and increased to 38.43 in 20251. The other decline was from 37.27 in 2015 to 37.25 in 2016.
| Median age milestones, Australia, 1971 to 2025 | ||
|---|---|---|
| Milestone | First 30 June at or above | Median age that year |
| 30 years | 30 June 1983 | 30.18 |
| 32 years | 30 June 1990 | 32.09 |
| 34 years | 30 June 1996 | 34.02 |
| 36 years | 30 June 2003 | 36.13 |
| 38 years | 30 June 2021 | 38.37 |
Source · ABS Estimated resident population by single year of age, Australia, Table 59, and Population by age and sex, national, Table 3
Section 03 · States and territories
Which states and territories have the oldest and youngest populations?
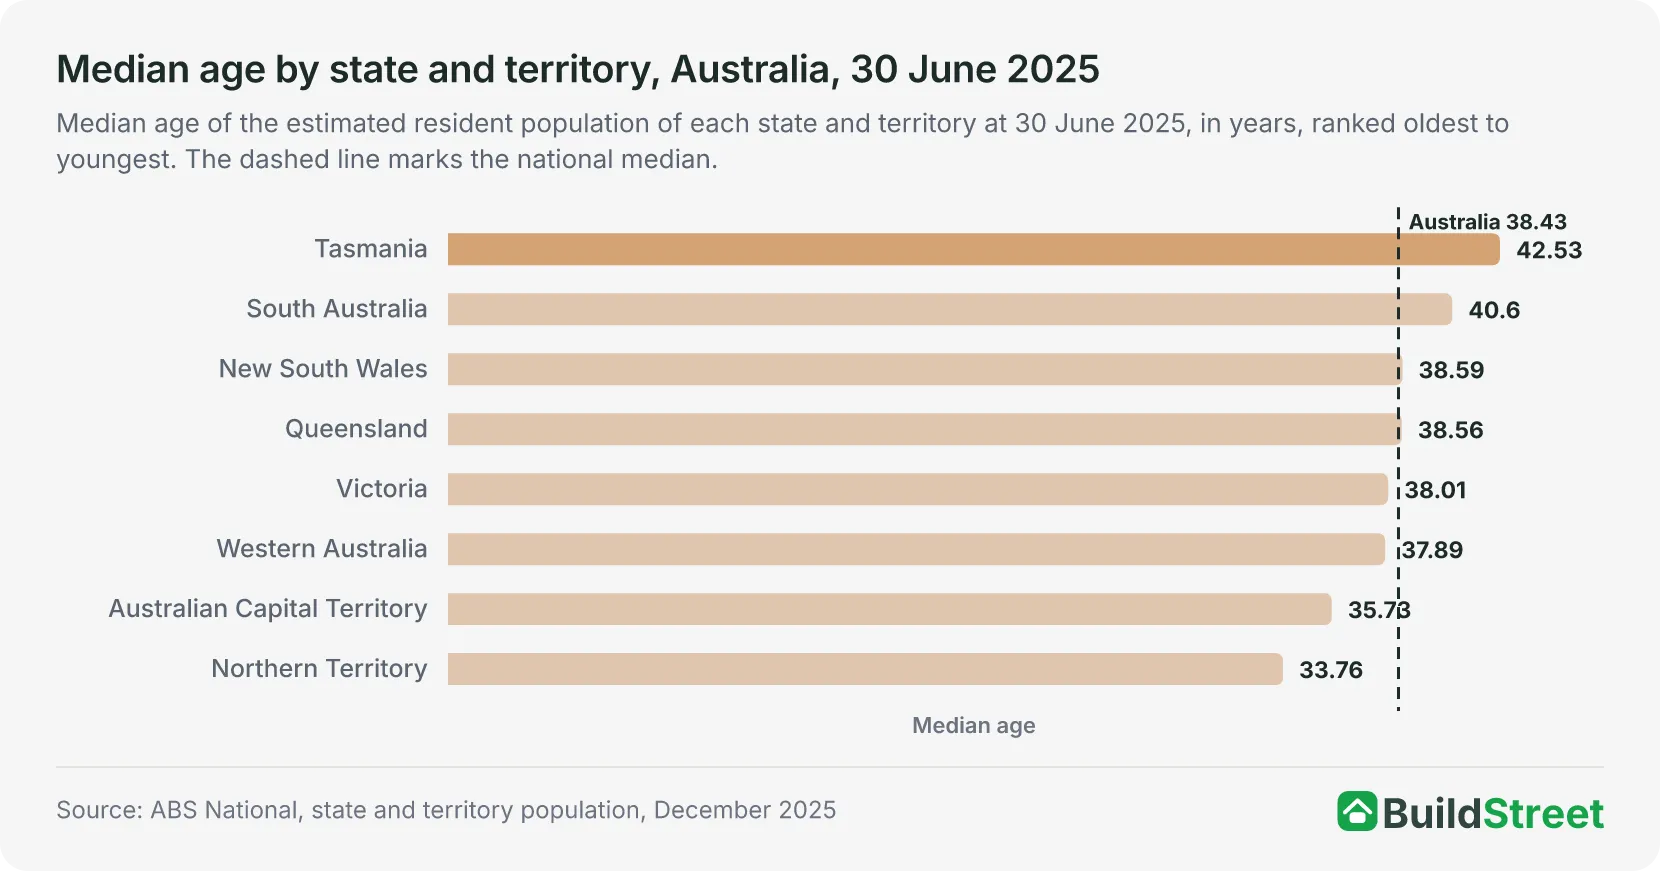
Tasmania had the oldest population of any state or territory in 2025, with a median age of 42.53 years, while the Northern Territory had the youngest, at 33.76 years, a gap of 8.77 years1.
South Australia had the second oldest, at 40.60. New South Wales, at 38.59, and Queensland, at 38.56, were just above the national median of 38.43, while Victoria, at 38.01, Western Australia, at 37.89, and the Australian Capital Territory, at 35.73, were below it.
Tasmania’s median age also increased more than that of any other state or territory between 2006 and 2025. It rose by 3.63 years, from 38.90 to 42.53 years, compared with an increase of 1.76 years nationally1. The Northern Territory’s median increased by 2.78 years, from 30.98 to 33.76, and Queensland’s median increased by 2.50 years, from 36.06 to 38.56. The medians for New South Wales and South Australia both increased by 1.79 years. Victoria had the smallest increase, of 1.23 years, from 36.78 to 38.01.
Tasmania also had the highest share of people aged 65 and over of any state or territory while the Northern Territory had the lowest. In Tasmania, 22.4 per cent of residents were aged 65 and over in 2025, compared with 17.5 per cent nationally1. In the Northern Territory, the share was 9.6 per cent. South Australia, at 20.5 per cent, was the only other state or territory above 20 per cent. The Northern Territory had the largest share of children aged 0 to 14, at 20.1 per cent, while Tasmania had the smallest, at 15.9 per cent.
| Median age by state and territory and sex, Australia, 30 June 2006 and 30 June 2025 | |||||||
|---|---|---|---|---|---|---|---|
| State or territory | Persons 2025 | Males 2025 | Females 2025 | Persons 2006 | Change (years) | Aged 0 to 14 2025 (%) | Aged 65+ 2025 (%) |
| Tasmania | 42.53 | 41.26 | 43.78 | 38.90 | +3.63 | 15.9 | 22.4 |
| South Australia | 40.60 | 39.50 | 41.69 | 38.81 | +1.79 | 16.3 | 20.5 |
| New South Wales | 38.59 | 37.58 | 39.58 | 36.80 | +1.79 | 17.4 | 18.0 |
| Queensland | 38.56 | 37.68 | 39.41 | 36.06 | +2.50 | 17.7 | 17.4 |
| Victoria | 38.01 | 37.12 | 38.90 | 36.78 | +1.23 | 17.3 | 17.0 |
| Western Australia | 37.89 | 37.16 | 38.62 | 36.28 | +1.61 | 17.9 | 16.3 |
| Australian Capital Territory | 35.73 | 35.18 | 36.30 | 34.42 | +1.31 | 17.1 | 14.0 |
| Northern Territory | 33.76 | 33.35 | 34.19 | 30.98 | +2.78 | 20.1 | 9.6 |
| Australia | 38.43 | 37.52 | 39.34 | 36.67 | +1.76 | 17.4 | 17.5 |
Source · ABS Population by age and sex, national, Tables 3 and 8
Section 04 · Capitals and regions
How does the median age differ between capital cities and regional areas?
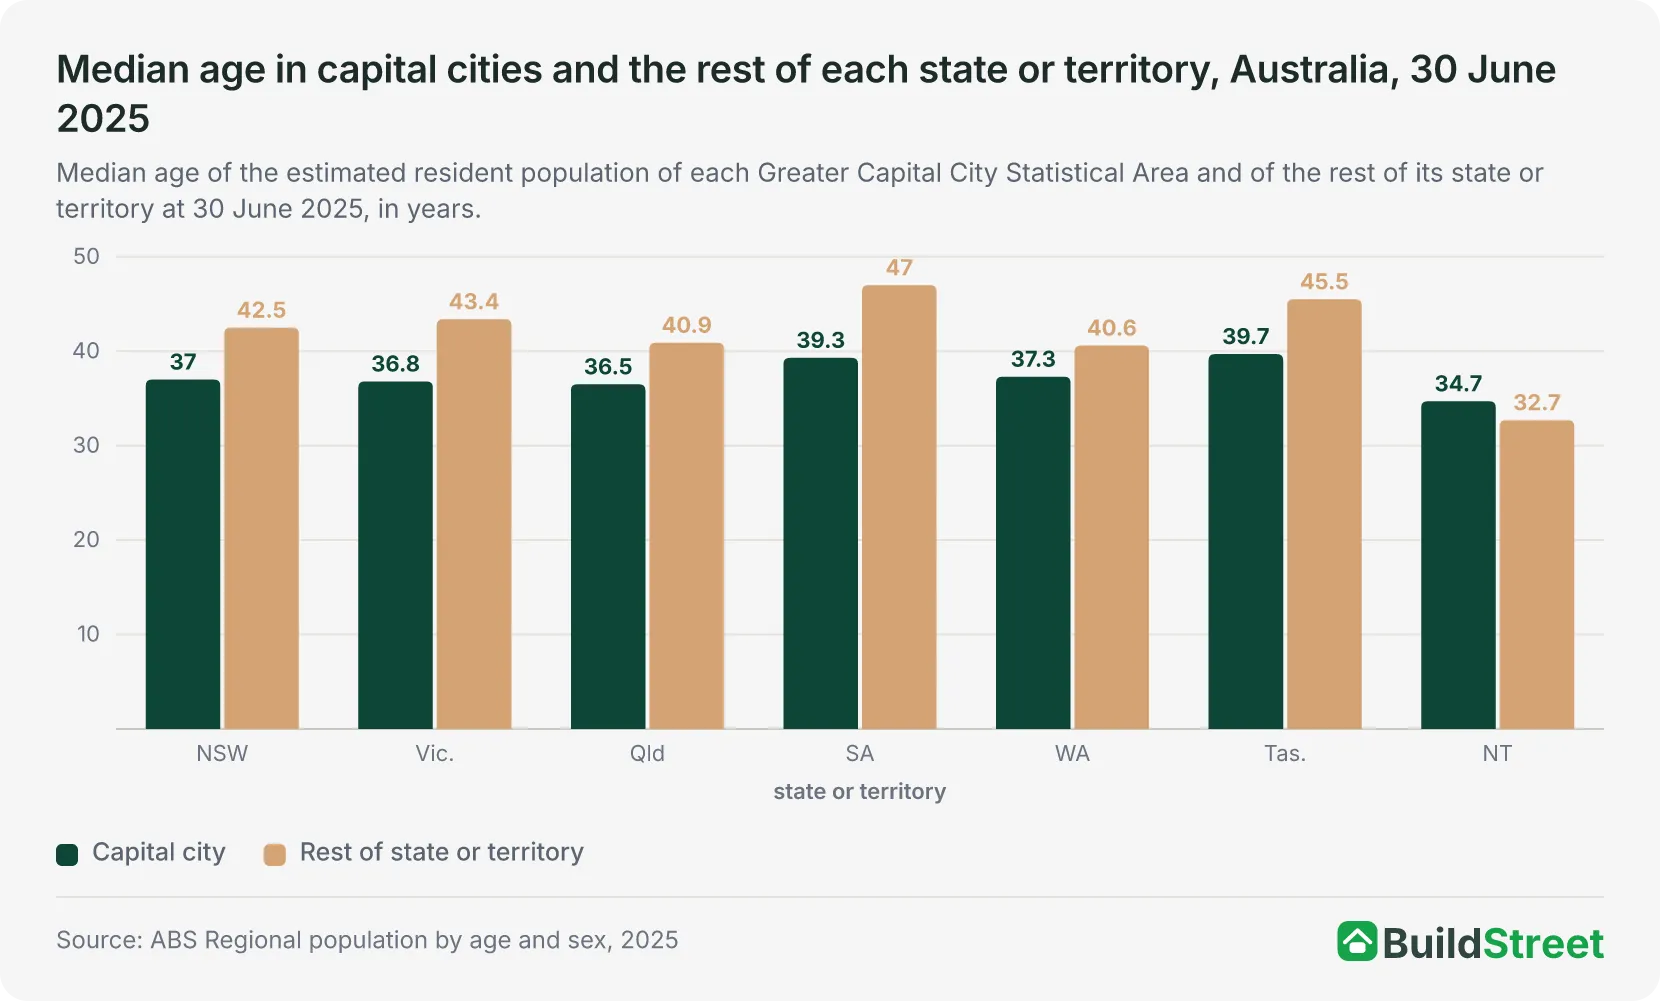
The eight capital cities combined had a median age of 37.0 years in 2025, against 42.1 years in the rest of Australia3. Darwin was the youngest capital, at 34.7 years, followed by Canberra at 35.7. Hobart was the oldest, at 39.7, followed by Adelaide at 39.3. Sydney’s median was 37.0 years, Perth’s was 37.3, Melbourne’s was 36.8 and Brisbane’s was 36.5.
The gap between a capital and the rest of its state or territory was widest in South Australia. The rest of South Australia had a median age of 47.0 years, 7.7 years higher than Adelaide’s 39.3 years3. The rest of Tasmania, at 45.5 years, Victoria, at 43.4, New South Wales, at 42.5, Queensland, at 40.9, and Western Australia, at 40.6, also had higher median ages than their capital cities. The Northern Territory was the exception. The rest of the territory, at 32.7 years, was younger than Darwin, at 34.7.
People aged 65 and over made up a larger share of the population outside the capitals. They accounted for 21.9 per cent of the population outside the eight capitals, compared with 15.5 per cent within them, based on the five-year age-group estimates3. The rest of South Australia had the highest share of any capital or rest-of-state area, at 26.5 per cent, and the rest of the Northern Territory the lowest, at 8.3 per cent. Among the capitals, Darwin had the lowest share, at 10.6 per cent, and Hobart had the highest, at 19.8 per cent.
Among the smallest areas, medians ranged from 21.1 years in Acton in Canberra to 67.0 years in Tea Gardens - Hawks Nest in New South Wales3. The ABS describes the youngest areas as those with large student or military populations and the oldest as coastal retirement destinations.
| Median age and broad age shares by capital city and rest of state or territory, Australia, 30 June 2025 | |||
|---|---|---|---|
| Area | Median age (years) | Aged 0 to 14 (%) | Aged 65+ (%) |
| Greater Sydney | 37.0 | 17.3 | 15.4 |
| Rest of NSW | 42.5 | 17.6 | 22.9 |
| Greater Melbourne | 36.8 | 17.4 | 15.0 |
| Rest of Vic. | 43.4 | 17.2 | 23.5 |
| Greater Brisbane | 36.5 | 18.0 | 14.8 |
| Rest of Qld | 40.9 | 17.4 | 20.0 |
| Greater Adelaide | 39.3 | 16.5 | 18.8 |
| Rest of SA | 47.0 | 15.8 | 26.5 |
| Greater Perth | 37.3 | 17.8 | 15.7 |
| Rest of WA | 40.6 | 18.4 | 18.7 |
| Greater Hobart | 39.7 | 16.1 | 19.8 |
| Rest of Tas. | 45.5 | 15.8 | 24.5 |
| Greater Darwin | 34.7 | 19.6 | 10.6 |
| Rest of NT | 32.7 | 21.0 | 8.3 |
| Australian Capital Territory | 35.7 | 17.1 | 14.0 |
| Total capital cities | 37.0 | 17.4 | 15.5 |
| Rest of Australia | 42.1 | 17.4 | 21.9 |
Source · ABS Regional population by age and sex, 2025, release tables and Population estimates by age and sex, by SA2, 2025, Table 3
Section 05 · The age structure
How is Australia’s population split by age group?
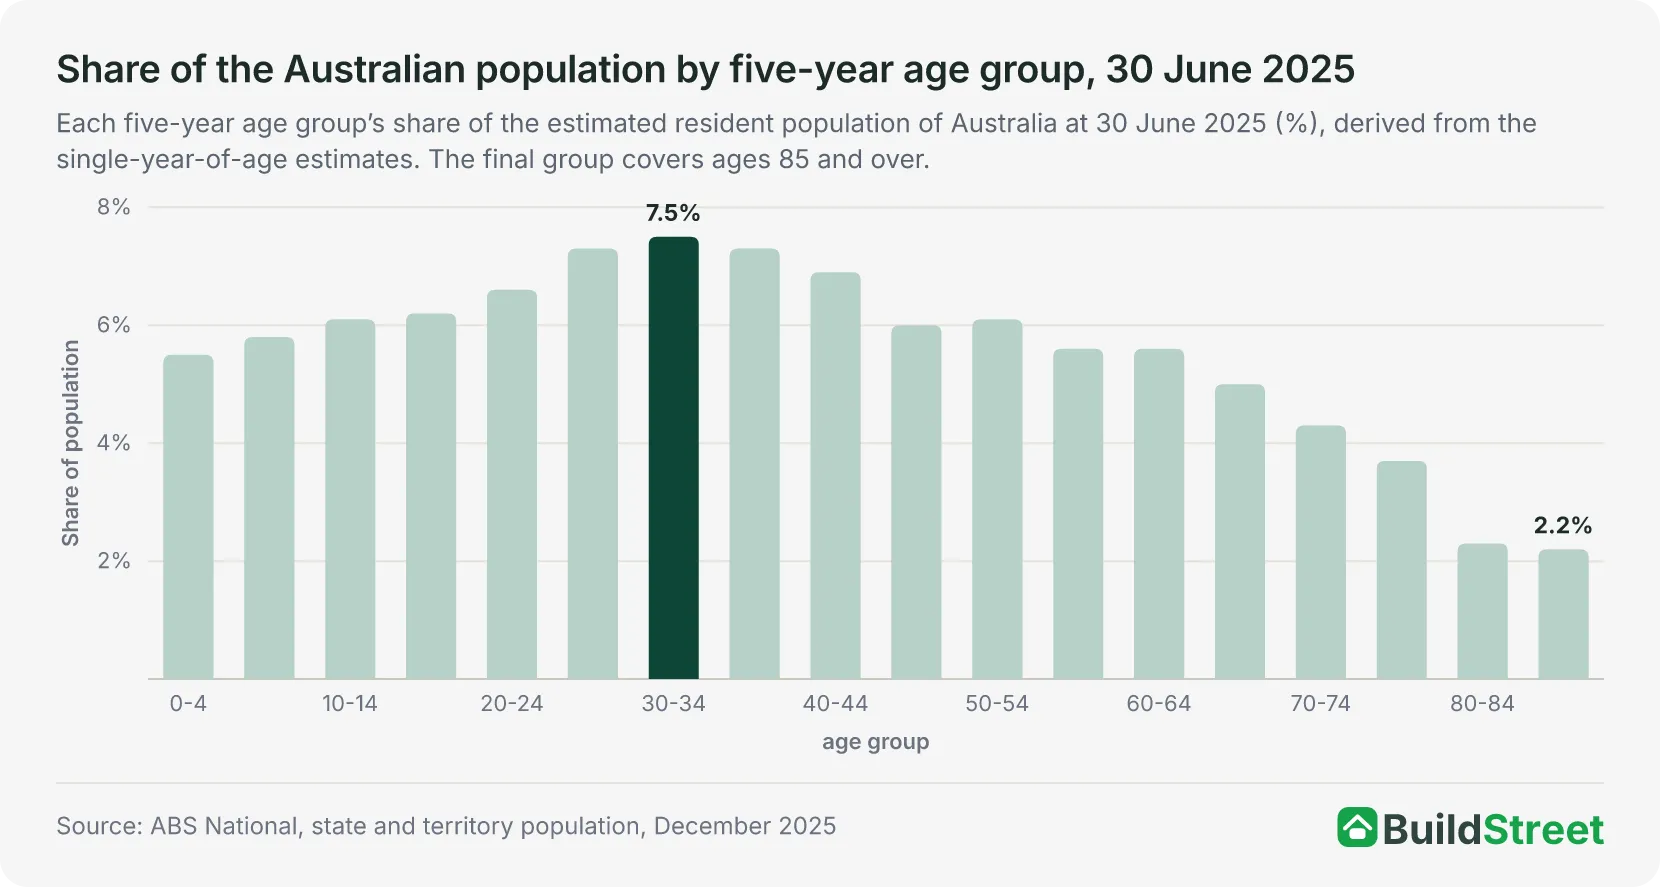
People aged 30 to 34 formed the largest five-year age group in Australia in 2025, with 2,064,838 people, or 7.5 per cent of the population1. The 25 to 29 group, at 2,025,212 people, and the 35 to 39 group, at 2,018,659, were the next largest. Every five-year group from 25 to 44 had more than 1.9 million people. The 0 to 4 group, at 1,517,283 people, was smaller than every five-year group between 15 and 64.
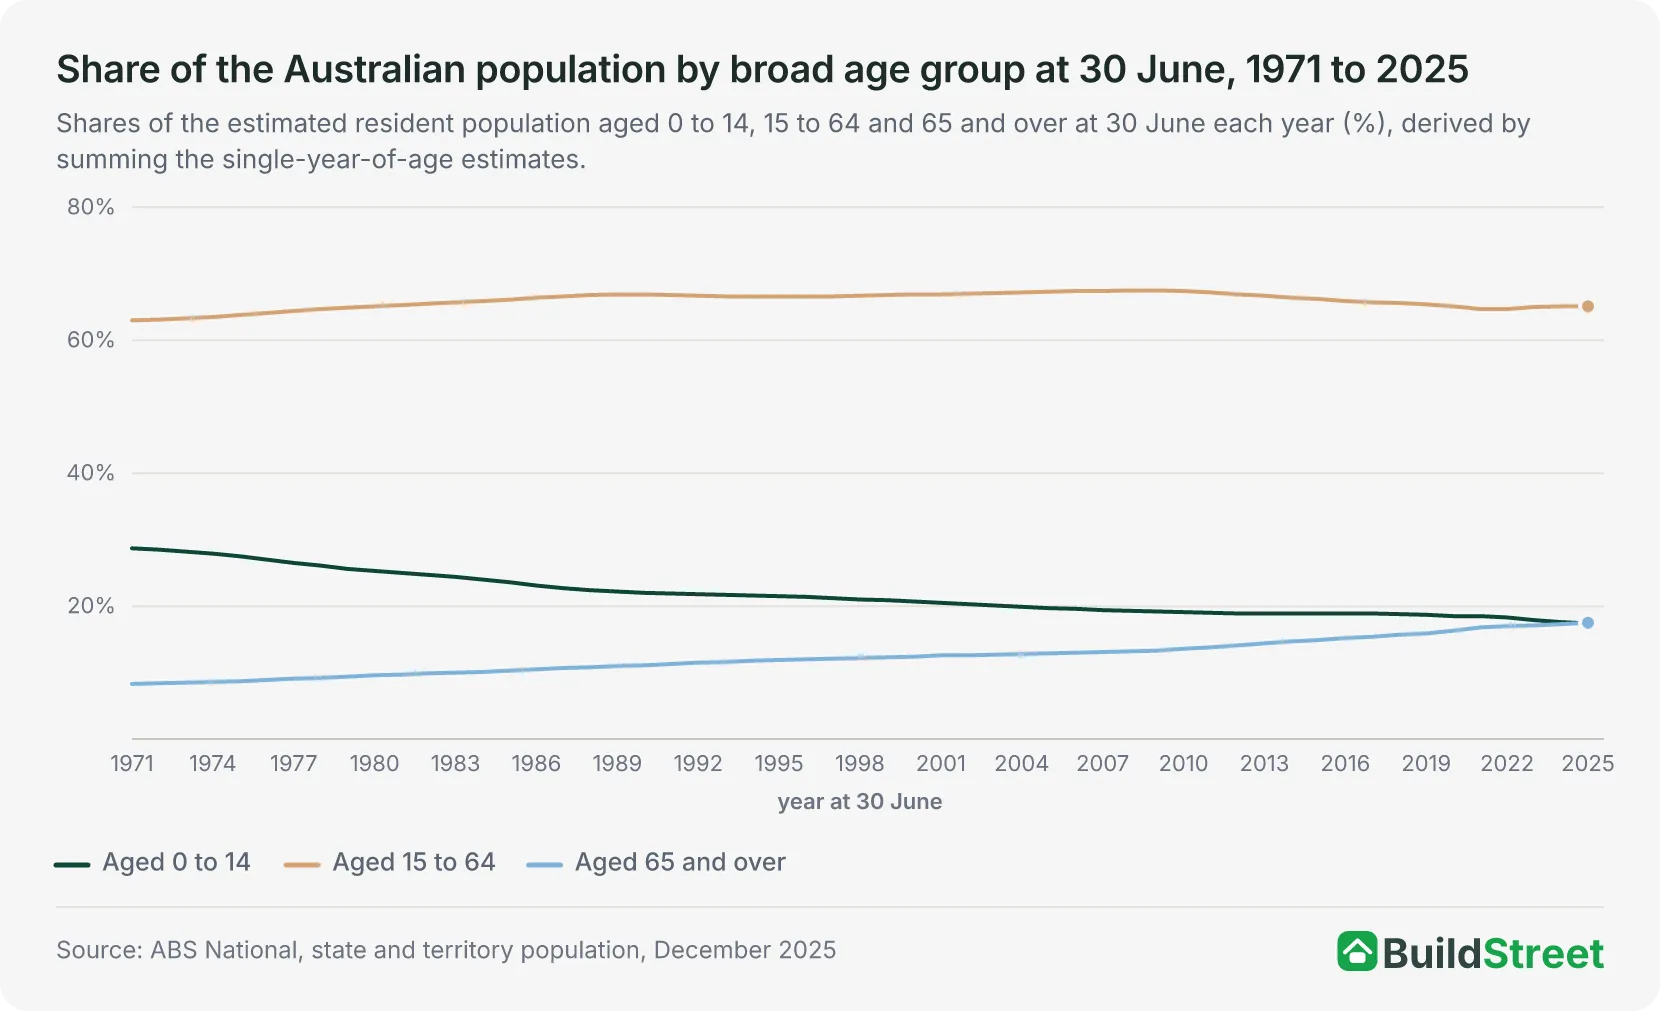
Across broader groups, 4,803,760 people, or 17.4 per cent, were aged 0 to 141. A further 17,967,879, or 65.1 per cent, were aged 15 to 64, and 4,839,387, or 17.5 per cent, were aged 65 and over. For the first time since the estimates began in 1971, people aged 65 and over outnumbered children aged 0 to 14, by 35,627. In 2024, there were 4,794,964 children and 4,697,558 people aged 65 and over.
In 1971, children aged 0 to 14 made up 28.7 per cent of the population and people aged 65 and over made up 8.3 per cent. The share aged 65 and over more than doubled over the 54 years to 2025, while the share aged 85 and over increased from 0.5 per cent to 2.2 per cent. The share aged 15 to 64 changed less, from 63.0 per cent in 1971 to 65.1 per cent in 2025.
The number of people aged 65 and over for every 100 people aged 15 to 64 increased from 13.2 in 1971 to 26.9 in 20251. Over the same period, the number of children aged 0 to 14 for every 100 people aged 15 to 64 fell from 45.5 to 26.7.
How the ABS projects these shares to 2071 is covered in the population projections article.
| Population by broad age group, Australia, 30 June 1971, 2001 and 2025 | ||||||
|---|---|---|---|---|---|---|
| Age group | 1971 | Share 1971 (%) | 2001 | Share 2001 (%) | 2025 | Share 2025 (%) |
| 0 to 14 | 3,747,277 | 28.7 | 3,960,233 | 20.5 | 4,803,760 | 17.4 |
| 15 to 64 | 8,229,615 | 63.0 | 12,895,398 | 66.9 | 17,967,879 | 65.1 |
| 65 and over | 1,090,373 | 8.3 | 2,419,070 | 12.6 | 4,839,387 | 17.5 |
| 85 and over | 66,930 | 0.5 | 263,442 | 1.4 | 602,761 | 2.2 |
| All ages | 13,067,265 | 100.0 | 19,274,701 | 100.0 | 27,611,026 | 100.0 |
Source · ABS Estimated resident population by single year of age, Australia, Table 59
Section 06 · The generations
How big is each generation in Australia?
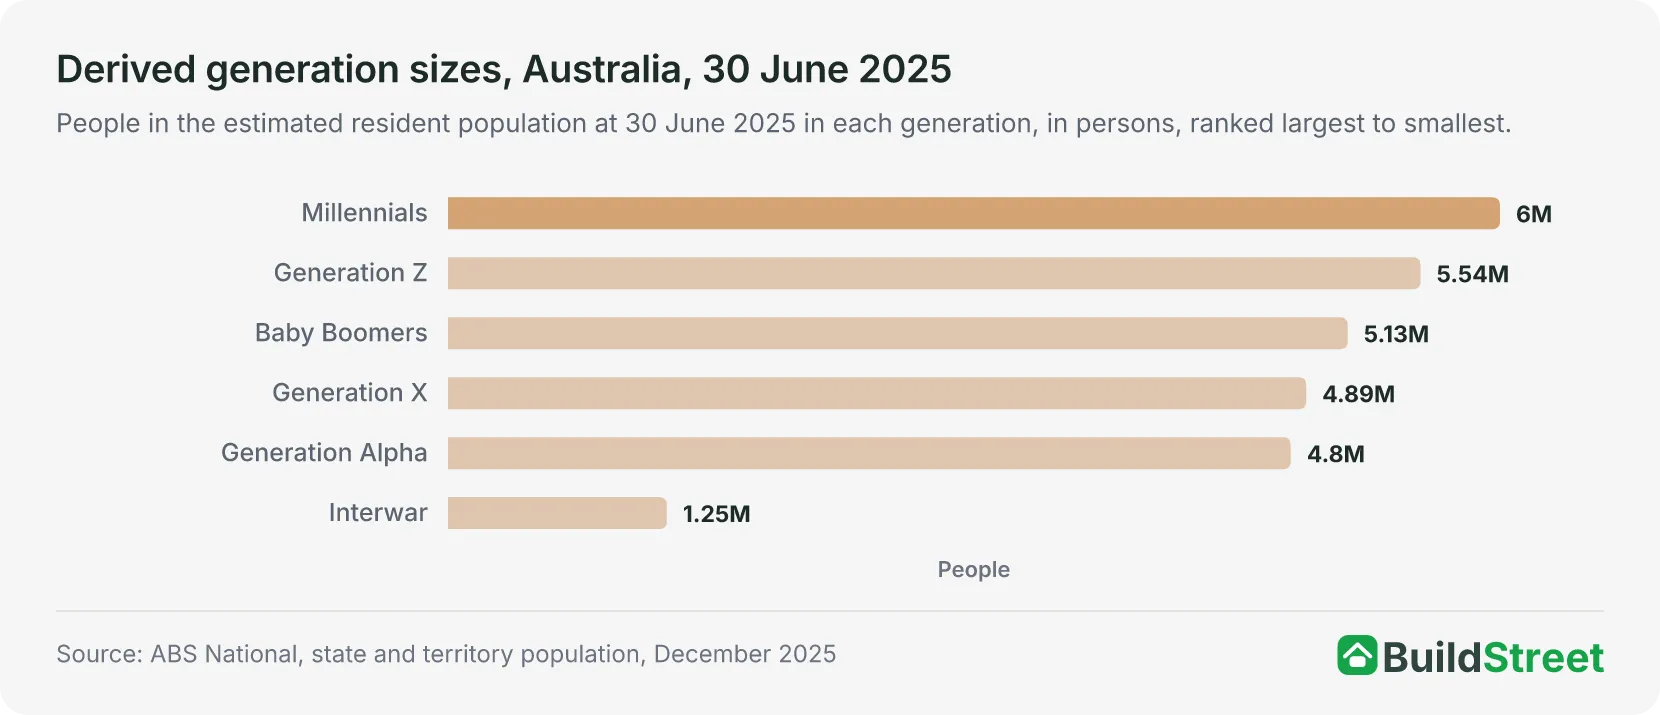
Millennials were the largest generation in Australia in 2025, with 5,996,196 people, or 21.7 per cent1. Generation Z was next, with 5,543,505 people, or 20.1 per cent, followed by Baby Boomers, with 5,128,329, or 18.6 per cent. Generation X had 4,891,741, or 17.7 per cent, and Generation Alpha had 4,803,760, or 17.4 per cent. The Interwar generation numbered 1,247,495 people, or 4.5 per cent.
The generations are defined by year of birth: Generation Alpha from 2011, Generation Z from 1996 to 2010, Millennials from 1981 to 1995, Generation X from 1966 to 1980, Baby Boomers from 1946 to 1965 and the Interwar generation as 1945 or earlier4. The ABS reported that Millennials and Baby Boomers were almost equal in size at the 2021 Census, with Millennials having caught up. By 2025, Millennials outnumbered Baby Boomers by 867,867 people.
The generations are not equal in length. The Baby Boomer cohort spans 20 birth years, from 1946 to 1965, while Generation X, Millennials and Generation Z each span 15. Dividing each cohort by its number of birth years gives about 400,000 people per Millennial birth year and about 256,000 per Baby Boomer birth year.
| Generation sizes derived from the estimated resident population, Australia, 30 June 2025 | ||||
|---|---|---|---|---|
| Generation | Birth years | Ages at 30 June 2025 | People | Share (%) |
| Generation Alpha | 2011 onwards | 0 to 14 | 4,803,760 | 17.4 |
| Generation Z | 1996 to 2010 | 15 to 29 | 5,543,505 | 20.1 |
| Millennials | 1981 to 1995 | 30 to 44 | 5,996,196 | 21.7 |
| Generation X | 1966 to 1980 | 45 to 59 | 4,891,741 | 17.7 |
| Baby Boomers | 1946 to 1965 | 60 to 79 | 5,128,329 | 18.6 |
| Interwar | 1945 or earlier | 80 and over | 1,247,495 | 4.5 |
| All generations | All ages | 27,611,026 | 100.0 | |
Source · ABS Population by age and sex, national, Table 8, and ABS media release, 28 June 2022
Section 07 · The long run
How has Australia’s median age changed since 1901?
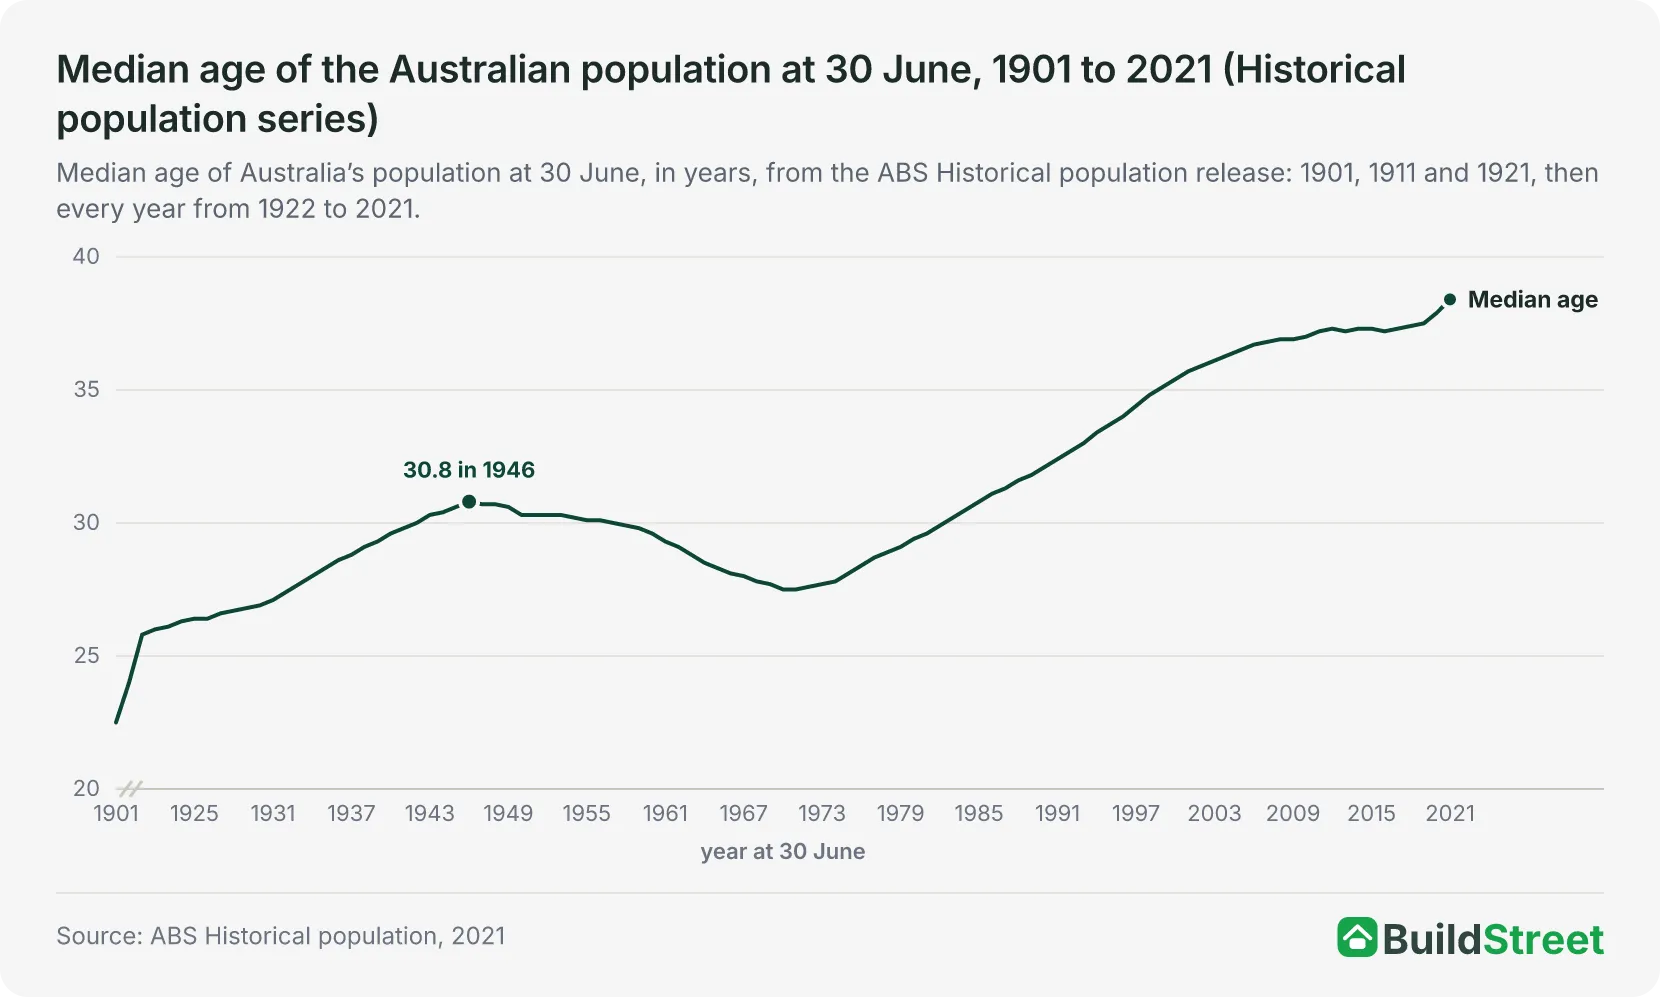
Australia’s median age was 22.5 years at 30 June 1901 compared with 38.4 years at 30 June 20215. The median rose from 22.5 years in 1901 to 30.8 years in 1946, then fell or remained unchanged through to 27.5 years in 1970, a decline of 3.3 years over 24 years. It first reached 30 years in 1942 and did not return to that level until 1983.
After 1970, the median decreased in only two years. The historical data show decreases from 37.3 years in 2012 to 37.2 in 2013, and from 37.3 in 2015 to 37.2 in 2016. More recent ABS data show no change between 2012 and 2013, at 37.25 years, and a fall of 0.02 years between 2015 and 2016. The difference is due to rounding, as the historical figures are shown to one decimal place and the more recent figures to two. Over the 120 years from 1901 to 2021, the median increased by 15.9 years.
The historical figures and the December 2025 figures overlap from 1971 to 2021 and agree to within 0.05 years in every year. Before 1971, the historical figures are based on the number of people present in Australia rather than the estimated resident population. Before 1921, median ages are calculated from five-year age groups, so the earlier figures are not directly comparable with those from 1971 onwards.
The births and deaths behind natural increase over the same period are covered in the births and deaths in Australia article.
Section 08
Australia’s median age: quick answers
What is the median age in Australia?
The median age in Australia was 38.4 years at 30 June 2025, according to the Australian Bureau of Statistics National, state and territory population release for December 2025. Half of Australia’s estimated resident population of 27,611,026 people were older than 38.4 years and half were younger. The median age for females was 39.3 years and for males 37.5 years.
Is Australia’s population getting older?
Yes. Australia’s median age increased from 27.5 years at 30 June 1971 to 38.4 years at 30 June 2025, and the share of the population aged 65 and over increased from 8.3 per cent to 17.5 per cent over the same period. The median did not rise every year. It peaked at 38.49 years in 2022, fell to 38.32 in 2023, remained at that level in 2024 and increased to 38.43 in 2025.
Which Australian state or territory has the oldest population?
Tasmania had the oldest population of any state or territory at 30 June 2025, with a median age of 42.53 years, followed by South Australia at 40.60. The Northern Territory had the youngest, at 33.76 years, and the Australian Capital Territory had the second youngest, at 35.73 years. The national median was 38.43 years.
Which generation is the largest in Australia?
Millennials, born from 1981 to 1995 under the ABS definition, were the largest generation at 30 June 2025, with 5,996,196 people, or 21.7 per cent of the population. Generation Z, born from 1996 to 2010, followed with 5,543,505 people, and the Baby Boomers, born from 1946 to 1965, with 5,128,329. Because ages at 30 June do not line up exactly with calendar birth years, each generation boundary is approximate by up to one year.
How many people in Australia are aged 65 and over?
There were 4,839,387 people aged 65 and over in Australia at 30 June 2025, equal to 17.5 per cent of the population, based on the single-year-of-age estimates. That was 35,627 more than the 4,803,760 children aged 0 to 14, marking the first time since the estimates began in 1971 that people aged 65 and over outnumbered children.
What is the difference between median age and mean age?
The median age divides the population in two, with half the population older than it and half younger. The mean age is calculated by adding the ages of all residents and dividing by the number of residents. At 30 June 2025, the Australian median age was 38.4 years and the mean age was 40.0 years. The mean is higher because older ages pull the average upwards, while the median only marks the midpoint.
References
- ABS National, State and Territory Population, December 2025 · Australian Bureau of Statistics ↑ b c d e f g h i j k l m
- ABS, National, state and territory population methodology, December 2025 · Australian Bureau of Statistics ↑
- ABS Regional population by age and sex, 2025 · Australian Bureau of Statistics ↑ b c d
- ABS media release: 2021 Census shows Millennials overtaking Boomers · Australian Bureau of Statistics ↑
- ABS Historical population, 2021 · Australian Bureau of Statistics ↑
