

Published 2 Sept 2026 · Updated 15 Sept 2026
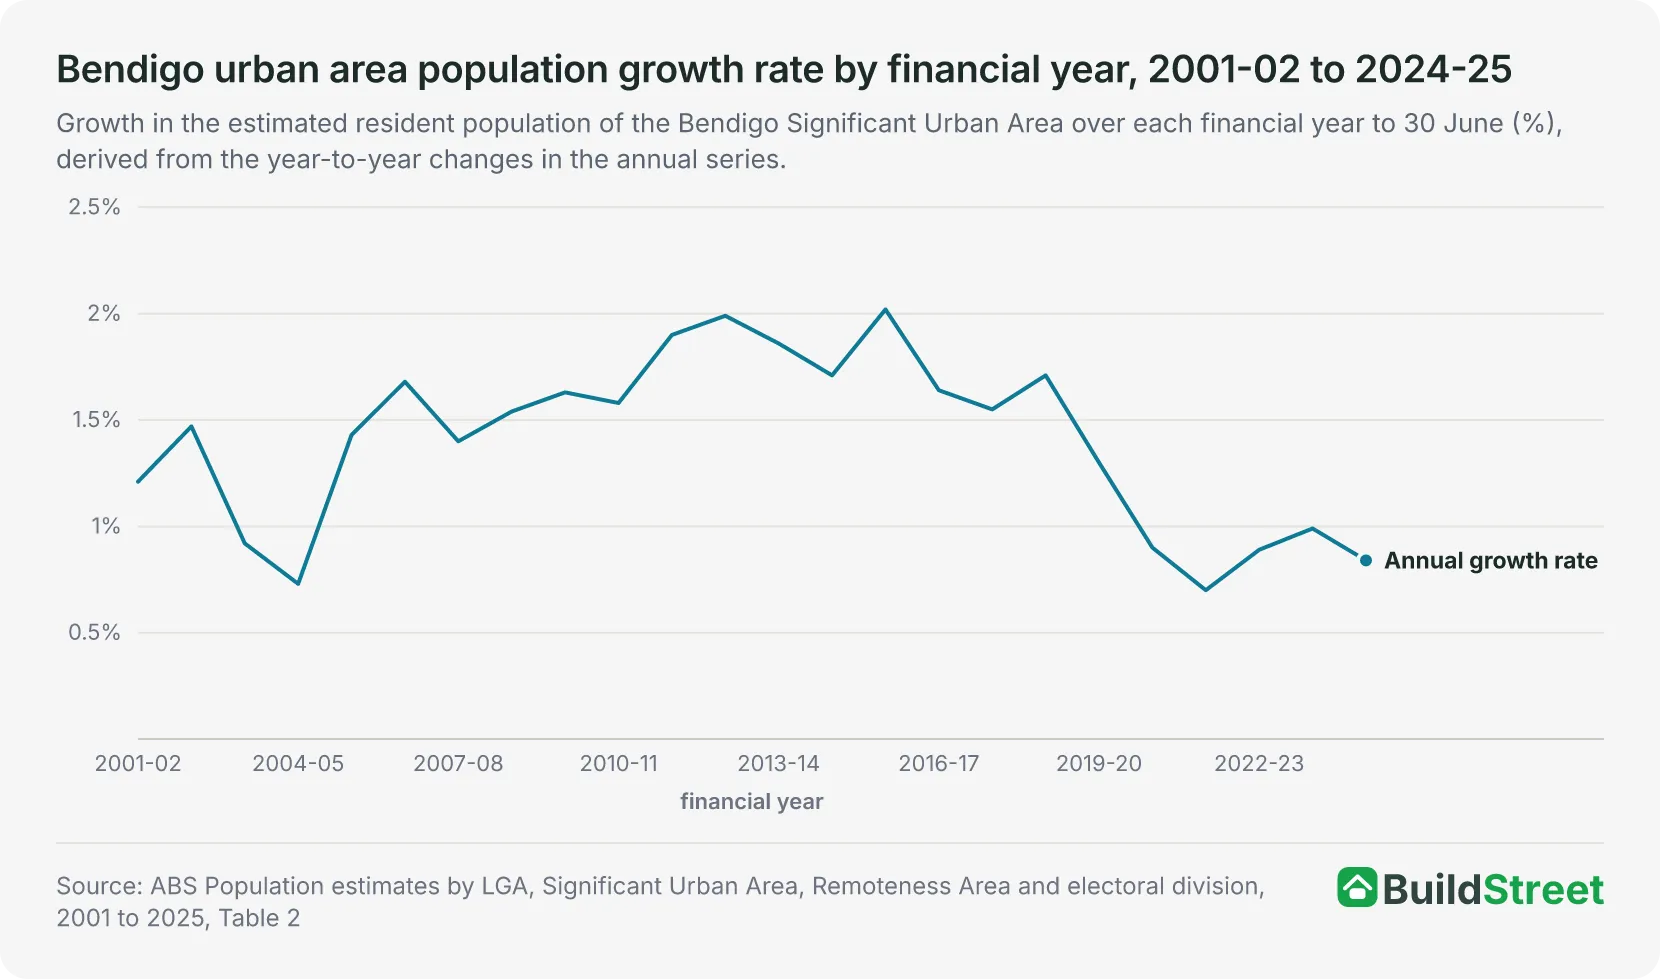 Bendigo, Victoria's fourth largest urban areaBendigo's urban area held 106,493 people at 30 June 2025, 14,446 fewer than Ballarat's, and grew 0.84 per cent over 2024-25. The Bendigo article covers its growth, drivers and long-run series on the same ABS boundaries.
 Victoria's population at 30 June 2025Victoria had an estimated resident population of 7,073,859 at 30 June 2025 in the ABS annual series. The state article covers the total, its drivers and the split between Greater Melbourne and the rest of the state.
Section 01 · The headline number
How many people live in Ballarat?
The Ballarat Significant Urban Area had an estimated resident population of 120,939 at 30 June 2025. That was the third-largest population of the 21 urban areas in Victoria, behind Melbourne and Geelong1. Ballarat accounted for 1.7 per cent of Victoria's estimated 7,073,859 people, and 0.4 per cent of Australia's 27,613,654 people2.
The ABS publishes population estimates annually for 30 June. In the 2024-25 release, the estimates are final for 2001 to 2021, revised for 2022 to 2024 and preliminary for 2025. The next release, covering 30 June 2026, is due on 25 March 20273.
Section 02 · The pace
How fast is Ballarat's population growing?
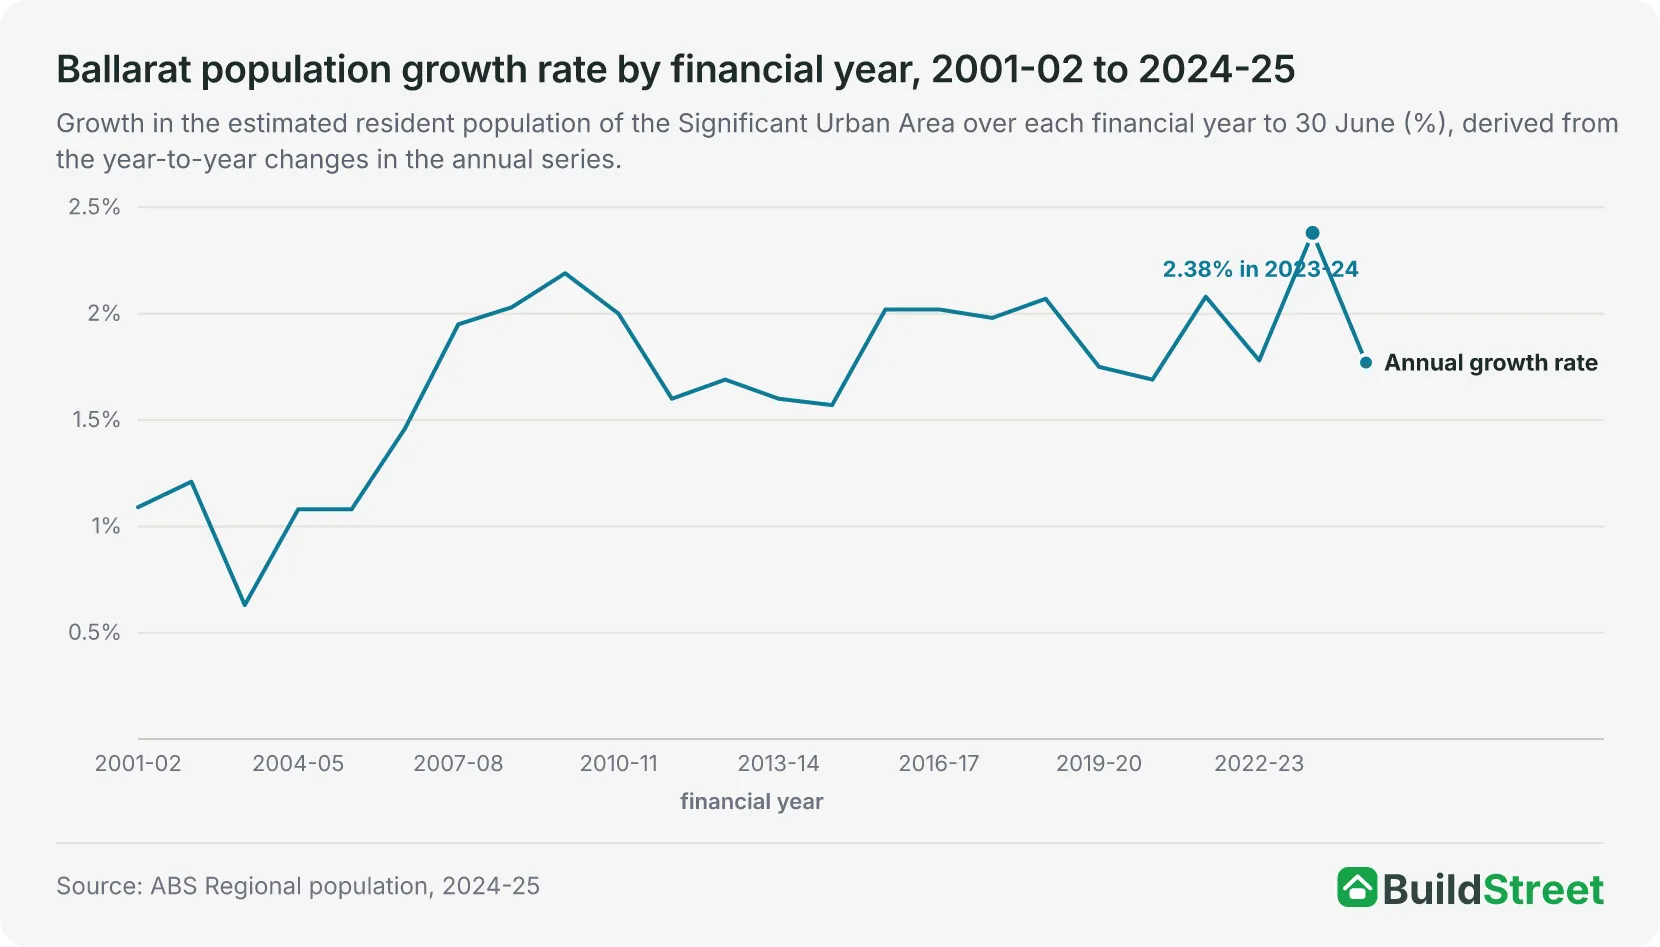
The Ballarat urban area grew by 2,098 people, or 1.77 per cent, in 2024-25, from 118,841 at 30 June 2024 to 120,939 at 30 June 2025. The increase was smaller than the 2,767 people, or 2.38 per cent, added in 2023-24, the largest annual increase and the highest annual growth rate between 2001-02 and 2024-25. It was larger than the 2,029 people, or 1.78 per cent, added in 2022-231.
Victoria as a whole grew 1.77 per cent over the same year, the same rate as Ballarat when rounded to two decimal places. The rest of the state outside Greater Melbourne grew by 1.10 per cent. The ABS reported this as an increase of 17,900 people, or 1.1 per cent2.
Across the 24 financial years from 2001-02 to 2024-25, the Ballarat urban area's annual growth rate ranged from 0.63 per cent to 2.38 per cent. The population increased every year. The lowest rate was 0.63 per cent in 2003-04, when the urban area added 521 people. In each of the 18 years from 2007-08 to 2024-25, the rate was between 1.57 and 2.38 per cent1.
Section 03 · The drivers
What drives Ballarat's population growth?
Net internal migration was the largest component of the City of Ballarat's population growth in 2024-25, adding 1,047 people. Natural increase (the excess of births over deaths) added 568 people, while net overseas migration (arrivals from overseas minus departures) added 4875. Together, the three components accounted for the council area's increase of 2,102 people, or 1.74 per cent.
Net internal migration was also the largest component of growth in each of the neighbouring council areas, adding 358 people in Moorabool, 211 in Golden Plains and 195 in Hepburn5. Hepburn recorded a natural decrease of 49 people and was the only one of the four council areas where deaths exceeded births over the year.
The ABS does not publish population components for urban areas, so the Ballarat urban area's figures are calculated by adding the published data for its nine local areas. On that basis, the urban area's population increase of 2,098 people in 2024-25 comprised natural increase of 565, net internal migration of 1,047 and net overseas migration of 4866. Each component is within three people of the City of Ballarat figure.
Net internal migration was the largest component of the City of Ballarat's growth in three of the four years from 2021-22 to 2024-25. It added 1,380 people in 2021-22, 885 in 2022-23, 1,636 in 2023-24 and 1,047 in 2024-25. In 2022-23, net overseas migration, at 895, was 10 people higher than net internal migration7.
| Components of population change, City of Ballarat and neighbouring council areas, 2024-25 | ||||
|---|---|---|---|---|
| Council area (LGA) | Natural increase | Net internal migration | Net overseas migration | Total change |
| Ballarat | +568 | +1,047 | +487 | +2,102 |
| Moorabool | +297 | +358 | +108 | +763 |
| Golden Plains | +162 | +211 | +30 | +403 |
| Hepburn | -49 | +195 | +48 | +194 |
Source · ABS Population estimates and components by LGA, 2024 to 2025, Table 2
Section 04 · The growth areas
Where in Ballarat is the population growing fastest?
Delacombe and Alfredton accounted for most of the Ballarat urban area's population growth in 2024-25. Of the 19 local areas in the wider Ballarat region, Delacombe recorded both the largest increase, at 1,037 people, and the highest growth rate, at 7.3 per cent, growing from 14,218 to 15,255 over the year. Alfredton added 743 people, or 3.7 per cent, growing from 20,082 to 20,825. Together, the two areas accounted for 1,780 of the urban area's 2,098 additional residents, equal to 85 per cent.
Two of the nine local areas in the urban area lost population over the year. The Ballarat local area fell by 46 people, from 11,714 to 11,668, and Sebastopol - Redan fell by 23, from 12,789 to 12,7666. Between 30 June 2001 and 30 June 2025, Alfredton grew from 5,756 to 20,825 people and Delacombe from 4,154 to 15,255, while the Ballarat local area grew from 11,497 to 11,6682.
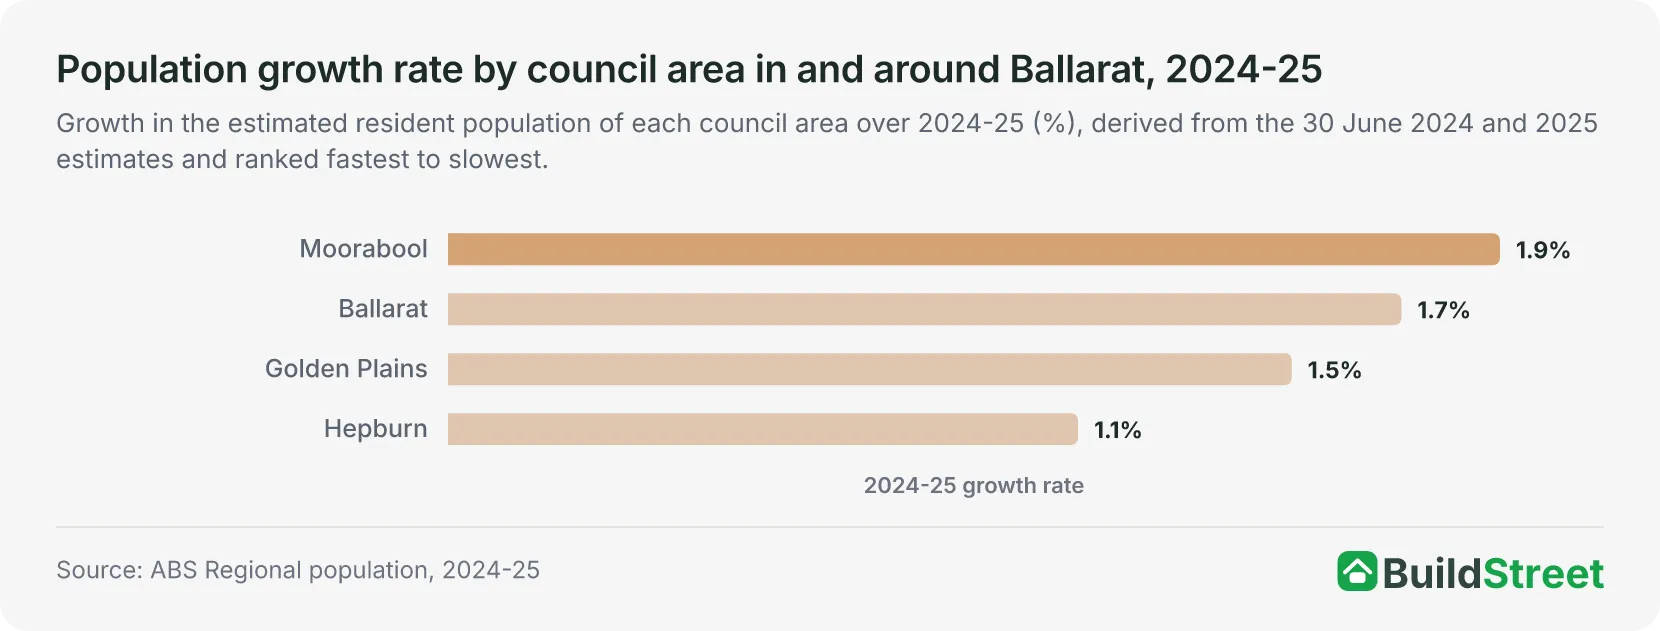
Among the four council areas, Moorabool's population grew fastest in 2024-25, at 1.92 per cent, followed by the City of Ballarat at 1.74 per cent, Golden Plains at 1.54 per cent and Hepburn at 1.15 per cent, with the rates derived from the council-area estimates5.
The wider Ballarat region (SA4) grew from 181,756 to 184,285 people over 2024-25, an increase of 2,529, or 1.39 per cent. The region is made up of three mid-sized ABS areas (SA3). The Ballarat area (SA3), which covers the nine local areas in the urban area plus Smythes Creek, grew from 123,096 to 125,189, an increase of 2,093, or 1.70 per cent. The Creswick - Daylesford - Ballan area (SA3) added 310 people and the Maryborough - Pyrenees area (SA3) added 1262.
| Population change in the nine SA2 areas of the Ballarat urban area, 2024-25 | ||||
|---|---|---|---|---|
| Area (SA2) | 30 June 2024 | 30 June 2025 | Change | Growth rate % |
| Delacombe | 14,218 | 15,255 | +1,037 | 7.3 |
| Alfredton | 20,082 | 20,825 | +743 | 3.7 |
| Canadian - Mount Clear | 12,410 | 12,518 | +108 | 0.9 |
| Ballarat East - Warrenheip | 9,672 | 9,771 | +99 | 1.0 |
| Ballarat North - Invermay | 15,118 | 15,204 | +86 | 0.6 |
| Buninyong | 7,320 | 7,384 | +64 | 0.9 |
| Wendouree - Miners Rest | 15,518 | 15,548 | +30 | 0.2 |
| Sebastopol - Redan | 12,789 | 12,766 | -23 | -0.2 |
| Ballarat | 11,714 | 11,668 | -46 | -0.4 |
Source · ABS Population estimates and components by SA2, 2024 to 2025, Table 2
Section 05 · The state picture
How does Ballarat compare with other cities in Victoria?
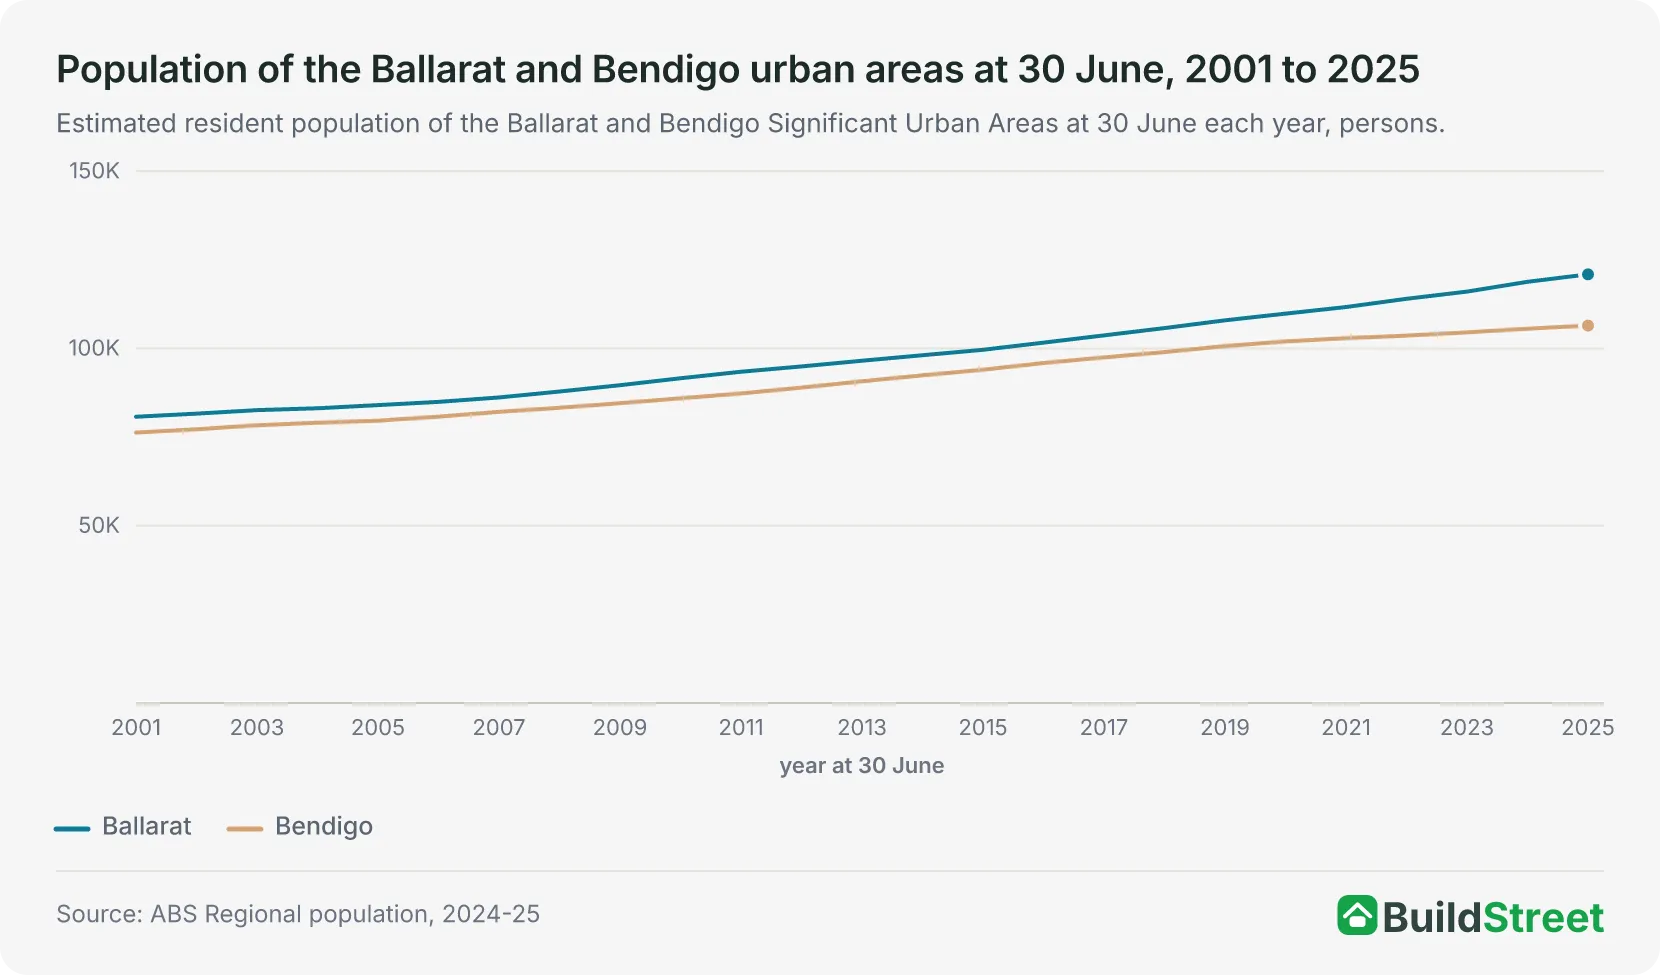
Ballarat was the third-largest of the 21 urban areas in Victoria at 30 June 2025, and ranked third in every year from 2001 to 2025. The Melbourne urban area had 5,328,274 people, Geelong 314,381, Ballarat 120,939 and Bendigo 106,493. The next largest, Shepparton - Mooroopna, had 55,332 people, less than half of Ballarat's total1.
Ballarat had more residents than Bendigo in every year from 2001 to 2025. The gap widened from 4,462 people at 30 June 2001 to 14,446 at 30 June 2025. It was narrowest at 30 June 2007, at 4,052, and widened in every year from 2015 to 20251. Over the 24 years, Ballarat grew 49.7 per cent and Bendigo 39.5 per cent, while Geelong grew 57.4 per cent, from 199,732 to 314,381.
In 2024-25, Ballarat's 1.77 per cent growth rate was the sixth highest of the 21 Victorian urban areas, and its increase of 2,098 people was the third largest, behind Melbourne's 102,910 and Geelong's 6,360. The five faster-growing urban areas were Gisborne at 2.61 per cent, Bacchus Marsh at 2.45 per cent, Geelong at 2.06 per cent, Melbourne at 1.97 per cent and Warragul - Drouin at 1.93 per cent. Bendigo grew by 0.84 per cent, adding 883 people1.
Bendigo's population data is covered in the Bendigo population article.
Section 06 · The national rank
Where does Ballarat rank among Australia's largest cities?
Ballarat was the 18th-largest of Australia's 102 urban areas at 30 June 2025, and ranked 18th in every year from 2001 to 2025. Darwin, at 145,019, ranked 17th, while Bendigo, at 106,493, ranked 19th1.
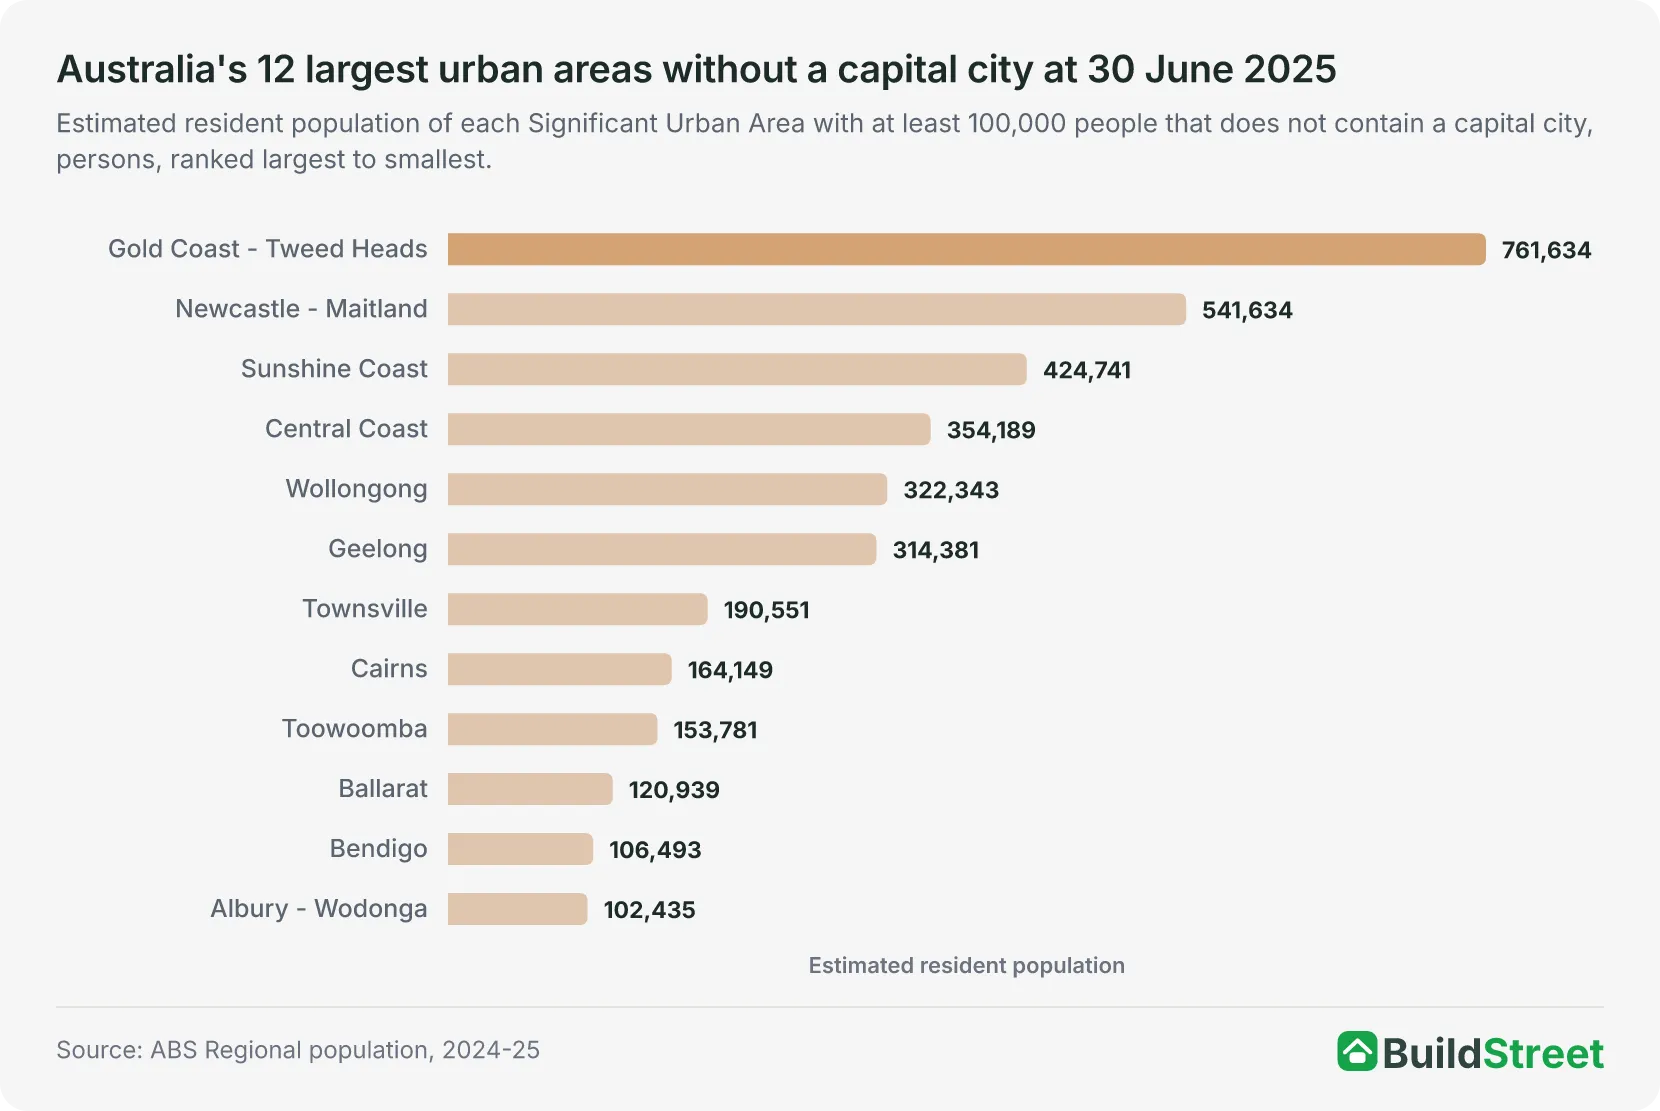
Among the urban areas that do not contain a capital city, Ballarat was the tenth-largest. The nine larger urban areas ranged from Gold Coast - Tweed Heads, at 761,634, to Toowoomba, at 153,781. They also included Newcastle - Maitland, the Sunshine Coast, the Central Coast, Wollongong, Geelong, Townsville and Cairns1.
Growth in 2024-25 among the 20 urban areas with at least 100,000 people ranged from 0.15 per cent in Hobart to 2.40 per cent in Perth. The five faster-growing urban areas were Perth, Brisbane at 2.08 per cent, Geelong at 2.06 per cent, Melbourne at 1.97 per cent and the Sunshine Coast at 1.92 per cent. Darwin recorded the same rate as Ballarat when rounded to two decimal places1. Among the 12 urban areas of that size without a capital city, only Geelong and the Sunshine Coast grew faster than Ballarat.
| Australia's 12 largest urban areas without a capital city, as at 30 June 2025 | |||
|---|---|---|---|
| Urban area (SUA) | Population | Change over 2024-25 | Growth rate % |
| Gold Coast - Tweed Heads | 761,634 | +12,279 | 1.64 |
| Newcastle - Maitland | 541,634 | +6,953 | 1.30 |
| Sunshine Coast | 424,741 | +8,018 | 1.92 |
| Central Coast | 354,189 | +2,401 | 0.68 |
| Wollongong | 322,343 | +3,642 | 1.14 |
| Geelong | 314,381 | +6,360 | 2.06 |
| Townsville | 190,551 | +1,752 | 0.93 |
| Cairns | 164,149 | +1,404 | 0.86 |
| Toowoomba | 153,781 | +1,943 | 1.28 |
| Ballarat | 120,939 | +2,098 | 1.77 |
| Bendigo | 106,493 | +883 | 0.84 |
| Albury - Wodonga | 102,435 | +1,183 | 1.17 |
Source · ABS Population estimates by LGA, Significant Urban Area, Remoteness Area and electoral division, 2001 to 2025, Table 2
Section 07 · The long run
How has Ballarat's population changed since 2001?
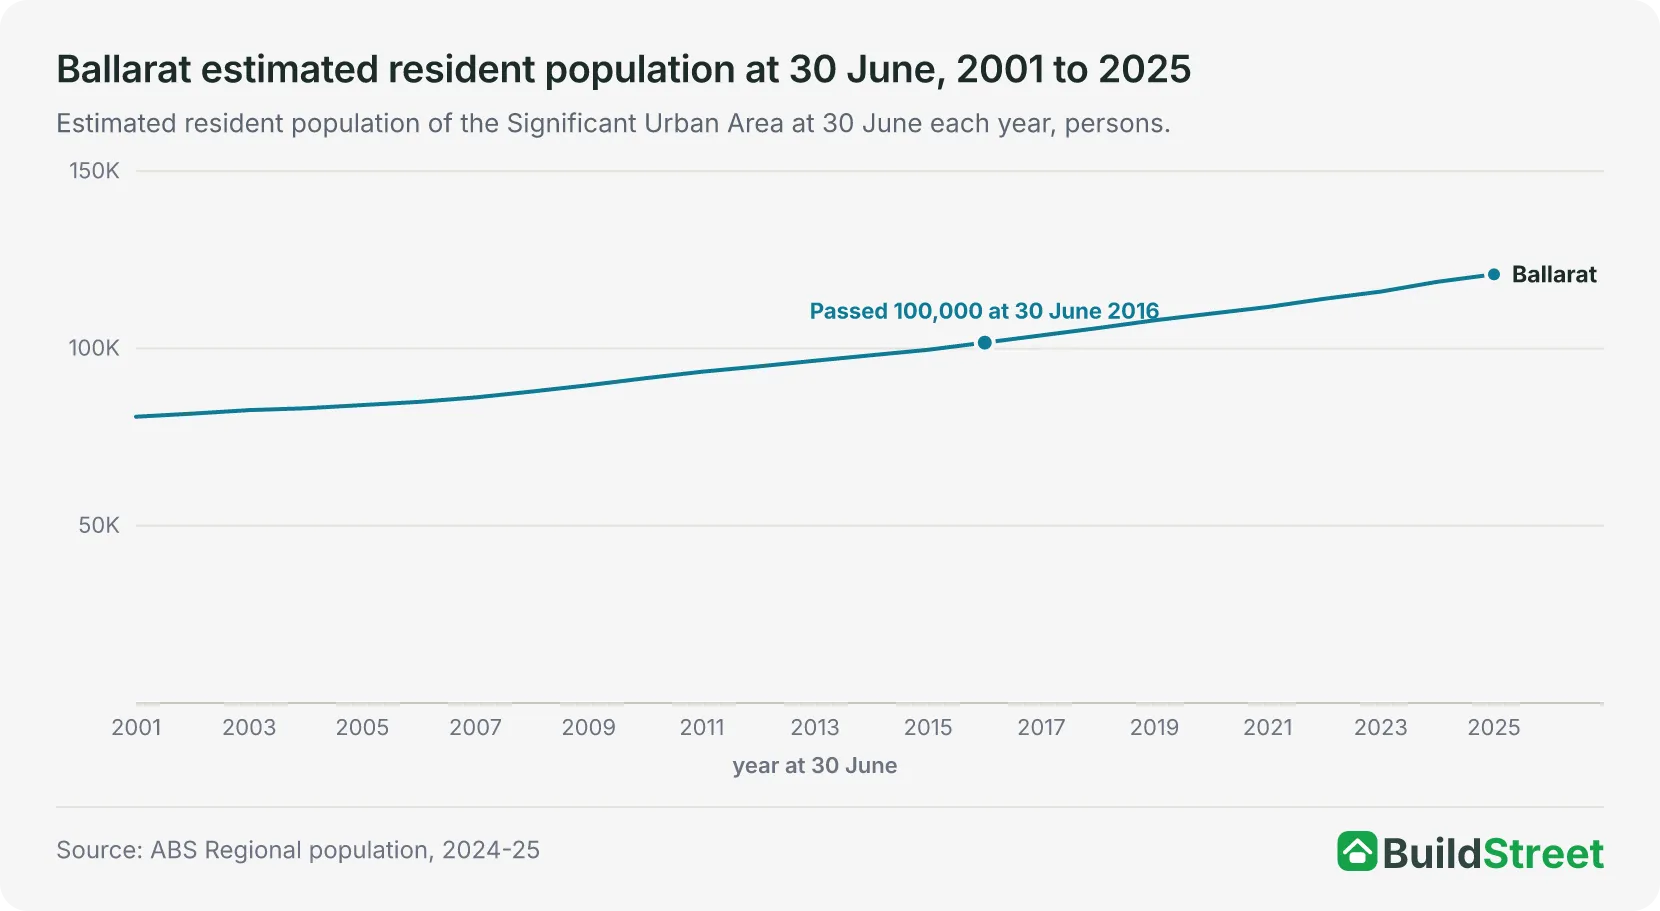
The urban area added 40,165 people between 30 June 2001 and 30 June 2025, growing from 80,774 to 120,939. The 2025 population was 1.50 times the population at 30 June 2001, equivalent to growth of 49.7 per cent.
Ballarat first exceeded 90,000 people at 30 June 2010, 100,000 at 30 June 2016, 110,000 at 30 June 2021 and 120,000 at 30 June 20251. The time between milestones shortened from six to five and then four. Each milestone is the first 30 June at which the estimated resident population was at or above the threshold.
The City of Ballarat first exceeded 100,000 residents at 30 June 2015, one year before the urban area. It first exceeded 120,000 at 30 June 2024, when its population reached 120,559. The City of Ballarat grew from 82,333 at 30 June 2001 to 122,661 at 30 June 20251.
| Ballarat urban area population milestones, 30 June 2001 to 2025 | ||
|---|---|---|
| Milestone | First 30 June at or above | Population that year |
| 90,000 | 30 June 2010 | 91,635 |
| 100,000 | 30 June 2016 | 101,678 |
| 110,000 | 30 June 2021 | 111,724 |
| 120,000 | 30 June 2025 | 120,939 |
Source · ABS Population estimates by LGA, Significant Urban Area, Remoteness Area and electoral division, 2001 to 2025, Table 2
Section 08
Ballarat population: quick answers
How many people live in Ballarat?
The Ballarat Significant Urban Area had an estimated resident population of 120,939 at 30 June 2025. That was the third-largest population of the 21 urban areas in Victoria, behind Melbourne and Geelong, and the 18th-largest in Australia. The 30 June 2025 estimate is preliminary. The next release, covering 30 June 2026, is due on 25 March 2027.
Is Ballarat bigger than Bendigo?
Ballarat's urban area had more residents than Bendigo's in every year from 2001 to 2025. At 30 June 2025, the Ballarat urban area had 120,939 people and Bendigo had 106,493, a gap of 14,446. The gap was 4,462 at 30 June 2001 and widened in each of the ten years from 30 June 2015 to 30 June 2025. Over 2024-25, Ballarat grew by 1.77 per cent and Bendigo 0.84 per cent.
How fast is Ballarat's population growing?
The Ballarat urban area grew by 2,098 people, or 1.77 per cent, in 2024-25. The population increased in every year from 2001-02 to 2024-25, and growth peaked at 2,767 people, or 2.38 per cent, in 2023-24. The 2024-25 rate was the same as Victoria's 1.77 per cent when rounded to two decimal places, and five of Australia's 20 urban areas with at least 100,000 people grew faster.
What is the difference between the Ballarat urban area and the City of Ballarat?
The Ballarat urban area is a Significant Urban Area, an ABS statistical boundary built from local areas (SA2) to cover the connected urban centre, and it had 120,939 people at 30 June 2025. The City of Ballarat is a local government area, a different boundary, and it had 122,661 people on the same date, 1,722 more than the urban area. ABS figures for the two boundaries are not interchangeable.
When did Ballarat pass 100,000 people?
The Ballarat urban area first exceeded 100,000 people at 30 June 2016, when the ABS estimate was 101,678. On the same basis, the urban area first exceeded 90,000 at 30 June 2010, 110,000 at 30 June 2021 and 120,000 at 30 June 2025, when it reached 120,939. For the City of Ballarat council area, the population first exceeded 100,000 residents at 30 June 2015 and 120,000 at 30 June 2024.
Section 09
Australia population statistics
- Alice Springs population
- Australia population
- Bendigo population
- Brisbane population
- Byron Bay population
- Cairns population
- Darwin population
- Gold Coast population
- Melbourne population
- Perth population
- Sunshine Coast population
- Sydney population
- Toowoomba population
- Western Australia population
- Wollongong population
References
- ABS Regional population, 2024-25: population estimates by LGA and Significant Urban Area, 2001 to 2025 (datacube 32180DS0004) · Australian Bureau of Statistics ↑ b c d e f g h i j k
- ABS Regional population, 2024-25: population estimates by SA2 and above, 2001 to 2025 (datacube 32180DS0003) · Australian Bureau of Statistics ↑ b c d e
- ABS Regional population, 2024-25 · Australian Bureau of Statistics ↑
- ABS Regional population methodology, 2024-25 · Australian Bureau of Statistics ↑
- ABS Regional population, 2024-25: population estimates and components by LGA, 2024 to 2025 (datacube 32180DS0002) · Australian Bureau of Statistics ↑ b c
- ABS Regional population, 2024-25: population estimates and components by SA2, 2024 to 2025 (datacube 32180DS0001) · Australian Bureau of Statistics ↑ b
- ABS Regional population, 2024-25: population components by LGA, 2021-22 to 2024-25 (datacube 32180DS0006) · Australian Bureau of Statistics ↑
