

Published 24 July 2026
Australia's average household size was 2.5 people in the 2021 Census, down from 2.6 in 2016 after remaining at 2.6 across the previous four Censuses. The RBA's survey-based measure recorded a historic low of 2.48 in August 2022 and 2.49 in January 2023. An e61 Institute extension implies an average of about 2.51 people per household at the end of 2024.
Smaller households mean more dwellings are needed to house the same population. No official observed figure is available for 2026, and the next Census is not expected to provide one until 2027. Until then, the Census, RBA, e61 and ABS projection figures provide the main indicators, but they use different methods and are not directly comparable.
 Migration and housing demand across Australia's capital citiesNet overseas migration added 302,184 people to Australia's population in 2024–25, accounting for 72.5% of the country's total population growth that year. The eight capital cities received 258,100 peo…
 What is driving housing demand in Australia in 2026? Population, migration and household formationNew household formation in Australia is projected to exceed net new housing supply by 24,000 dwellings in 2025–26, down from a 78,000-dwelling gap two years earlier, according to the National Housing…
Section 01 · Current snapshot
What is Australia's current average household size?
Australia's latest household-size indicators include 2.5 people in the 2021 Census, 2.49 in the RBA's January 2023 measure, an e61-derived figure of about 2.51 at the end of 2024 and an ABS projection-derived figure of about 2.58 for June 2026.
Each figure is produced using a different method, so they should not be treated as interchangeable.
Census count · last direct measurement
2.5 people — The most recent figure Australia has actually measured, from the 2021 Census. It counts everyone usually resident in occupied private dwellings and excludes visitors and non-private dwellings such as aged care and student accommodation.
Source: ABS, 2021 Census All persons QuickStats. Official · observed, 2021
RBA survey-based measure
2.49 people — The latest exact monthly value stated in the RBA's March 2023 article, as at January 2023. A May 2024 RBA update indicated household size had since stabilised, but did not state a newer exact figure in the accompanying text. This is the RBA's own figure, not an extension by another body.
Source: RBA Bulletin, "A new measure of average household size," March 2023. Official · survey-based, Jan 2023
e61 extension of the RBA method
About 2.51 people — e61 Institute publishes component values of 1.92 adults and 0.59 children per household, as at the end of 2024. These published components sum to an implied average household size of about 2.51. This figure is derived from e61's published data rather than reported as a standalone headline measure.
Source: e61 Institute, May 2025. Derived from published e61 component values
Implied by ABS projections
About 2.58 people — Dividing the population total used in the ABS Household and Family Projections for 30 June 2026, 27,798,500, by the matching projected number of households, 10,787,602 under Series II, implies this figure. It is a calculation, not a figure the ABS has published directly.
Source: Calculated from ABS Household and Family Projections, 2021–2046. Derived, not an ABS headline figure
Key dates in Australia's household size data, 2021 to 2027
These are the key moments behind the numbers above, from the last Census to the next one.
10 August 2021
2021 Census night
About two million more people (2,178,094) were recorded at home than on the equivalent 2016 Census night. This reflects where people were physically located during lockdown restrictions, not a direct measure of household size.
June 2022
First 2021 Census results released
Average household size recorded at 2.5, down from 2.6 in 2016.
March 2023
RBA publishes a new monthly household size measure
Built from Labour Force Survey microdata back to July 1983, showing household size had fallen to a historic low of 2.48 by August 2022.
28 June 2024
ABS releases Household and Family Projections, 2021 to 2046
Projects total households rising from 9,993,880 in 2021 to 10,787,602 in 2026 under the middle (Series II) scenario.
May 2025
e61 Institute extends the RBA measure
Breaks household size into adults and children per household, tracking both through to the end of 2024.
11 August 2026
Next Census night
The nineteenth national Census of Population and Housing. First results are expected to be released progressively from June 2027.
Source · ABS, 2021 and 2026 Census releases; ABS Household and Family Projections, 2021–2046; RBA Bulletin, March 2023; e61 Institute, May 2025.
Section 02 · Long-run trend
How Australia's average household size has changed since the 1980s
Average household size fell from 2.9 in 1986 to 2.5 at the 2021 Census, a decline of roughly 14% over 35 years. The decline was not steady: household size fell sharply through the late 1980s and 1990s, while the published Census figure rounded to 2.6 from 1996 through 2016. The RBA's higher-frequency measure then recorded a renewed decline, reaching 2.48 in August 2022.
Census counts capture five-yearly snapshots. The figures used in this article span 1986 to 2021, though the standard ABS household projections series used for most of this analysis begins its base year at 1996. A more frequent measure, built from monthly labour force data, fills in the years between and shows the same overall shape, plus the detail Census misses.
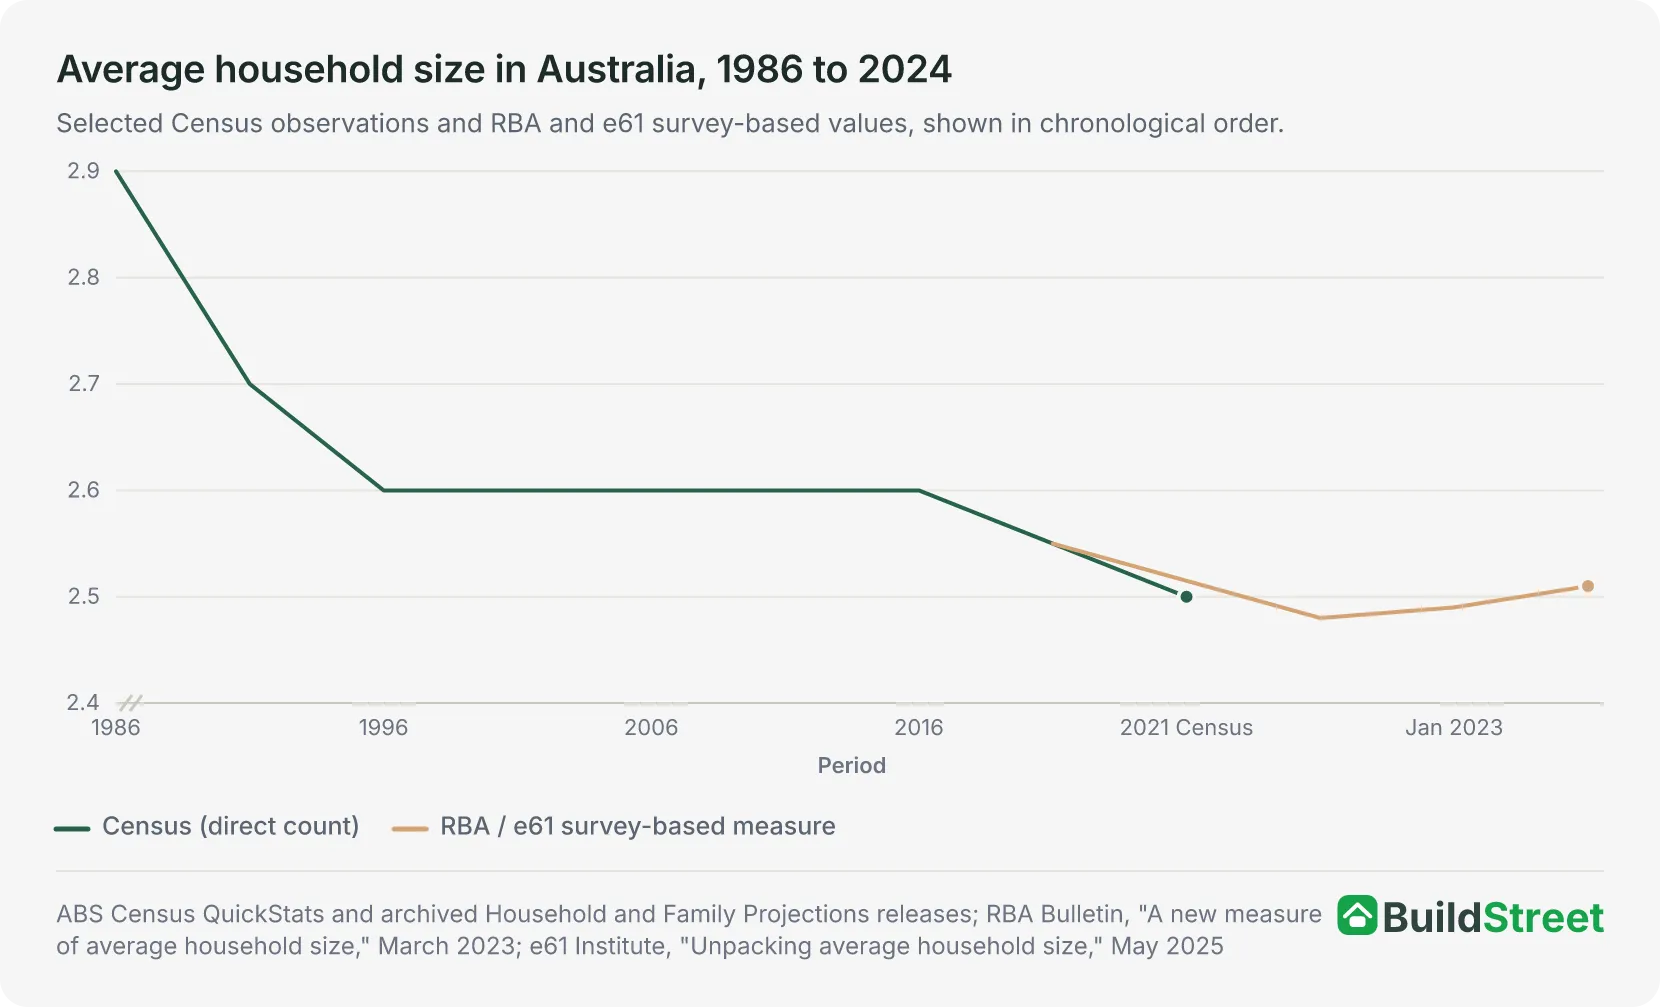
The long-run decline is consistent with population ageing, lower fertility and growth in smaller household types. The RBA describes household size as relatively flat from the early 2000s to the mid-2010s, although the sources used here do not quantify the contribution of each demographic or housing-market factor to that plateau. The renewed fall in the 2020s is examined in more detail in the pandemic section below.
Section 03 · Why it matters
Why smaller households mean Australia needs more homes
Smaller households increase housing demand because more dwellings are needed to house the same population.
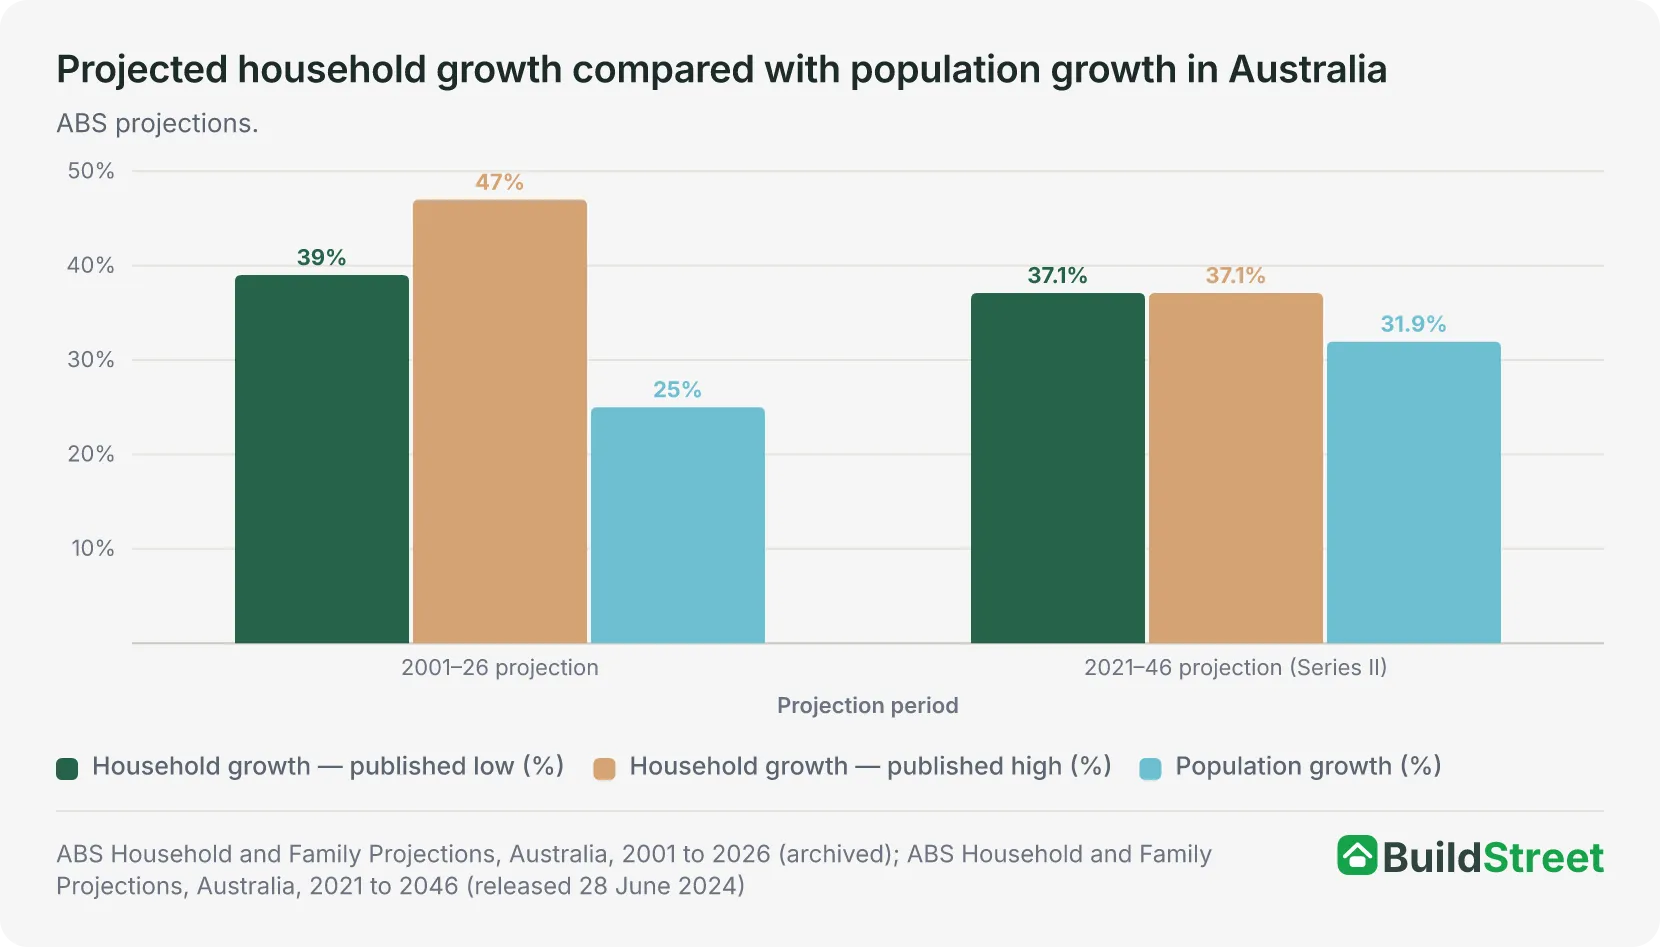
Households are projected to grow by about 37% between 2021 and 2046, against about 32% population growth over the same period, based on the ABS's own published totals. An earlier projection showed an even wider gap: households were projected to grow by 39% to 47% between 2001 and 2026, against 25% population growth. Both gaps exist for the same reason: when household size falls, the same number of people needs more separate dwellings to house them.
The 2021-to-2046 figures come from households rising from 9,993,880 to 13,704,641 under the middle scenario (released June 2024), against population growing from 25.7 million to 33.9 million. The older 2001-to-2026 figures come from households rising from 7.4 million to between 10.2 and 10.8 million (released 2004). That 2004 projection also expected household size to keep falling, to between 2.2 and 2.3 by 2026. The 2021 Census recorded 2.5, well above that path, a reminder that these projections describe a scenario rather than a guaranteed outcome.
NHSAC's 2026 report estimates underlying demand of about 196,000 new households in 2024–25 and 182,000 in 2025–26, easing to about 176,000 in 2026–27 and roughly 175,000 households a year thereafter. The estimates combine population, age and geographic projections with historical household-formation patterns.
National Housing Supply and Affordability Council, State of the Housing System 2025 and 2026
Section 04 · State and territory patterns
Average household size by state and territory in Australia
The Northern Territory has Australia's largest average household size at 2.8 people, compared with 2.4 in South Australia and Tasmania, the lowest figures in the country.
New South Wales sits at 2.6, while Victoria, Queensland, Western Australia and the ACT are all at the national figure of 2.5.
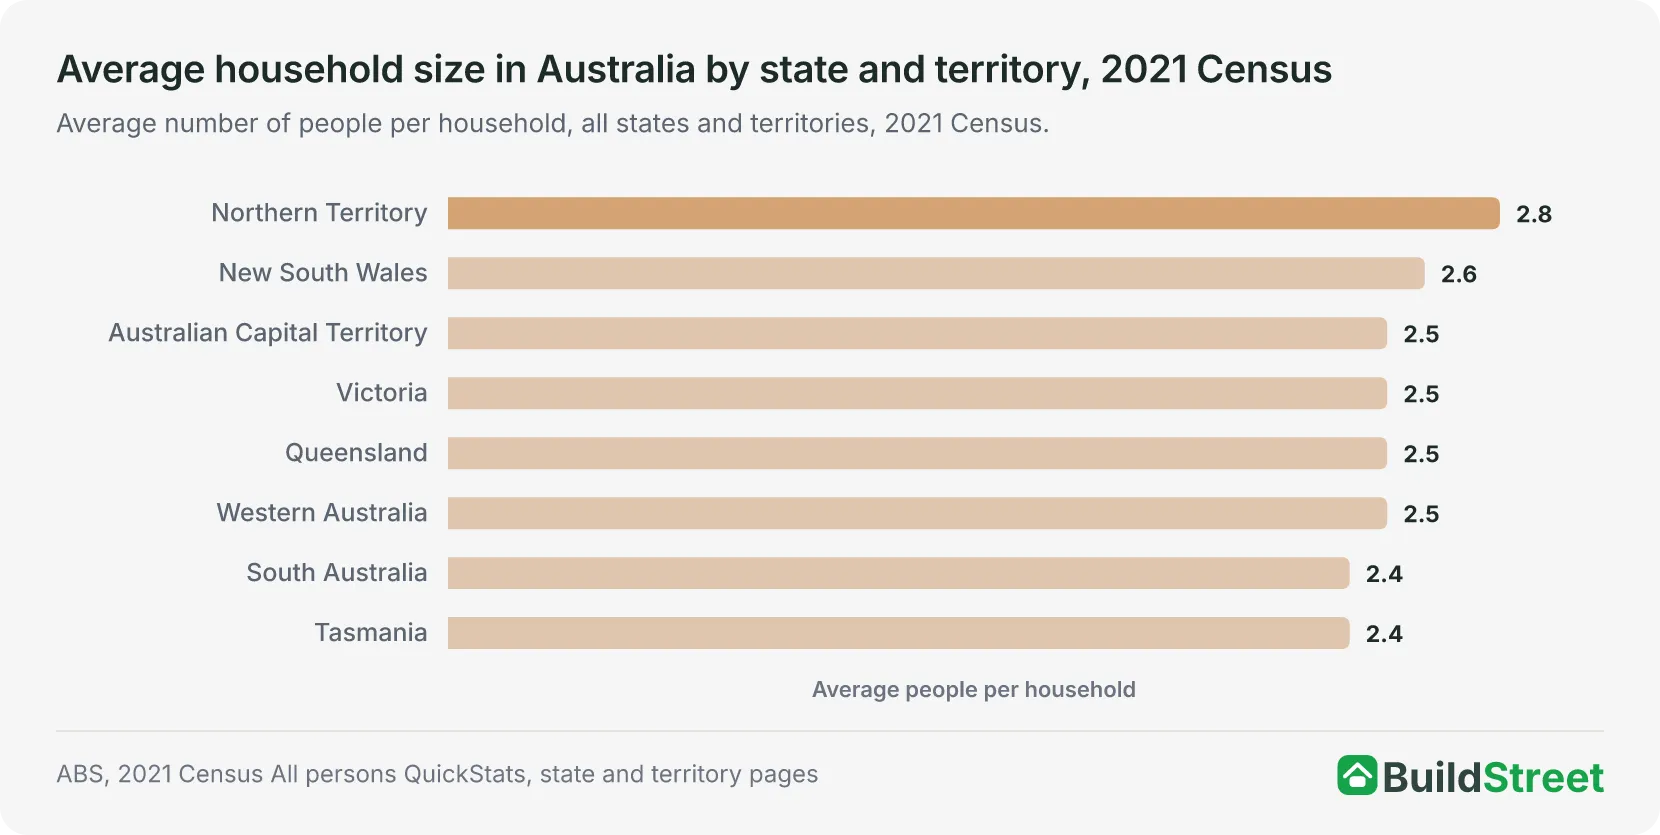
Household composition and population age profiles differ between states and territories and may contribute to differences in average household size. Tasmania has Australia's oldest population and a high share of couples without children, while the Northern Territory has the youngest population and a lower share of people living alone. However, the Census figures do not show how much each factor contributes to the gap.
Sydney and Melbourne recorded much of the pandemic-era decline in household size, with both remaining close to historic lows in the RBA estimates through January 2023, the latest published reading for individual capital cities. Brisbane and some regional areas recorded smaller declines or periods of stability. The RBA published estimates for Australia, regional areas and all eight capital cities, but did not publish a separate open monthly series for each state and territory.
Section 05 · Household composition
The rise of single-person households in Australia
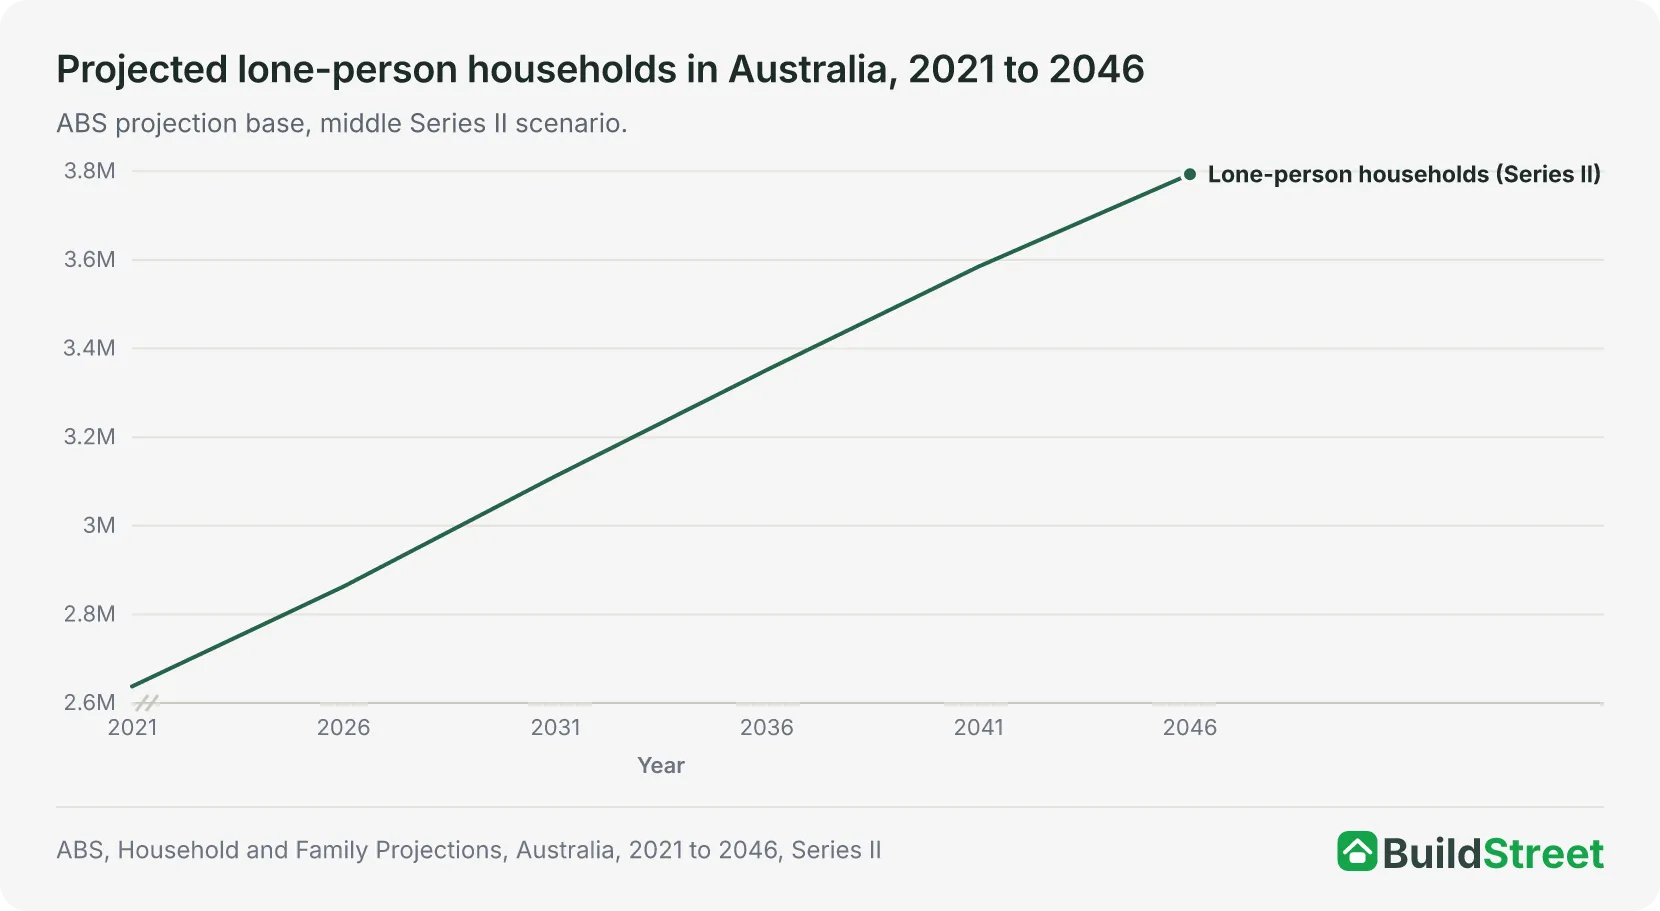
Lone-person households reached 2,370,742 at the 2021 Census, representing 25.6% of occupied private dwellings, up from 2,023,542 and 24.4% in 2016. That is an increase of 347,200 lone-person households in a single five-year Census cycle, a rise of 17.2%, well ahead of Australia's 8.6% population growth over the same period.
A separate ABS projections series estimates 2,637,520 lone-person households in 2021 because it uses estimated resident population data rather than raw Census counts. The two figures use different bases and are not directly comparable. On the projections basis, lone-person households are expected to reach between 3.4 million and 4.0 million by 2046 and account for 26% to 28% of all households, compared with 26% in 2021.
The share of people aged 15 and over living alone rose by 1.8 percentage points, from 8.2% in 1985 to 10.0% in 1995. Separately, the number of lone-person households rose by 17.2% between 2016 and 2021.
Section 06 · Pandemic effect
How the pandemic changed average household size in Australia
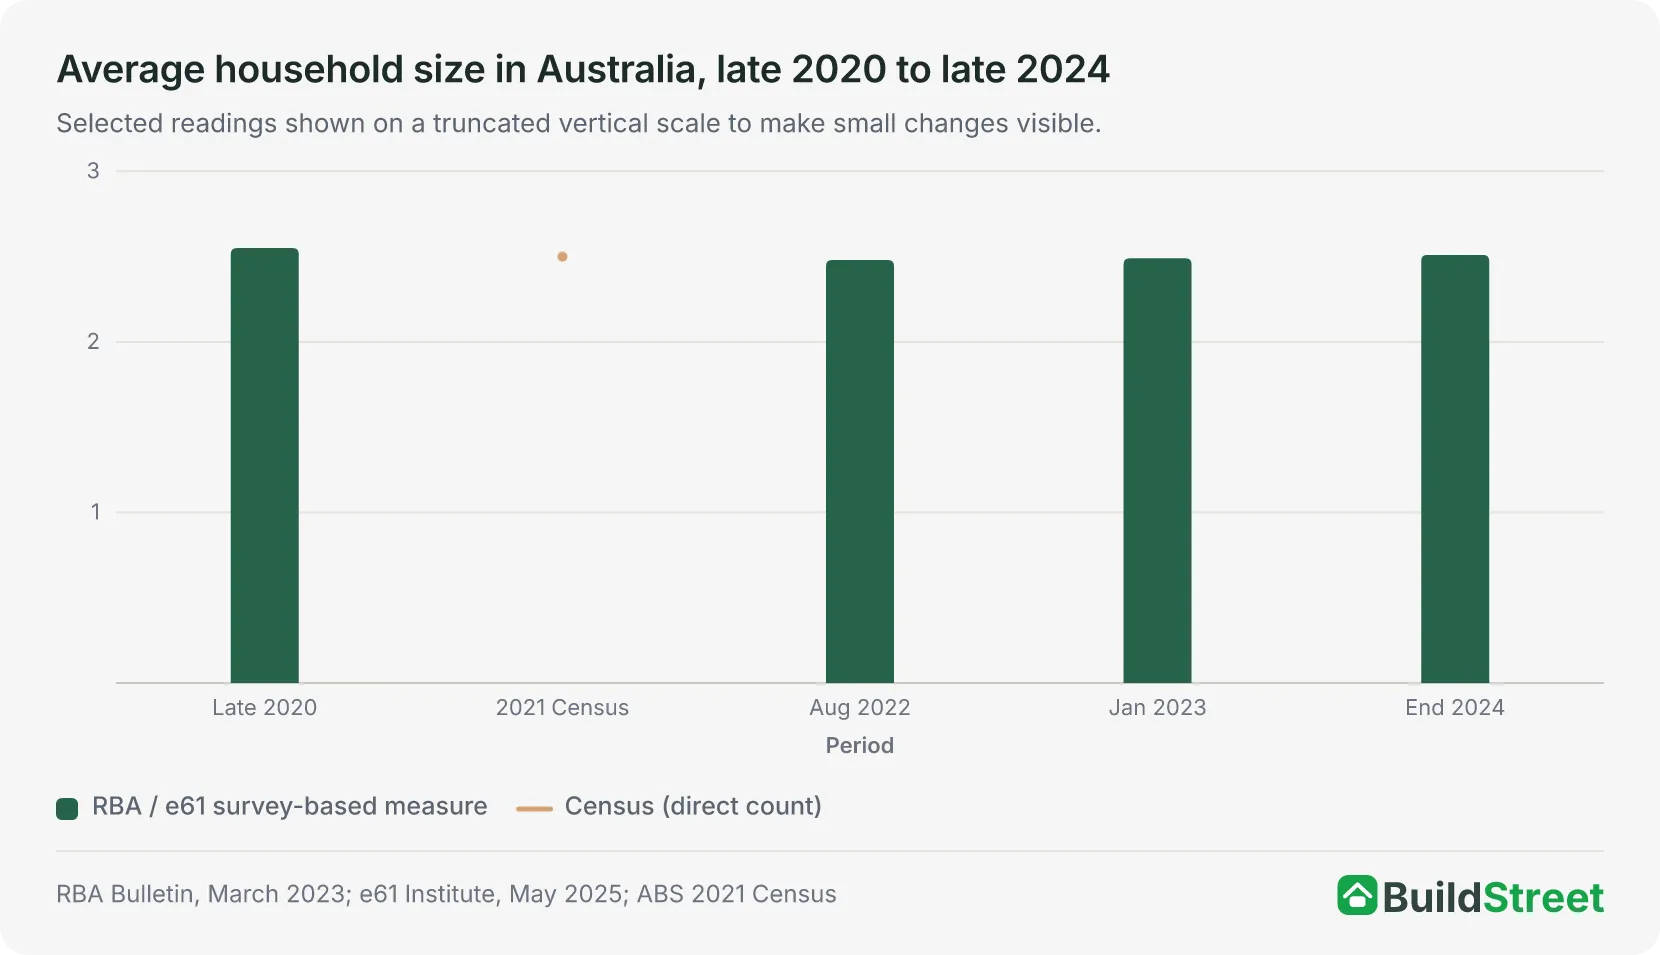
Household size did not fall in a straight line through the pandemic. It rose about 2% between February and September 2020, then reversed hard, falling from 2.55 to a historic low of 2.48 by August 2022.
By the end of 2024, e61 Institute data showed 1.92 adults and 0.59 children per household. These rounded components sum to about 2.51, but this is not a directly published household-size reading.
The change from 2.6 in the 2016 Census to 2.5 in 2021 captures only part of that swing. About two million more people were recorded at home on Census night 2021 than in 2016, but that figure describes where people were physically located under lockdown restrictions, not the usual-residence basis used to calculate average household size. It provides context for the conditions under which the 2021 Census was conducted, rather than direct evidence of the change in household size.
The increase in 2020 was partly associated with young adults moving back in with family. The share of 18-to-30-year-olds living with their parents climbed 5 percentage points to a historical high during the lockdown period. From late 2020 to 2022, average household size fell during a period of lower rents, stronger income growth and changing preferences for space. The data does not isolate how much each factor contributed. Household size then appeared to increase slightly after late 2022 as rental markets tightened.
Sydney and Melbourne drove most of this cycle. Both cities had longer, more stringent lockdowns and were more exposed to the loss of overseas migration during border closures, producing weaker rental markets, higher vacancy rates and lower advertised rents through 2020, before tightening sharply as household size fell again from 2021.
The cited sources do not show exactly how much of the 2016-to-2021 Census decline was caused by the pandemic and how much reflected the longer-term downward trend already under way before 2020.
Section 07 · Household demand
What a 0.1 change in household size means for the number of households
At Australia's estimated population on 31 December 2025, a fall in average household size from 2.6 to 2.5 would mathematically imply about 428,000 additional households. A further fall to 2.4 would imply about 463,000 more. These are illustrative calculations, not forecasts of dwelling construction or total housing demand.
Using Australia's population of 27,801,023 at 31 December 2025, the numbers work out to:
- At 2.6 people per household: about 10,692,701 households.
- At 2.5 people per household: about 11,120,409 households, or 427,708 more than at 2.6.
- At 2.4 people per household: about 11,583,760 households, or a further 463,350 more than at 2.5.
Other estimates reach a similar conclusion at a different scale, though they use different assumptions and should not be treated as directly comparable. The National Housing Supply Council found that a 0.02 difference between its modelled 2011 household size and the raw 2011 Census figure equated to around 150,000 households for that year's population. This was a specific reconciliation between two estimates, not a general rule for converting changes in household size into household numbers.
Separately, the RBA estimated that if household size returned to the 2.8 benchmark used in its May 2024 speech, about 1.2 million fewer dwellings would be needed to house a population of just under 27 million.
References
- ABS 2021 Census of Population and Housing, All persons QuickStats · Australian Bureau of Statistics
- ABS, 2021 Census All persons QuickStats — state and territory pages · Australian Bureau of Statistics
- ABS: Household and Family Projections, 2021 to 2046 · Australian Bureau of Statistics
- ABS, Household and Family Projections, Australia, 1996 to 2021 (archived) · Australian Bureau of Statistics
- ABS, Household and Family Projections, Australia, 2001 to 2026 (archived) · Australian Bureau of Statistics
- ABS, Population Projections, Australia, 2022 (base) to 2071 · Australian Bureau of Statistics
- ABS, National, state and territory population (latest release) · Australian Bureau of Statistics
- ABS, Australian Social Trends 1996 — national summary tables · Australian Bureau of Statistics
- ABS, Two million more people at home on Census night — COVID-19 data insight · Australian Bureau of Statistics
- ABS, Less than 100 days to the 2026 Census · Australian Bureau of Statistics
- ABS, 2026 Census topics and data release plan · Australian Bureau of Statistics
- RBA Bulletin, A new measure of average household size, March 2023 · Reserve Bank of Australia
- RBA speech, Housing Market Cycles and Fundamentals, 16 May 2024 · Reserve Bank of Australia
- e61 Institute, Unpacking average household size, 23 May 2025 · e61.in
- The Treasury, Housing Supply and Affordability Issues 2012–13, Appendix 2 · treasury.gov.au
- NHSAC State of the Housing System 2026 · nhsac.gov.au
- NHSAC, State of the Housing System 2025 · nhsac.gov.au
