

Published 6 Aug 2026
New Zealand approved more new homes per person than Australia from 2020 to 2024. Its largest lead came in the year ended January 2023, when New Zealand consented 9.7 dwellings per 1,000 residents, compared with Australia's calculated rate of 7.27.
The two countries were approximately level in 2025, before Australia moved slightly ahead in 2026, with 6.99 approvals per 1,000 residents compared with New Zealand's provisional rate of 6.9.
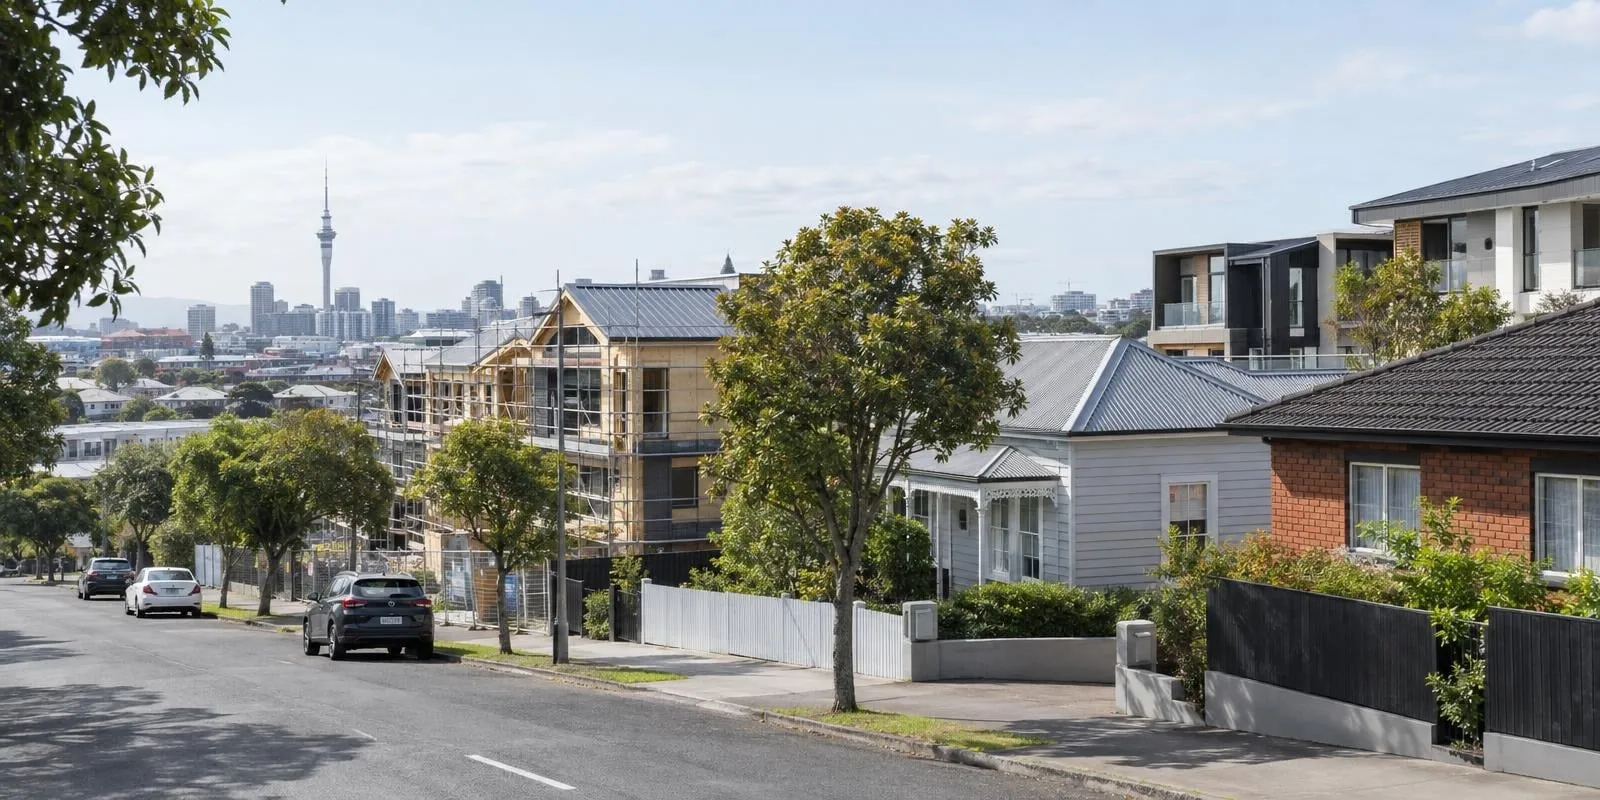
Auckland's experience provides one explanation for part of New Zealand's housing-consent growth. About 75% of the region's residential land was upzoned, and a 2025 University of Auckland working paper estimates that permits per person roughly doubled within five years.
 How many homes are built in Australia each year?Two distinct cycles have shaped Australia's housing output since 2010:
 How Australia's home building rate compares to other countries in 2026Australia builds more homes per person than Canada, the US and the UK. yet its completion rate has hit a 26-year low.
Section 01 · National rates
New Zealand and Australia home approval rates compared
New Zealand's consent rate first overtook Australia's calculated approval rate in 2020, at 7.5 dwellings per 1,000 residents compared with 6.89. Australia had recorded the higher rate in every year from 2002 to 2019.
New Zealand's lead reached 2.43 dwellings per 1,000 residents in the year ended January 2023. The gap then narrowed, with rates of 6.4 in New Zealand and 6.45 in Australia in 2025, followed by 6.9 and 6.99 respectively in 2026.
Australia was marginally ahead in 2026. New Zealand's published rate of 6.9 represents an unrounded result between 6.85 and just under 6.95, which remains below Australia's calculated rate of 6.99.
The two measures are compiled differently:
- New Zealand: published by Stats NZ, and divides dwelling consents by the estimated resident population.
- Australia: calculated for this article by adding up original monthly approvals from February through January, then dividing by the estimated resident population at the prior December.
These methods are closely aligned but not identical, so small differences should not be interpreted as evidence of a substantial lead.
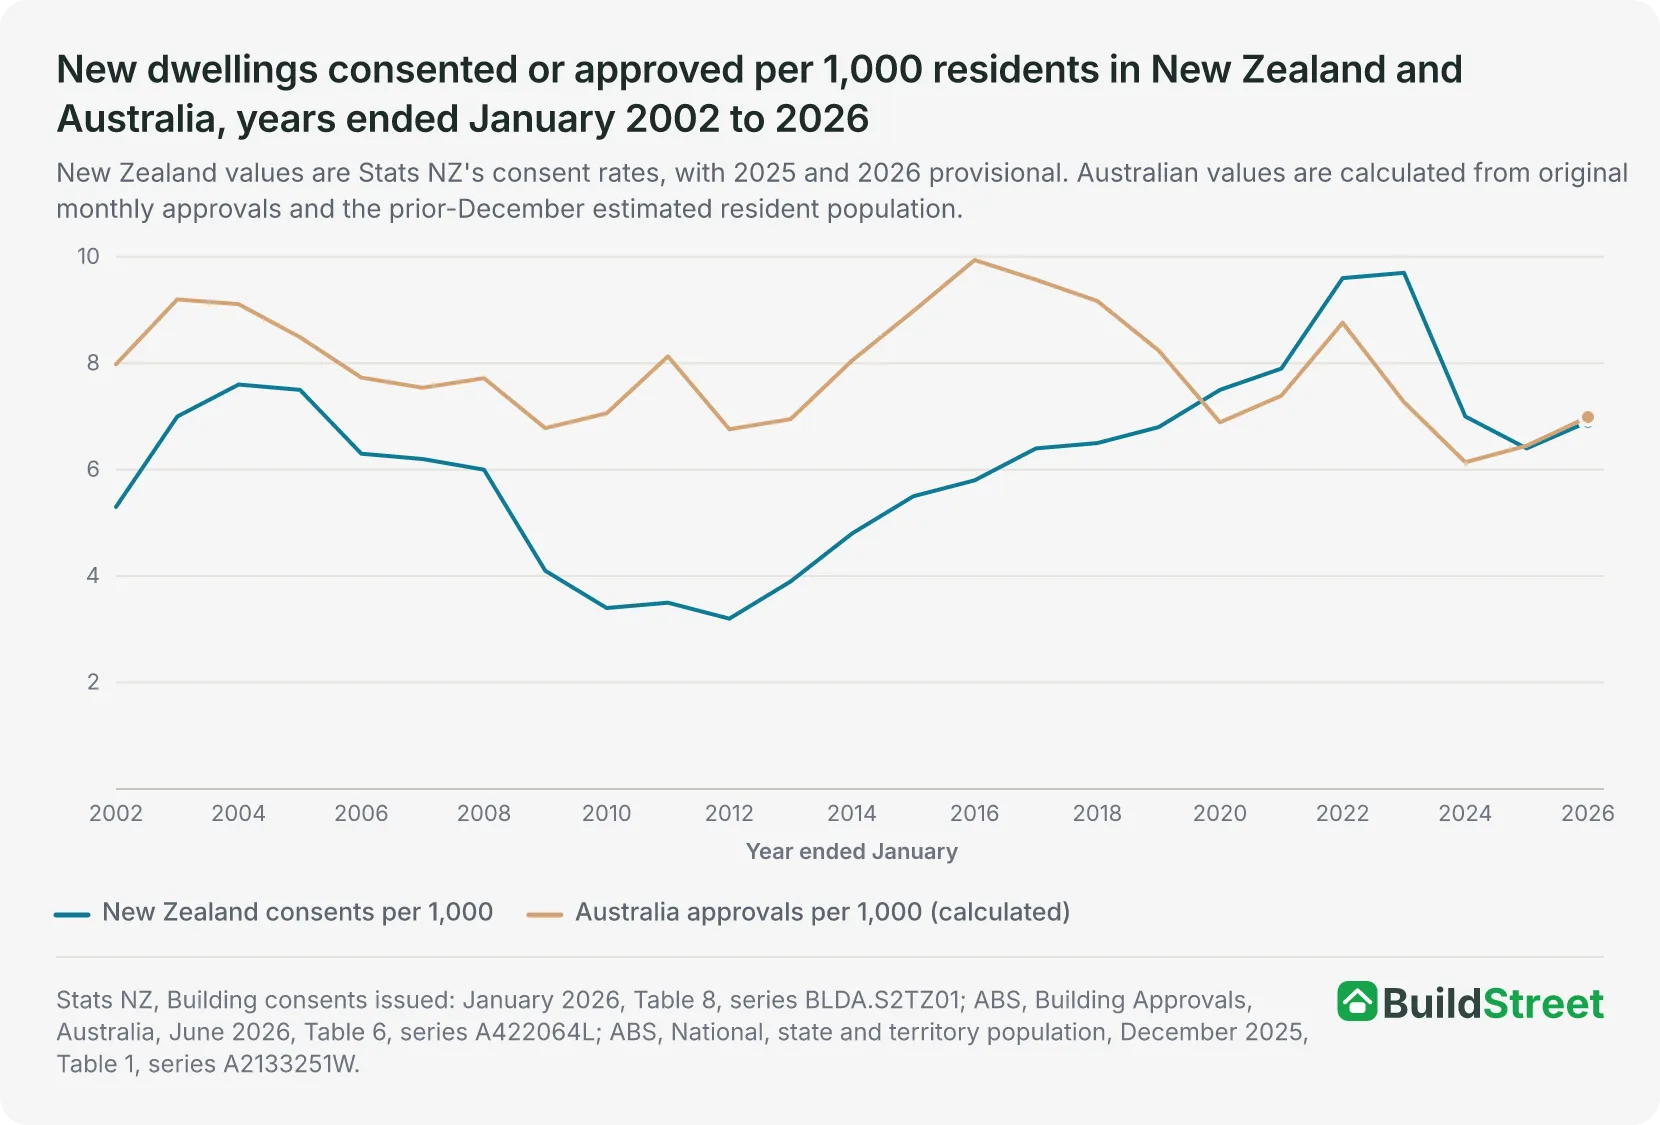
The two countries' approval cycles have not moved together. New Zealand's lowest rate was 3.2 dwellings per 1,000 residents in the year ended January 2012. Australia's highest rate was 9.94 in 2016, above New Zealand's 25-year peak of 9.7 in 2023.
The 2020 crossover reflected New Zealand's rate rising while Australia's fell from its 2016 peak. The rates converged again as New Zealand declined after 2023 and Australia recovered after 2024.
| New dwellings consented or approved per 1,000 residents in New Zealand and Australia, selected years ended January | ||||
|---|---|---|---|---|
| Year ended January | New Zealand (per 1,000) | Australia (per 1,000) | Difference | Higher rate |
| 2012 | 3.2 | 6.76 | −3.56 | Australia |
| 2016 | 5.8 | 9.94 | −4.14 | Australia |
| 2019 | 6.8 | 8.24 | −1.44 | Australia |
| 2020 | 7.5 | 6.89 | +0.61 | New Zealand |
| 2023 | 9.7 | 7.27 | +2.43 | New Zealand |
| 2024 | 7.0 | 6.14 | +0.86 | New Zealand |
| 2025 | 6.4 P | 6.45 | −0.05 | Approximately equal |
| 2026 | 6.9 P | 6.99 | −0.09 | Australia, marginally |
Source · Stats NZ, Building consents issued: January 2026, Table 8; ABS, Building Approvals, Australia, June 2026, Table 6; ABS, National, state and territory population, December 2025, Table 1.
Among the selected years, Australia's widest lead was 4.14 dwellings per 1,000 residents in 2016. New Zealand's widest lead was 2.43 in 2023.
The comparison shows two separate national housing cycles rather than a sustained divergence between the countries.
Section 02 · Recent movement
New Zealand's consent rate fell as Australia recovered
New Zealand's national consent rate peaked at 9.7 per 1,000 residents in the year ended January 2023. It fell to 7.0 in 2024 and 6.4 in 2025, a drop of 3.3 rate points in two years, then recovered to 6.9 in 2026. The 2025 and 2026 values are provisional.
Auckland followed a similar pattern, while Australia's decline and recovery occurred over a longer period.
Each figure is this article's calculation of the change between that series' own peak and trough years, which are not the same across the three. The measure is dwellings consented or approved per 1,000 residents, year ended January; the Australian rate is calculated from monthly approvals and the prior-December estimated resident population. Source: Stats NZ, Building consents issued: January 2026, Table 8; ABS, Building Approvals, Australia, June 2026, Table 6; ABS, National, state and territory population, December 2025, Table 1.
The countries' rates converged because New Zealand fell from a high point while Australia recovered from its 2024 low.
Auckland's decline coincided with rising interest rates and a national recession. A 2025 University of Auckland working paper records that permits fell between 2022 and 2023 but remained above their previous 2002 peak. Auckland Council dates the decline in new consents to late 2022, after the Official Cash Rate began rising in October 2021.
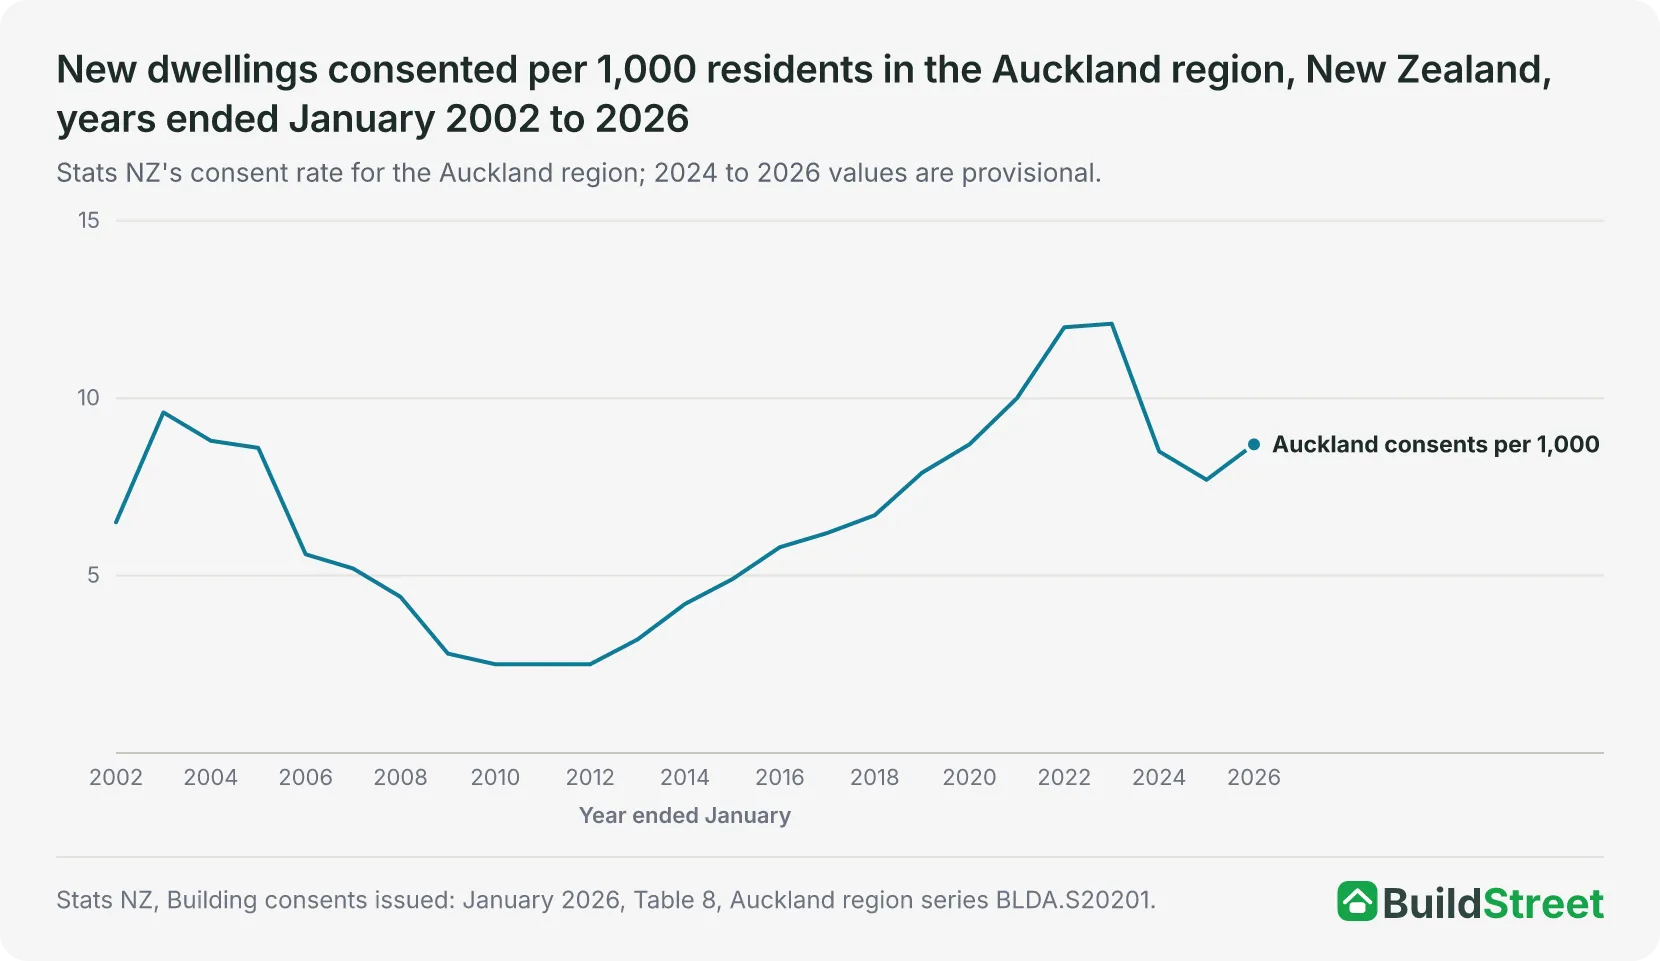
Auckland's 2026 rate of 8.7 per 1,000 is above the national rate of 6.9, and above every Auckland reading between 2006 and 2018.
The region's lowest rate was 2.5 per 1,000 in the years ended January 2010, 2011 and 2012. It rose to 12.1 by 2023.
Later planning changes occurred after the consent rate had already started falling. The Medium Density Residential Standards were removed from Auckland sites in October 2025, almost three years after the decline began.
Section 03 · Auckland zoning
How the Auckland Unitary Plan changed residential zoning
About 75% of Auckland's residential land was upzoned to medium or high density when the Auckland Unitary Plan took effect in November 2016. Before the reform, 95% of the city's residential land was zoned for low-density housing.
Source: Greenaway-McGrevy, University of Auckland Economic Policy Centre, Working Paper 017, September 2025, for the upzoned share; Australian Productivity Commission, Housing supply regulation: Interim report, July 2026, Box 1.3, for the pre-reform low-density share.
The reform covered most of Auckland's residential market rather than selected sites or small areas. The level of upzoning varied across the region and reflected long-term growth plans, infrastructure capacity and access to transport. Areas near existing transport were more likely to receive higher-density terrace zoning.
The plan followed the 2010 amalgamation of Auckland's seven district and city councils into a single Auckland Council. The council proposed the new medium- and high-density zones in 2013.
Section 04 · Auckland pipeline
Auckland dwelling permits, construction starts and completions
Auckland issued about 9,200 new dwelling permits in 2015, the year before the Auckland Unitary Plan became operational, and 21,000 by 2022. Per 1,000 residents, the rate rose from 5.95 to 12.57, an increase of 111.3% based on the two published figures.
This increase includes all changes over the period, not only the effect of the planning reform. A 2025 University of Auckland working paper used a synthetic-control model to estimate what Auckland's permit rate might have been without the reform.
The model combined other New Zealand areas into a weighted comparison that closely tracked Auckland before 2016. It estimates that upzoning roughly doubled new dwelling permits per person within five years. Between 2017 and 2023, about 52,200 of Auckland's 112,300 permits, or 46%, were estimated to be above the no-reform counterfactual.
These figures are modelled estimates and depend on the assumption that the comparison areas represent what would have happened in Auckland without the reform.
Auckland issued 95,300 Code Compliance Certificates for new homes between 2018 and 2024, the sum of seven annual figures. These certificates measure completed homes, while the causal research above measures permits.
The 95,300 total counts homes completed during the period, regardless of when they were consented. Homes completed in 2018 may have been consented earlier, while some homes consented near the end of the period were completed after 2024. The completion total therefore cannot be directly compared with permits issued over the same years.
On a cohort-matched basis, cumulative completion rates range from 66% to 80% after two years and from 90% to 92% after four years. Annual completions increased from 10,200 in 2018 to 18,100 in 2023, then eased to 17,200 in 2024.
The 95,300 figure is descriptive and does not show how many completions were caused by the Auckland Unitary Plan. After accounting for an estimated demolition rate of one in nine homes between 2018 and 2022, about 89% of new homes were estimated to have added to Auckland's housing stock.
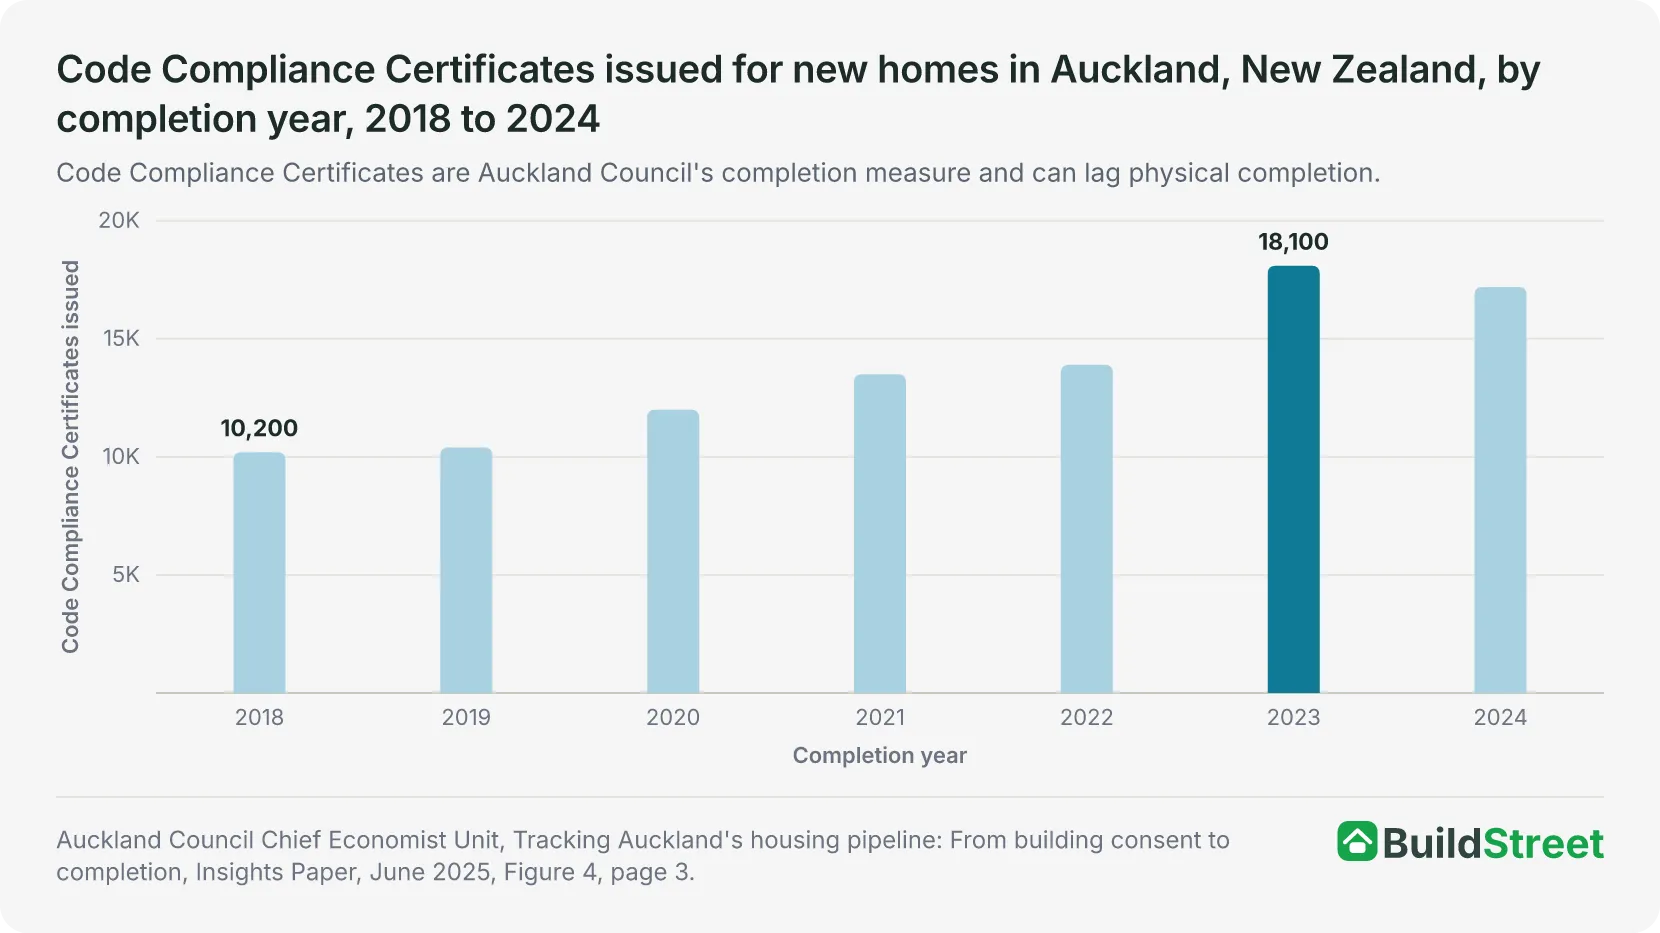
Auckland's consent rate and Code Compliance Certificates both peaked in 2023, although they cover different periods and cannot be used to measure a fixed time lag. Completions also varied less than consents because they reflect projects approved and started in earlier years.
Between consent and completion sits the decision to start, tracked via a project's first inspection. Among homes consented in 2018, 86% had started within one year, compared with 70% of those consented in 2022.
Auckland Council attributes the slower starts first to construction-industry capacity relative to the number of consented projects, and later to rising interest rates.
| Share of consented residential projects that had started construction in Auckland, New Zealand, by year of consent | ||||
|---|---|---|---|---|
| Year consented | Within 30 days (%) | Within 180 days (%) | Within 1 year (%) | Within 2 years (%) |
| 2018 | 28 | 74 | 86 | 90 |
| 2019 | 31 | 71 | 85 | 91 |
| 2020 | 25 | 73 | 85 | 88 |
| 2021 | 21 | 68 | 80 | 84 |
| 2022 | 16 | 54 | 70 | 79 |
| 2023 | 17 | 50 | 62 | 68 |
Source · Auckland Council Chief Economist Unit, Tracking Auckland's housing pipeline, June 2025, Table 1, page 2.
The two-year start rate declined from 90% for the 2018 cohort to 79% for the 2022 cohort. This suggests that some of the difference between cohorts reflects slower starts rather than projects being abandoned.
Median completion time also increased, from 280 days in 2019 to 470 days in 2023, before easing to 400 days in the December quarter of 2024.
Section 05 · Auckland housing costs
What happened to Auckland rents after upzoning?
A 2024 University of Auckland working paper estimates that Auckland rents in 2022 were 21.6% below a modelled no-reform level. The estimate uses a synthetic-control method and a characteristics-adjusted rent index based on Stats NZ's Integrated Data Infrastructure. The paper states that the findings are not official statistics.
This is the preferred specification, which excludes Rotorua from the comparison group; including it gives a larger effect of 26.1% below the counterfactual, and the authors describe the smaller, Rotorua-excluded figure as the conservative choice.
The strength of the statistical result varies across the paper's tests. Auckland ranked first in the preferred placebo comparison but twelfth under a stricter one-tailed test.
The Australian Productivity Commission's July 2026 interim report cites a 2026 update estimating rents 23% lower than the counterfactual eight years after the reform.
Individual development sites can also move differently from city-wide housing costs.
A 2018 University of Auckland study of Auckland residential transactions found a redevelopment premium of about 22.2% for a property equivalent to vacant land, over the six years spanning the plan's announcement to 2017.
Development rights can increase the value of an underdeveloped site because more homes can be built on it. This is a site-level land-value effect, not a measure of city-wide house prices.
Estimated by the research
- Preferred-specification rent estimate, 2022
21.6% below counterfactual, equivalently 27.6% above actual
- Commission's cited 2026 update
23%
- Redevelopment premium, vacant-land-equivalent site
+22.2%
Not estimated by the research
- A fall in observed rents
Not measured
- A fall in observed house prices
Not measured
- A city-wide price index effect
Not measured
- An effect on completions
Not measured
Source · Greenaway-McGrevy and So, Can Zoning Reform Reduce Housing Costs? Evidence from Rents in Auckland, March 2024; Australian Productivity Commission, Housing supply regulation: Interim report, July 2026; Greenaway-McGrevy, Pacheco and Sorensen, Land Use Regulation, the Redevelopment Premium and House Prices, September 2018. The 21.6%, 23% and 22.2% figures are modelled estimates. The 27.6% figure is a restatement of the 21.6% estimate, not a separate result.
The right-hand column matters as much as the left. Four questions readers often ask of this research have no answer in it, because no study in these sources measures them.
The two columns are also on different footings. The left holds model estimates from three papers using different methods, periods and outcome measures. They cannot be added together or compared directly with each other.
Section 06 · Planning frameworks
Medium-density housing rules in New Zealand and Australia
Under New Zealand's Medium Density Residential Standards, which took effect in July 2022, up to three homes per site and three storeys were permitted without resource consent where all standards were met.
The standards came out of 2021 legislation and applied to tier 1 territorial authorities: greater Auckland, Hamilton, Tauranga, Wellington and Christchurch, with Rotorua added later.
The baseline standards allowed:
- a maximum of three units per site;
- a maximum height of 11 metres, plus one metre for a pitched roof;
- a maximum building coverage of 50% of the net site area;
- minimum setbacks of 1.5 metres at the front and one metre at the sides and rear; and
- a minimum outdoor living space for each unit.
Councils could vary these settings where defined qualifying matters applied.
Australia's National Planning Reform Blueprint was agreed by National Cabinet on 16 August 2023 and published by Treasury in August 2024. It sets out 10 measures.
Measure 5 commits planning ministers to streamlining approval pathways and prioritising planning control amendments that promote medium- and high-density housing in well-located areas close to public transport, amenities and employment.
States and territories implement the measures and report to National Cabinet twice yearly.
The two frameworks are not directly comparable. New Zealand introduced a national statutory baseline, while Australia's blueprint coordinates reforms led by individual states and territories and does not set a uniform national zoning standard.
New Zealand, MDRS baseline, July 2022
- Instrument
National statute
- Units permitted per site
3
- Storeys permitted
3
- Maximum height
11m + 1m
- Maximum site coverage
50%
- Resource consent required
No, if compliant
Australia, Blueprint, agreed August 2023
- Instrument
National Cabinet agreement
- Measures
10
- Uniform density standard
None
- Density direction
Well-located areas
- Implementation
State and territory
- Reporting
Twice yearly
Source · NZ Ministry for the Environment, Medium Density Residential Standards: A guide for territorial authorities, July 2022, Table 1 and pages 1 to 3; Australian Government Treasury, National Planning Reform Blueprint, August 2024, Measures 1 to 5. The two columns describe different kinds of instrument and are not equivalent in legal force. The MDRS figures are the standards as they stood at the July 2022 guidance; New Zealand's settings have since changed.
Auckland's housing approvals also shifted towards higher-density housing over the same period.
Multi-unit homes, meaning apartments, retirement village units, townhouses, flats and units, rose from 4,038 in the year ended January 2016 to 16,444 in the year ended January 2023. Standalone houses fell from 5,229 to 4,719 over the same period, a decline of 9.8%.
The share of Auckland approvals accounted for by multi-unit homes rose from 43.6% to 77.7%.
Townhouses, flats and units account for most of that shift, rising from 1,381 to 12,467. The period includes both the Auckland Unitary Plan and the Medium Density Residential Standards, so the data cannot isolate the effect of either reform from wider market conditions.
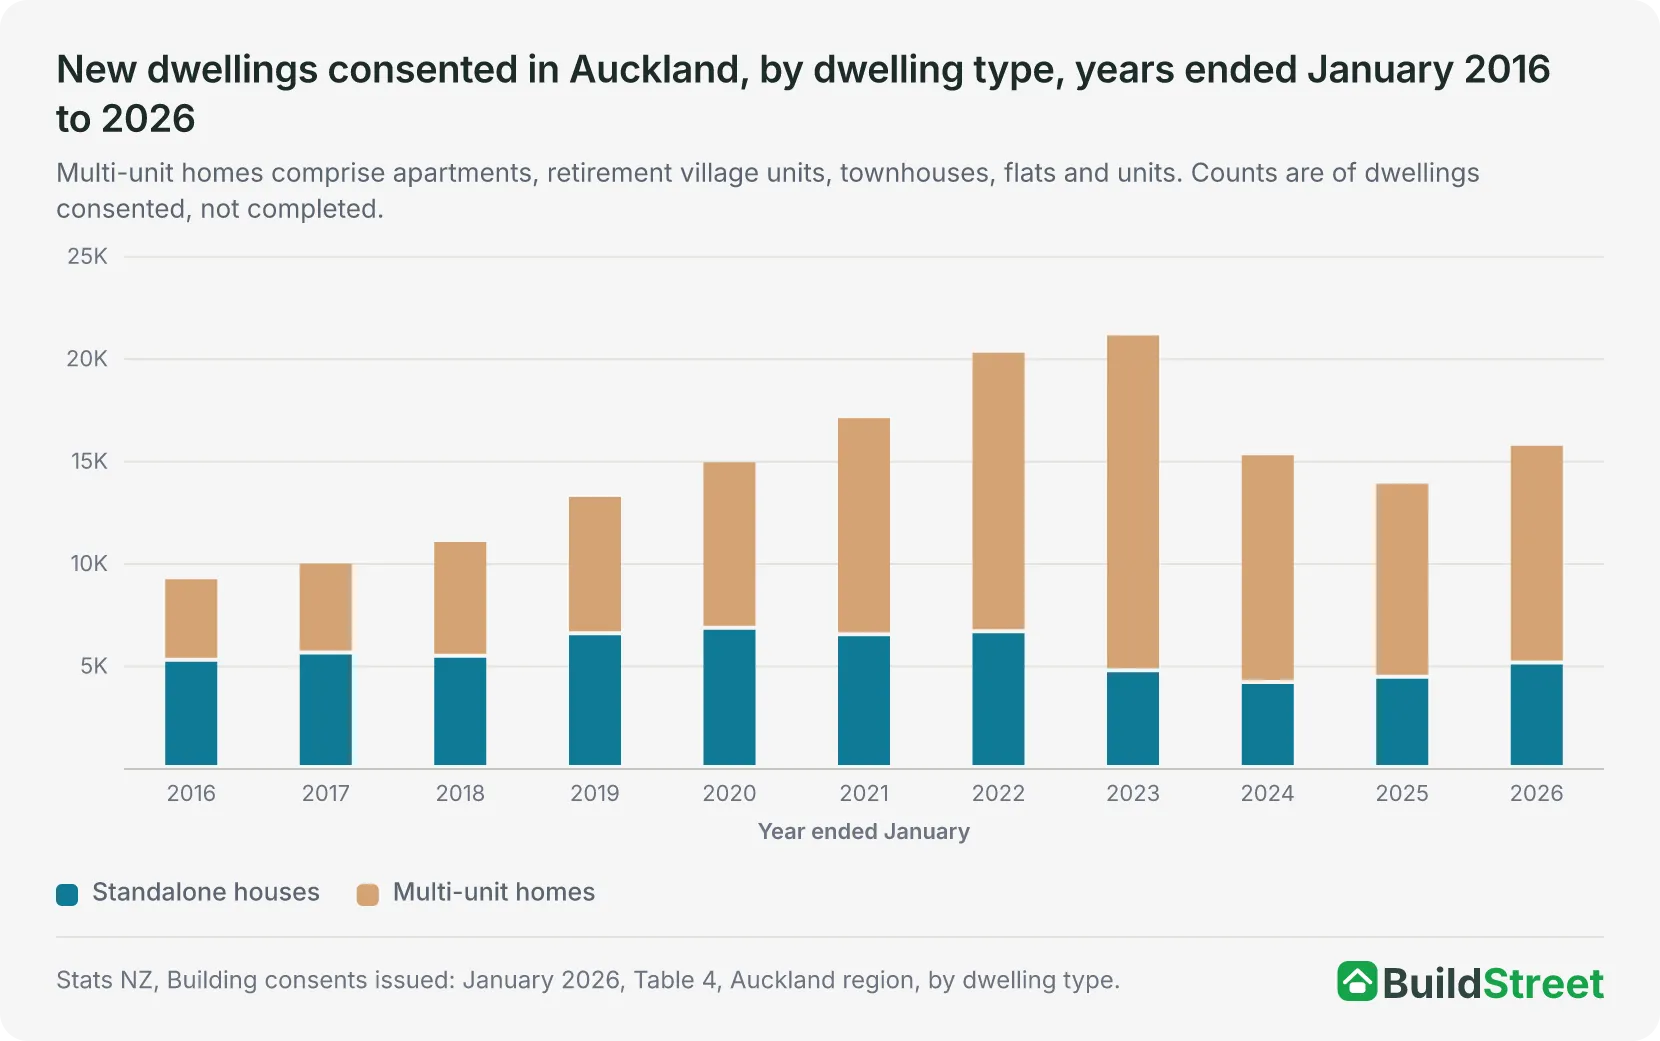
Standalone house consents remained within a narrower range, from 4,147 to 6,795, across the 11 years. Most of the movement in Auckland's total consent numbers came from multi-unit housing.
That pattern also applied during the recent decline. Multi-unit consents went from 16,444 to 10,677 between the years ended January 2023 and 2026, while houses went from 4,719 to 5,102.
Auckland's consent total is now more heavily influenced by changes in attached housing than it was a decade earlier.
Section 07 · Australian application
Applying Auckland's zoning reforms to Australian cities
The Australian Productivity Commission's July 2026 interim report proposes allowing developments of up to three storeys across residential land, subject to exceptions for environmental protection, natural hazard overlays and heritage listings.
The proposal appears in Reform direction 2.1. The Commission states that exceptions for environmental protection, natural hazards and heritage should be supported by benefit-cost analysis.
The Commission states that it prioritised reforms with the strongest evidence of delivering large increases in housing supply, drawing on estimates of zoned and commercially feasible capacity and on quasi-experimental studies of supply responses in Australia or New Zealand.
The interim report finds that broad upzoning is more likely to produce a larger supply response than reform limited to selected sites or areas.
Auckland's estimated results cannot be applied directly to Australian cities. The Commission cautions that different lot sizes, development economics and local conditions may produce different outcomes. It cites a submission noting that Sydney's lot sizes differ from Auckland's and could affect the scale of the supply response.
The Commission's city-specific analysis is expected in its final report, due in March 2027.
The interim report also identifies two important limitations:
- Many upzoned sites may not be commercially feasible to develop, so the short-run supply response is often smaller than the scale of the zoning change implies.
- Land-use reform is more effective when coordinated with housing-enabling infrastructure, land availability and market development.
Treated as portable by the sources
- Metropolitan-scale rather than parcel-scale upzoning
Yes
- Broadly permitting low-rise attached forms
Yes
- Simpler, more predictable permitted-activity rules
Yes
- Pairing zoned capacity with enabling infrastructure
Yes
- Measuring capacity, permits, starts and completions separately
Yes
Requiring local analysis
- Auckland's estimated effect size
Not portable
- Lot sizes and redevelopment economics
Not portable
- Commercially feasible share of zoned capacity
Not portable
- Infrastructure capacity and funding
Not portable
- Hazard, heritage and environmental constraints
Not portable
- Market-cycle and construction-sector conditions
Not portable
Source · Australian Productivity Commission, Housing supply regulation: Interim report, July 2026, Box 1.3 page 28, Box 2.1 page 39, Reform direction 2.1 page 53 and external-validity discussion page 111; Auckland Council Chief Economist Unit, Zoning reform in Auckland: what can we learn from the emerging literature?, March 2024. This is a qualitative summary of positions taken in the cited sources, not a quantified assessment. No estimate of the supply effect of applying Auckland-style upzoning to an Australian city exists in the sources used here.
The first table lists planning-design choices that governments can make. The second lists local conditions that influence whether those choices lead to additional housing.
No Australian supply estimate is included because the cited sources do not quantify the effect of applying Auckland-style reform to an Australian city.
A 2024 University of Auckland rent study reform also notes that reform in one city may attract residents from other areas. This could reduce some local affordability effects over time, although the study does not quantify what coordinated reform across Australian cities would produce.
References
- Stats NZ — Building consents issued: January 2026 · stats.govt.nz
- ABS — Building Approvals, Australia, June 2026 (Table 6) · Australian Bureau of Statistics
- ABS — National, state and territory population, December 2025 (Table 1) · Australian Bureau of Statistics
- OECD Affordable Housing Database — HM1.1 Housing stock and construction (April 2024) · oecd.org
- Auckland Council Chief Economist Unit — Tracking Auckland's housing pipeline: From building consent to completion (June 2025) · knowledgeauckland.org.nz
- Auckland Council Chief Economist Unit — Zoning reform in Auckland: what can we learn from the emerging literature? (March 2024) · knowledgeauckland.org.nz
- Greenaway-McGrevy — University of Auckland EPC Working Paper 017 (September 2025) · auckland.ac.nz
- Greenaway-McGrevy and So — Can Zoning Reform Reduce Housing Costs? Evidence from Rents in Auckland (EPC Working Paper 016, March 2024) · auckland.ac.nz
- Greenaway-McGrevy, Pacheco and Sorensen — Land Use Regulation, the Redevelopment Premium and House Prices (September 2018) · auckland.ac.nz
- Australian Productivity Commission — Housing supply regulation: Interim report (July 2026) · pc.gov.au
- NZ Ministry for the Environment — Medium Density Residential Standards: A guide for territorial authorities (July 2022) · environment.govt.nz
- NZ Ministry of Housing and Urban Development — Plan Change 120 Cabinet paper (February 2026) · hud.govt.nz
- NZ Ministry for the Environment — Resource Management (Auckland Housing) Amendment Act (April 2026) · environment.govt.nz
- Auckland Council — Plan Change 120 update (July 2026) · ourauckland.aucklandcouncil.govt.nz
- Treasury — National Planning Reform Blueprint · treasury.gov.au
- NZ Tertiary Education Commission — Aide Memoire: Overview of the University of Auckland (February 2025) · tec.govt.nz
