

Published 24 July 2026
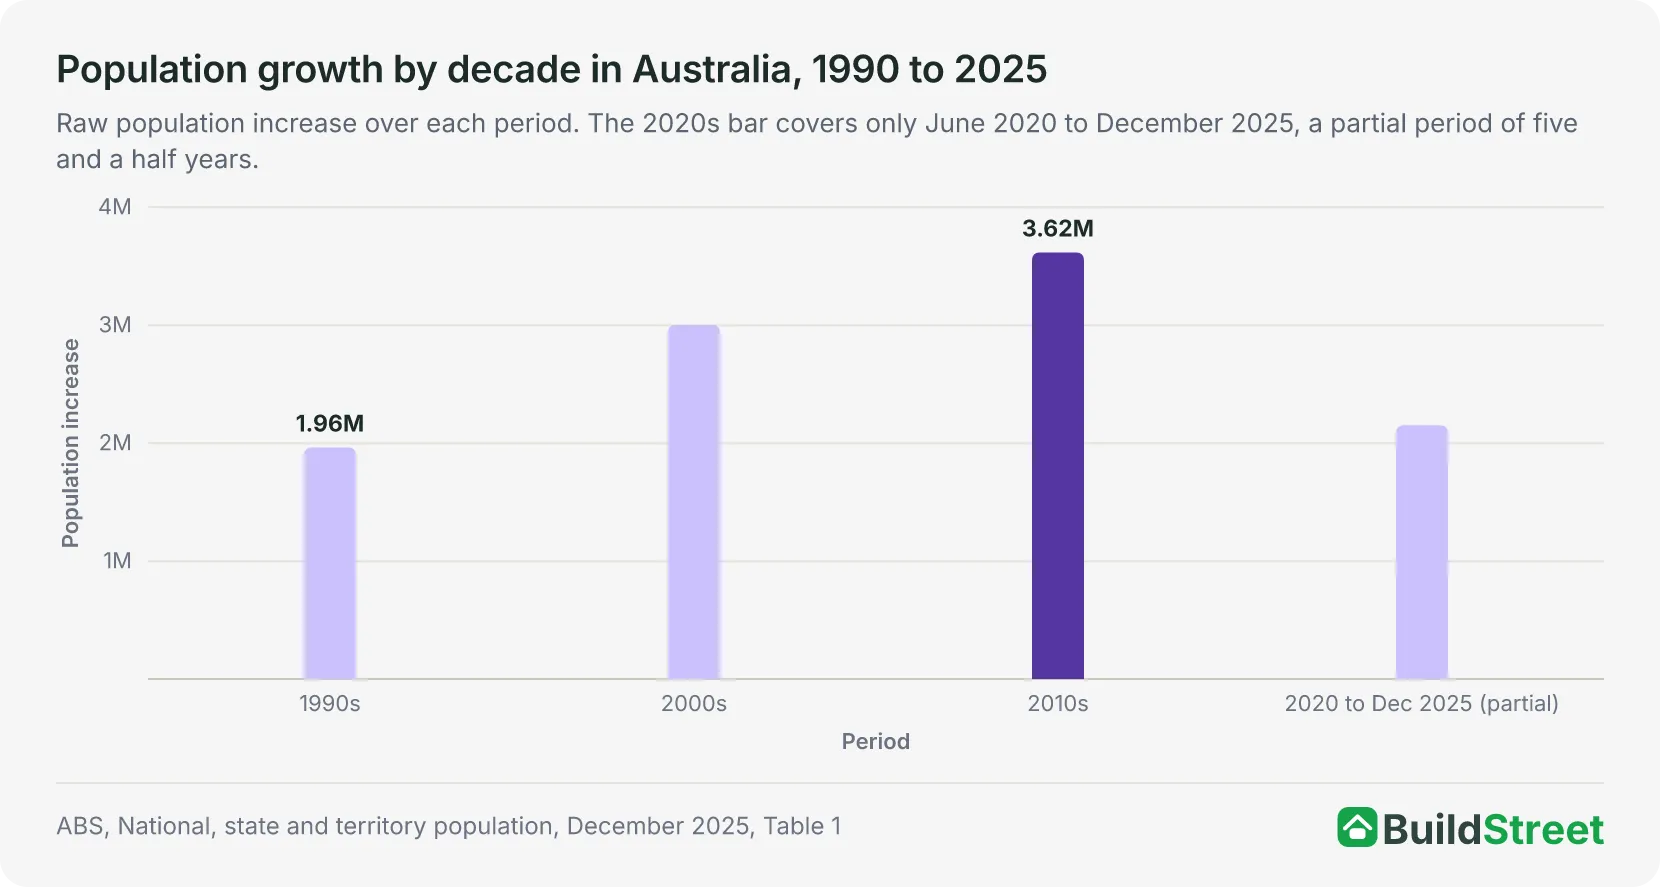
Australia's population has grown every decade since 1990: by 1.96 million in the 1990s, 3.00 million in the 2000s, and 3.62 million in the 2010s. A further 2.15 million people were added between June 2020 and December 2025. Overseas migration now accounts for most of Australia's population growth, rising from about half in the early 2000s to almost three-quarters in 2024–25.
Household formation has also increased faster than population growth alone would suggest.
Average household size fell from 2.6 people in 2016 to 2.5 in 2021, tightening the household-to-completions ratio beyond any of the past four Census periods. No single estimate exists for cumulative shortfall since 1990, but the National Housing Supply and Affordability Council's forward-looking benchmark projects a 37,000-dwelling shortfall over the current Housing Accord period, a flow measure rather than an accumulated total.
 What is driving housing demand in Australia in 2026? Population, migration and household formationNew household formation in Australia is projected to exceed net new housing supply by 24,000 dwellings in 2025–26, down from a 78,000-dwelling gap two years earlier, according to the National Housing…
 Is Australia on track to build 1.2 million homes by June 2029?Australia has completed 307,635 homes in the first seven quarters of the National Housing Accord, leaving the country 112,365 homes behind the pace needed to reach 1.2 million by June 2029. Australia…
Section 01 · The national picture
How much has Australia's population grown since 1990?
Australia's population rose from 17.07 million in June 1990 to 27.80 million in December 2025. In raw terms, the completed decades added progressively more people: 1.96 million in the 1990s, 3.00 million in the 2000s and 3.62 million in the 2010s. A further 2.15 million people were added in the five and a half years from June 2020 to December 2025.
Raw increases alone are not a fair comparison, since each decade started from a larger population than the last. Measured instead as a compound annual growth rate, the 2010s were the fastest of the four periods at 1.53% a year, followed by the 2000s and the partial 2020s period, both at 1.48%. The 1990s grew the slowest, at 1.10% a year.
Population growth since June 2020 has therefore matched the annual pace recorded in the 2000s, rather than setting a new record.
| Period | Start population | End population | Increase | Compound annual growth |
|---|---|---|---|---|
| 1990s | 17,065,100 | 19,028,800 | 1,963,700 | 1.10% |
| 2000s | 19,028,800 | 22,031,800 | 3,003,000 | 1.48% |
| 2010s | 22,031,800 | 25,649,200 | 3,617,400 | 1.53% |
| 2020 to Dec 2025 (partial, 5.5 years)* | 25,649,200 | 27,801,000 | 2,151,800 | 1.48% |
Source · ABS, National, state and territory population, December 2025, Table 1.
Section 02 · Migration
How has overseas migration changed Australia's population growth?
Overseas migration accounted for 71% of Australia's population growth over the five years to 2024–25, compared with 51.1% in the early 2000s. In the latest completed financial year, 2024–25, its share was 72.5%.
The shift has not been a smooth trend. Overseas migration fell to a net outflow of 85,000 people in 2020–21 during Australia's international border closure, before reaching a record year-ending level of 556,000 in the September quarter of 2023 as arrivals increased after the border reopened.
The most recently completed financial year, 2024–25, recorded overseas migration of 302,200 in the quarterly population series. The ABS's separate annual migration release publishes 306,000 for the same year after later revisions.
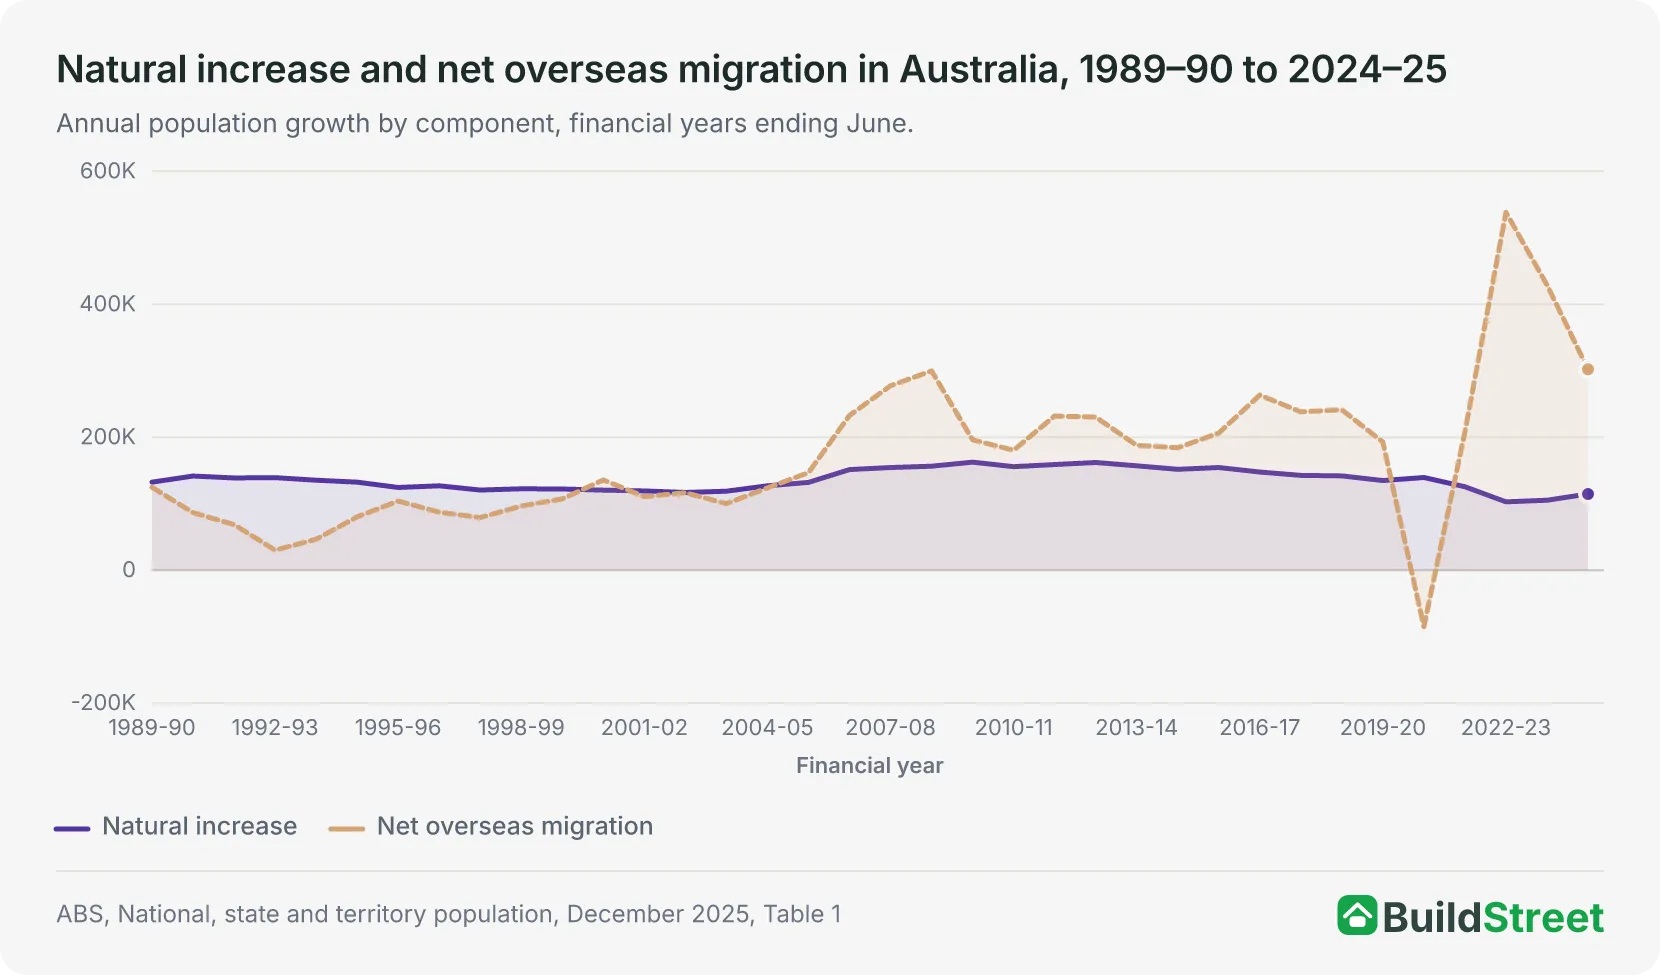
| Financial year | Natural increase | Net overseas migration | Total growth | Overseas migration share |
|---|---|---|---|---|
| 1999–2000 | 122,100 | 107,200 | 216,500 | 49.5% |
| 2004–05 | 126,900 | 123,800 | 244,100 | 50.7% |
| 2009–10 | 162,600 | 196,100 | 340,100 | 57.7% |
| 2014–15 | 151,800 | 184,100 | 340,300 | 54.1% |
| 2019–20 | 134,800 | 192,700 | 314,400 | 61.3% |
| 2020–21 | 139,500 | −85,000 | 36,200 | −234.8% |
| 2022–23 | 102,900 | 538,300 | 641,200 | 84.0% |
| 2024–25 | 114,600 | 302,200 | 416,700 | 72.5% |
Source · ABS, National, state and territory population, December 2025, Table 1.
International student arrivals fell after the 2022–23 peak
International student arrivals fell by about 44% in two years, from 278,000 in 2022–23 to 157,000 in 2024–25.
This was part of a broader decline in temporary visa arrivals. The visa-category data show where arrivals declined but do not isolate the effect of individual policy changes or explain every movement in overseas migration.
12022–23
- Total migrant arrivals
739,000
- On temporary visas
557,000
- International students
278,000
22023–24
- Total migrant arrivals
661,000
- On temporary visas
458,000
- International students
204,000
32024–25
- Total migrant arrivals
568,000
- On temporary visas
363,000
- International students
157,000
Source · ABS, Overseas Migration releases for the 2022–23, 2023–24 and 2024–25 financial years. This visa-category breakdown comes from the ABS's separate annual Overseas Migration release and is not directly combined with the quarterly population series used elsewhere on this page. Figures use the most recently revised estimate available for each year.
Section 03 · Household formation
How has household formation compared with dwelling completions?
Household growth was equivalent to about 97 households for every 100 gross dwelling completions in the five years to the 2021 Census, the highest ratio across the five Census periods examined. The other periods ranged from 52 to 81 households per 100 completions. This is a descriptive comparison, not a direct measure of housing supply against demand, because gross completions do not account for dwellings removed from the housing stock.
Comparing Census-to-Census household growth with gross dwelling completions over the same period gives a rough sense of how closely new households have tracked new building. Using a household proxy comprising family, lone-person and group households, the number of households grew by 989,128 between the 2016 and 2021 Censuses, compared with 1,019,732 gross dwelling completions over the same aligned 20 quarters.
Part of the change reflects smaller households. Average household size remained at 2.6 people across the 2006, 2011 and 2016 Censuses before falling to 2.5 in 2021. A smaller average household size means more dwellings are required to accommodate the same population, so household numbers can grow faster than population growth alone would suggest.
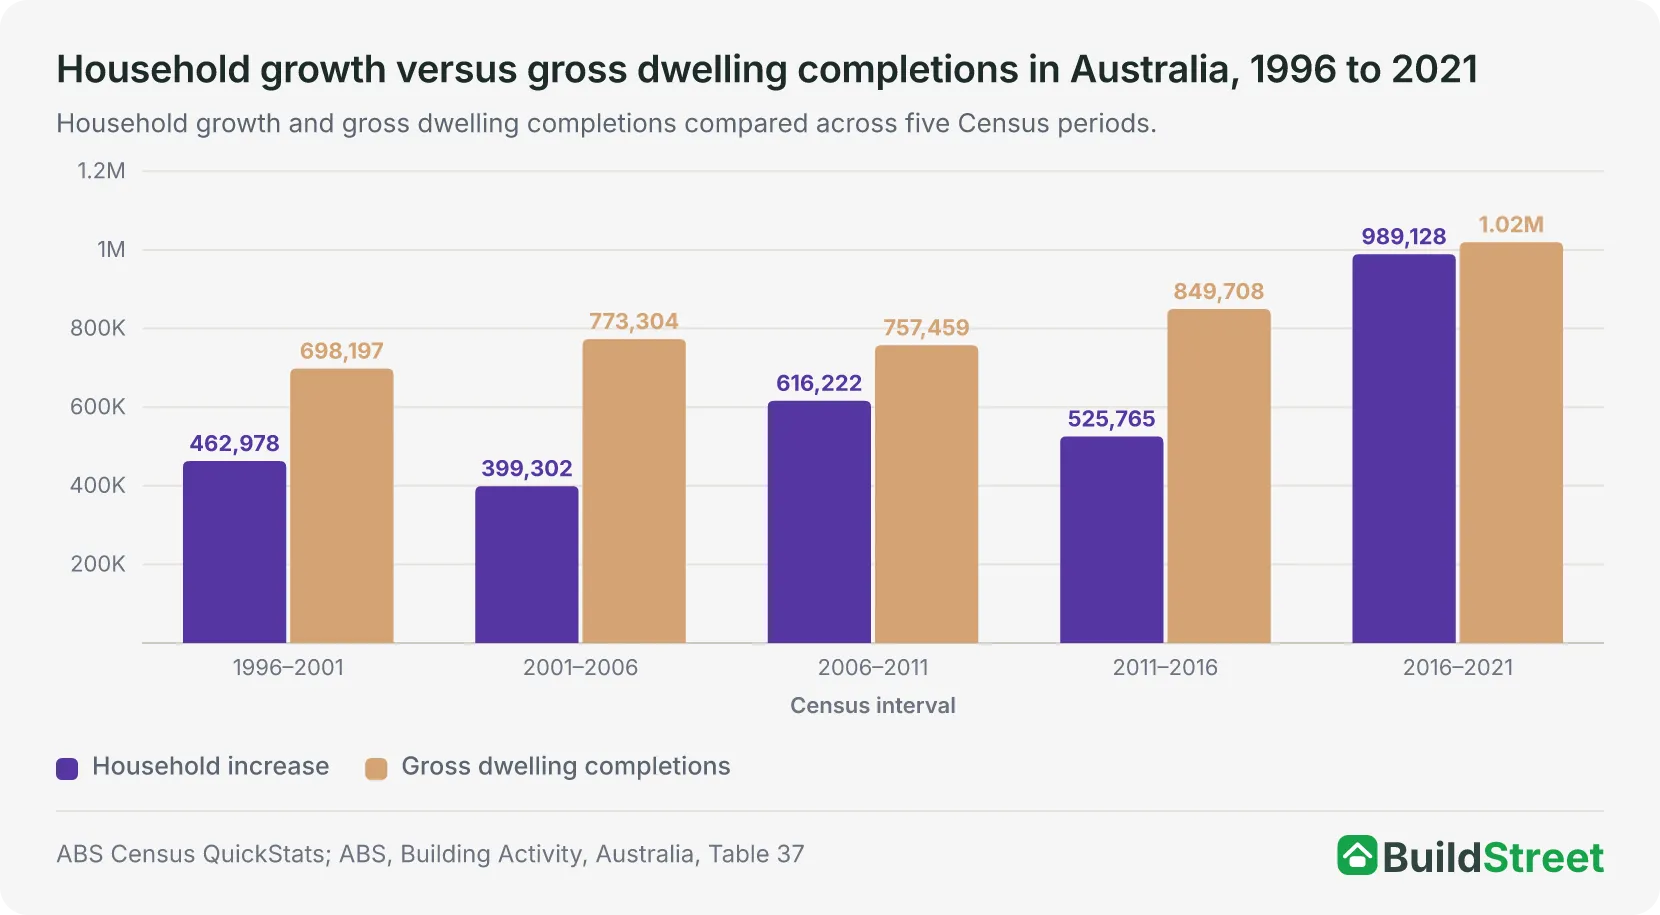
| Census interval | Household increase | Gross completions | Households per 100 completions |
|---|---|---|---|
| 1996–2001 | 462,978 | 698,197 | 66.3 |
| 2001–2006 | 399,302 | 773,304 | 51.6 |
| 2006–2011 | 616,222 | 757,459 | 81.4 |
| 2011–2016 | 525,765 | 849,708 | 61.9 |
| 2016–2021 | 989,128 | 1,019,732 | 97.0 |
Source · ABS Census QuickStats and ABS Building Activity, Australia, Table 37.
Average household size fell to 2.5 people in 2021
Average household size has declined over the longer term, although RBA and Census measures show slightly different patterns. The RBA measure, built from monthly Labour Force Survey data, shows average household size falling from around 2.9 people in the mid-1980s to around 2.5 by the early 2000s, before reaching historical lows below 2.5 during the pandemic. Census counts show a flatter trend, remaining at 2.6 people per household in 2006, 2011 and 2016 before easing to 2.5 in 2021.
The household-size decline between early 2020 and September 2022 alone, separate from population growth, added around 120,000 households nationally, according to RBA estimates.
The RBA linked the change partly to pandemic-era preferences for additional space and partly to slower population growth during the border closure period.
| Average household size in Australia, 2006 to 2021 | |
|---|---|
| Census year | Average people per household |
| 2006 | 2.6 |
| 2011 | 2.6 |
| 2016 | 2.6 |
| 2021 | 2.5 |
Source · ABS Census QuickStats, Australia, 2006, 2011, 2016 and 2021.
Section 04 · The supply-demand balance
What is Australia's projected housing supply shortfall?
The clearest available benchmark projects a 37,000-dwelling shortfall over the 2024–25 to 2028–29 Housing Accord period, with net new supply of 862,000 dwellings against new underlying demand of 900,000 households.
The National Housing Supply and Affordability Council describes this as a forward-looking flow model. It does not represent the total housing shortfall accumulated before the Accord period.
No single, consistent estimate exists for cumulative housing undersupply since 1990. A genuine supply-demand balance needs two comparable flow measures: net new supply after losses, and new underlying demand.
The two series, gross completions and Census household counts, do not meet that standard. Completions data do not track losses to the dwelling stock, and no consistent annual household-formation series exists back to 1990.
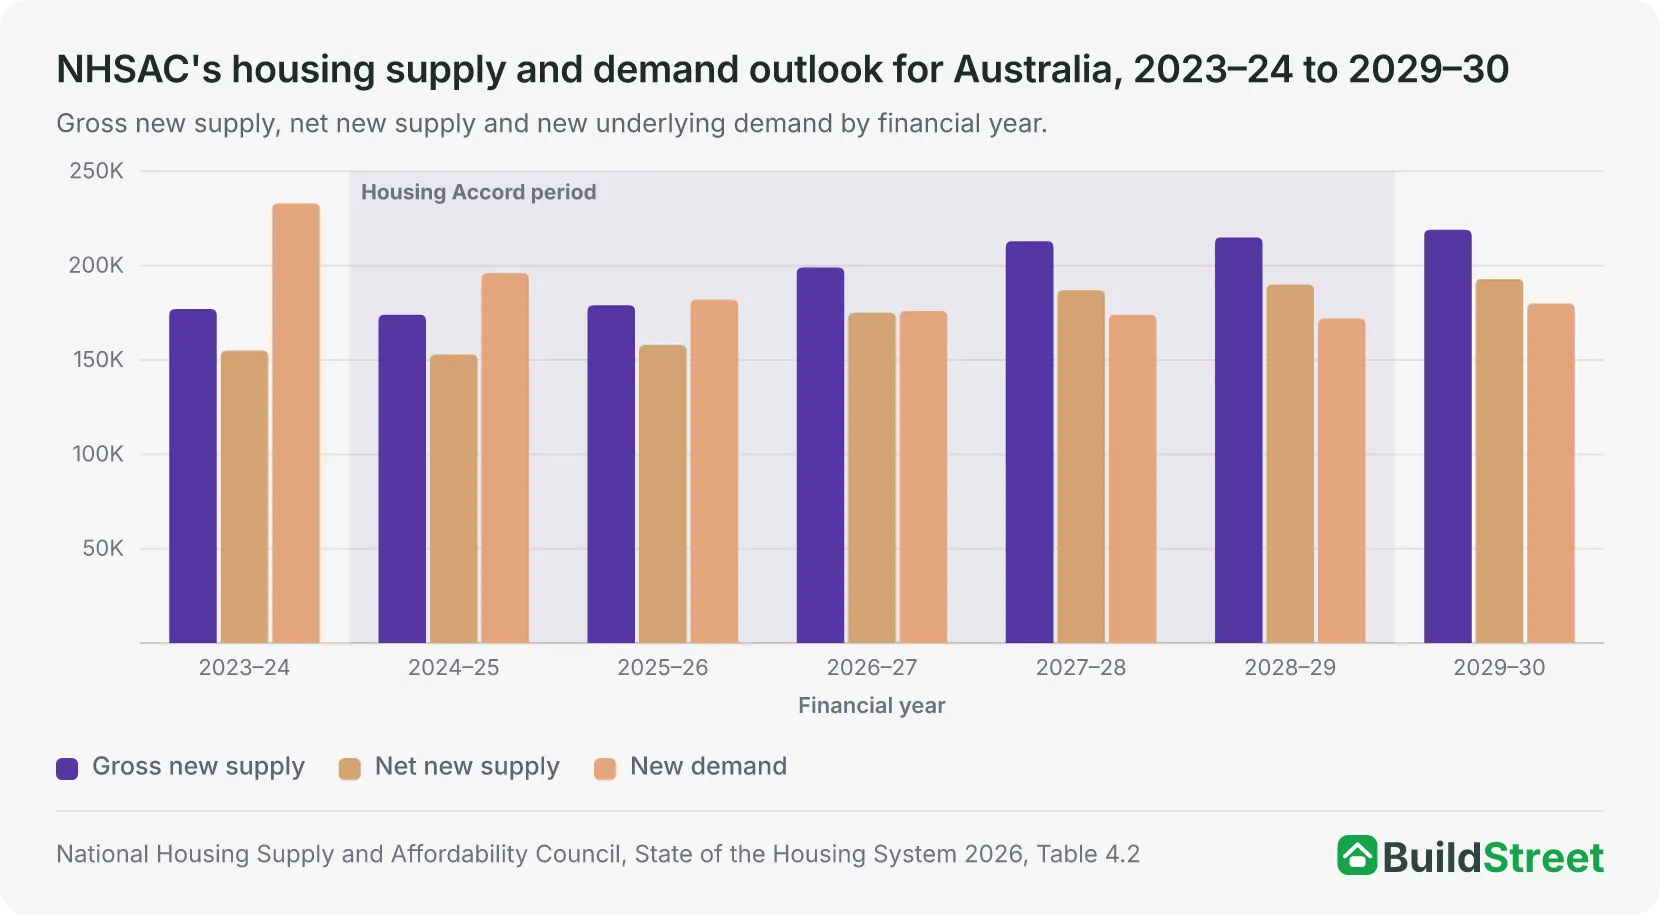
| Year | Gross new supply | Net new supply | New underlying demand | Net balance | Accord period |
|---|---|---|---|---|---|
| 2023–24 | 177,000 | 155,000 | 233,000 | −78,000 | No |
| 2024–25 | 174,000 | 153,000 | 196,000 | −43,000 | Yes |
| 2025–26 | 179,000 | 158,000 | 182,000 | −24,000 | Yes |
| 2026–27 | 199,000 | 175,000 | 176,000 | −1,000 | Yes |
| 2027–28 | 213,000 | 187,000 | 174,000 | +13,000 | Yes |
| 2028–29 | 215,000 | 190,000 | 172,000 | +17,000 | Yes |
| 2029–30 | 219,000 | 193,000 | 180,000 | +13,000 | No |
| Accord total (2024–25 to 2028–29) | 980,000 | 862,000 | 900,000 | −37,000 | – |
Source · National Housing Supply and Affordability Council, State of the Housing System 2026, Table 4.2, report page 71.
Section 05 · Internal migration
How the mining boom and COVID changed interstate migration
New South Wales recorded a net interstate outflow in every year from 1989–90 to 2024–25, while Queensland recorded a net inflow in every year over the same 36-year period.
Net interstate migration measures the net movement of residents between Australia's states and territories and is separate from overseas migration. Queensland and Western Australia, both states with large resources sectors, recorded different interstate migration patterns during the resources boom.
Across the financial years ending 2003 to 2013, an analytical period used in this article rather than an official ABS classification, average annual net interstate migration was:
- Queensland: a net inflow of about +20,100 people a year.
- Western Australia: a net inflow of about +4,100 people a year.
- New South Wales: a net outflow of about −21,500 people a year.
Western Australia's smaller interstate inflow does not mean the resources boom generated less labour demand there. The Productivity Commission found that temporary overseas migration and fly-in fly-out arrangements were important sources of labour for resources regions, alongside permanent relocation.
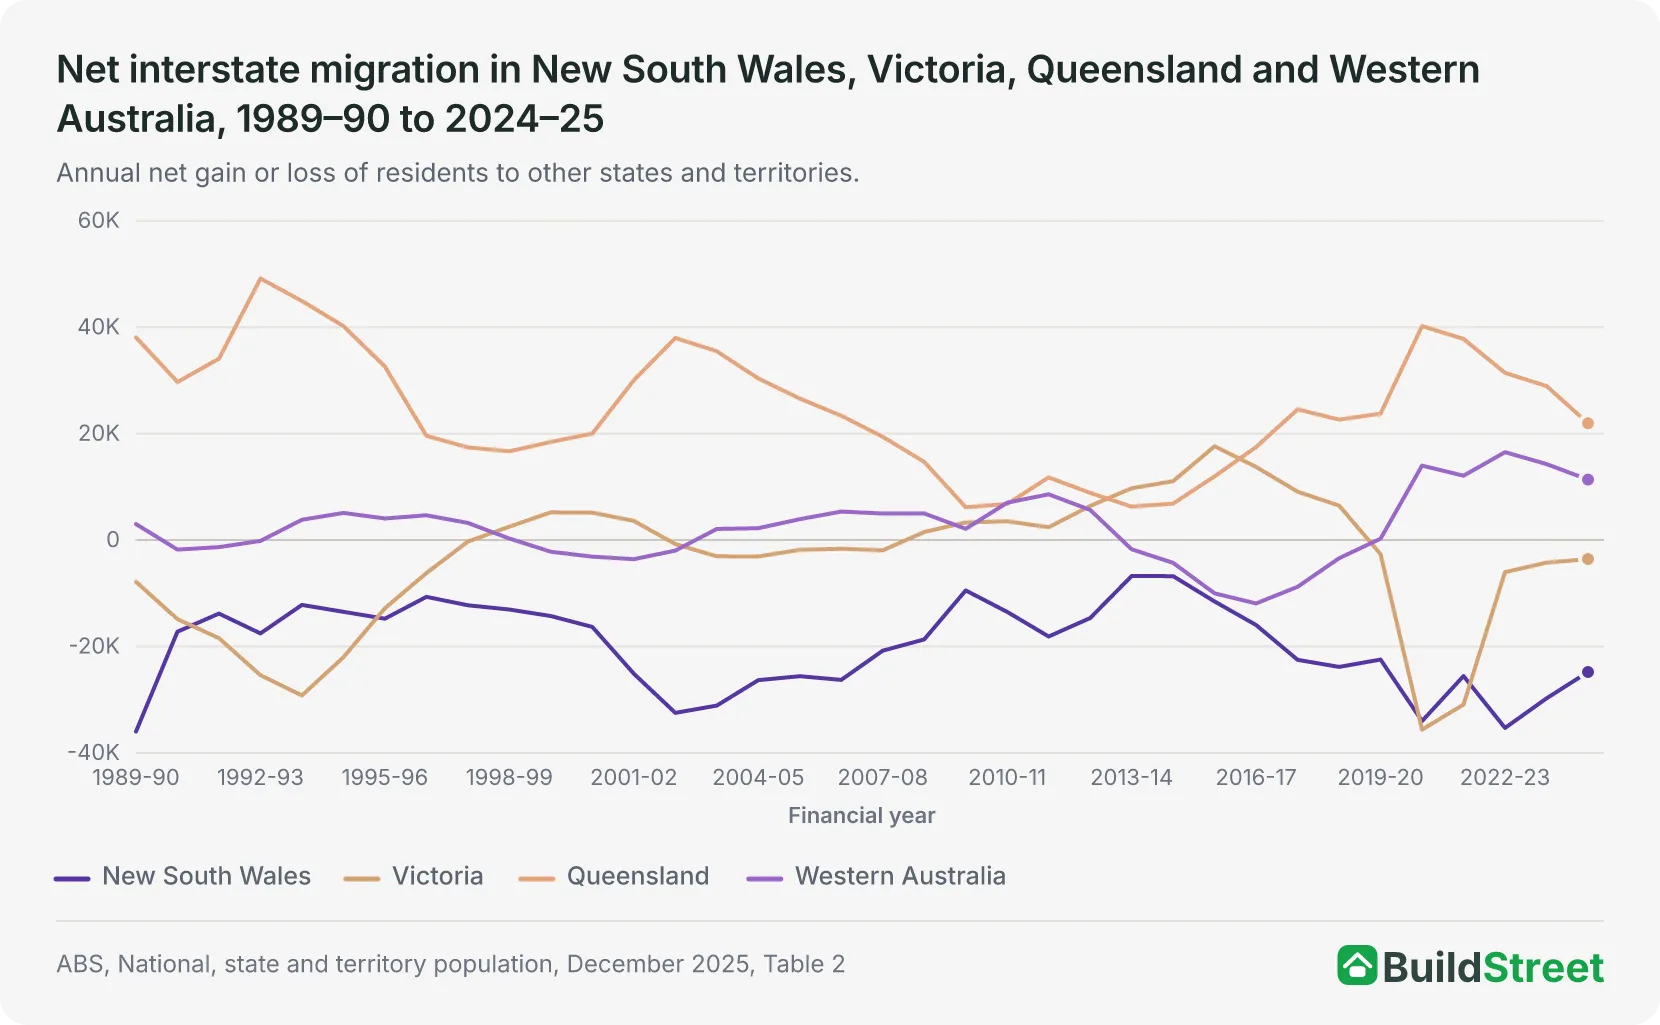
1Mining-boom period (FY03–13)
- New South Wales
−21,536
- Victoria
+452
- Queensland
+20,143
- Western Australia
+4,100
2COVID disruption (FY20–22)
- New South Wales
−27,336
- Victoria
−23,059
- Queensland
+33,930
- Western Australia
+8,790
3Post-COVID (FY23–25)
- New South Wales
−29,943
- Victoria
−4,605
- Queensland
+27,453
- Western Australia
+14,064
Source · Eras are analytical groupings for this article, not official ABS classifications. Source: ABS, National, state and territory population, December 2025, Table 2.
Section 06 · Today versus the early 2000s
How housing demand drivers today compare to the early 2000s
Average annual population growth rose from 229,600 people a year over 2000–01 to 2004–05 to 392,360 a year over 2020–21 to 2024–25. Most of the increase came from overseas migration rather than natural increase.
In the earlier period, natural increase supplied 52.5% of growth and net overseas migration supplied 51.1%. In the more recent five years, a period that includes the COVID border closure and reopening catch-up, it supplied 71% of growth.
This makes recent population growth both faster and more migration-dependent than in the early 2000s. This has made annual growth more sensitive to changes in migration policy, international travel and temporary visa movements, including student arrivals and departures.
1Early 2000s (FY01–05)
- Average annual growth
229,600
- Natural increase share
52.5%
- Overseas migration share
51.1%
2Recent 5 years (FY21–25)
- Average annual growth
392,360
- Natural increase share
29.9%
- Overseas migration share
71.0%
3Latest year (2024–25)
- Annual growth
416,700
- Natural increase share
27.5%
- Overseas migration share
72.5%
Source · These are population-growth component amounts expressed as a percentage of published population growth, not exhaustive shares of a fixed total. The two early-2000s figures shown here sum to about 103.6%, and the two recent-period figures sum to about 100.9%, because ERP and its components are revised separately; the gap is a reconciliation residual, not a third source of growth. Source: ABS, National, state and territory population, December 2025, Table 1.
Section 07 · Looking ahead
How could population and household growth affect housing demand to 2040?
Australia's population is projected to reach 32.3 million by 2040, up from 27.4 million in 2025, under the medium-scenario projection used in this article. Household projections, built on a different but related set of assumptions, put the central estimate (Series II) at 12.94 million households in 2040, an increase of 2.94 million from the 2021 base, with a projected range across the three scenarios of 12.67 million to 13.17 million across the three household series.
A separate projection from the Centre for Population, a Treasury body, expects Australia's population to reach 31.5 million by 2035–36 and 41.0 million by 2065–66, with annual growth easing to about 1.2% from 2026–27, below the 1.4% average of the 2010s.
The ABS and Centre for Population series use different base years, assumptions, methods and projection periods. They are therefore presented separately rather than combined into a single projection series.
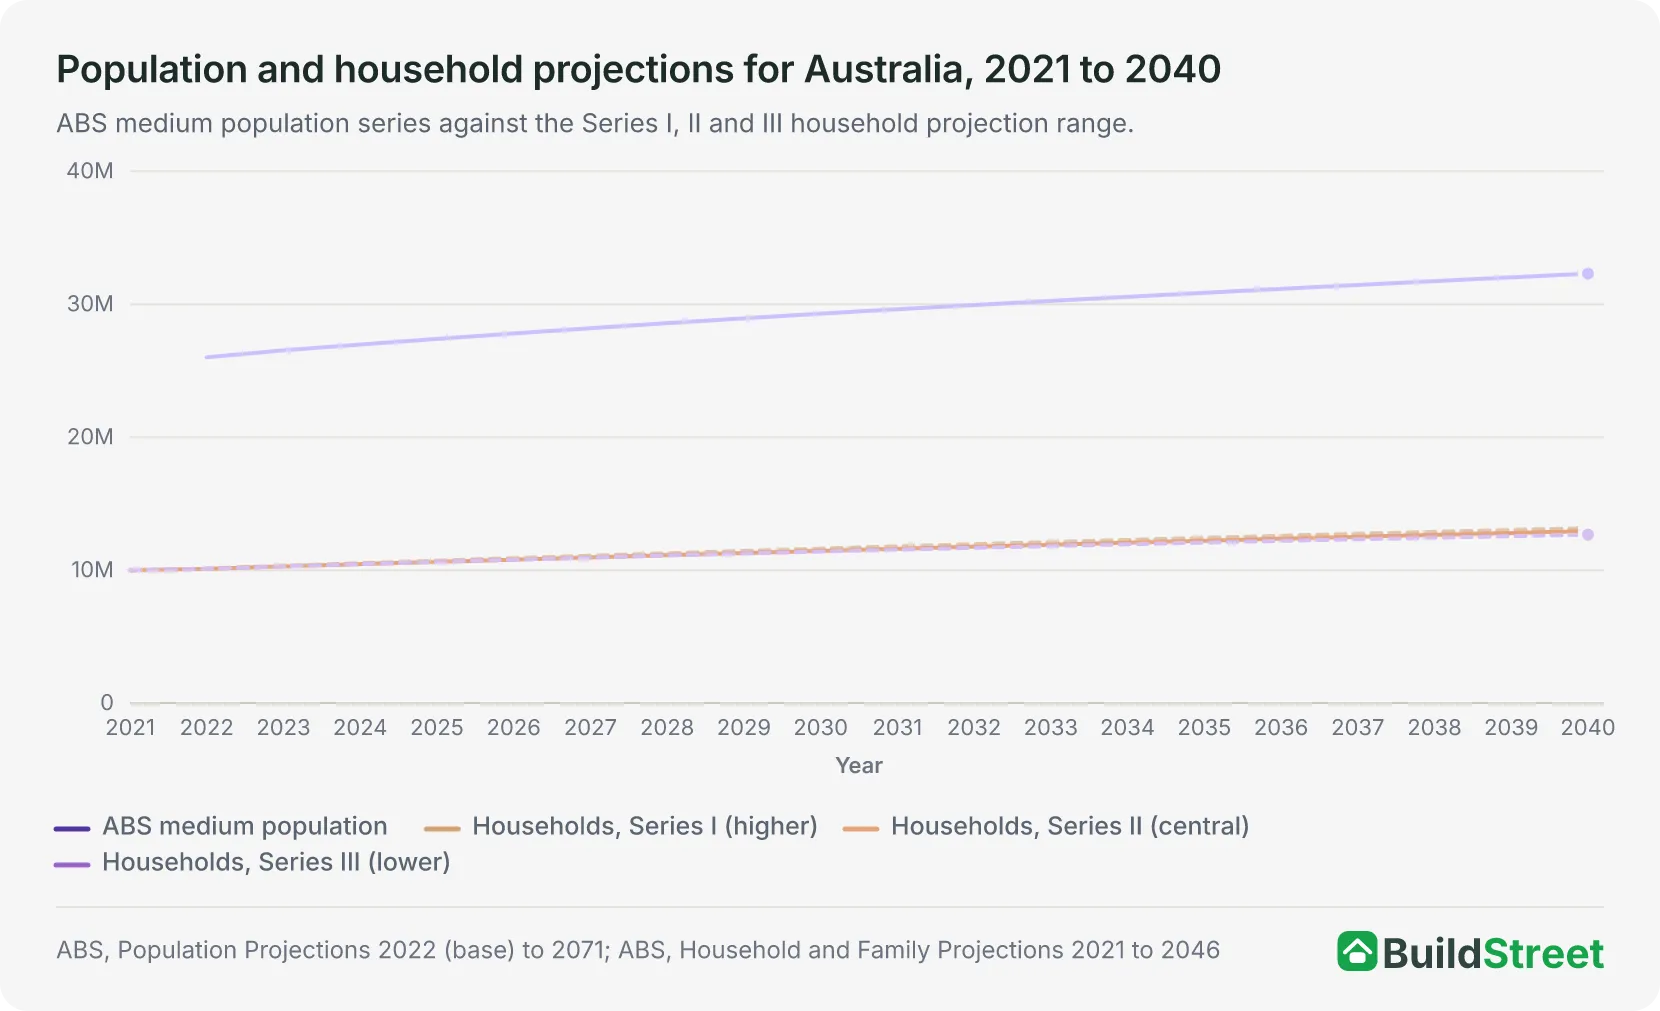
| Year | ABS medium population | Households, Series I | Households, Series II | Households, Series III |
|---|---|---|---|---|
| 2021 | – | 9,993,880 | 9,993,880 | 9,993,880 |
| 2025 | 27,395,011 | 10,714,916 | 10,622,921 | 10,622,921 |
| 2030 | 29,294,970 | 11,621,708 | 11,449,795 | 11,401,389 |
| 2035 | 30,862,815 | 12,432,612 | 12,216,604 | 12,077,783 |
| 2040 | 32,308,944 | 13,165,972 | 12,938,818 | 12,670,783 |
Source · ABS Population Projections, Table B9, Series 29(B); ABS Household and Family Projections, Series I to III.
Section 08 · Population growth
How has Australia's housing demand changed since 1990?
Australia's population has grown every decade since 1990, from 17.07 million to 27.80 million. Three major demand drivers changed over that period:
- Migration now drives most of the growth. Net overseas migration has gone from contributing about half of population growth in the early 2000s to close to three-quarters of it today, making growth faster but also more sensitive to migration policy and global conditions.
- Households are forming faster than population growth alone explains, partly because the average household has grown smaller, adding to demand for separate dwellings even in years when population growth was slow.
- Internal migration patterns have changed by state. Queensland and Western Australia have responded differently to both the mining boom and COVID, while New South Wales and Victoria have recorded net interstate migration losses through most of the past decade.
No single, methodologically consistent estimate exists for cumulative housing undersupply since 1990. The clearest current official benchmark is NHSAC's forward-looking Housing Accord outlook, which compares annual net new supply with new underlying demand.
Across the 2024–25 to 2028–29 Accord period, NHSAC projects a shortfall of 37,000 dwellings. Annual net supply is projected to exceed annual demand from 2027–28, but the later annual surpluses are not large enough to remove the published shortfall across the full five-year period.
Beyond 2040, the ABS and Centre for Population project continued population growth, while the ABS also projects continued household growth. The pace of growth is expected to ease under the central scenarios, but the projections remain dependent on assumptions about migration, fertility, mortality and household living arrangements.
References
- ABS, National, state and territory population (latest release) · Australian Bureau of Statistics
- ABS: Overseas Migration, 2024–25 · Australian Bureau of Statistics
- ABS, Overseas Migration, 2023–24 financial year · Australian Bureau of Statistics
- ABS, Building Activity, Australia (latest release, Cat. 8752.0) · Australian Bureau of Statistics
- ABS 2021 Census of Population and Housing, All persons QuickStats · Australian Bureau of Statistics
- ABS, 2016 Census QuickStats, Australia · Australian Bureau of Statistics
- ABS, Census QuickStats, Australia, 2011 · Australian Bureau of Statistics
- ABS, 2006 Census QuickStats, Australia · Australian Bureau of Statistics
- ABS, Household and families: Census · Australian Bureau of Statistics
- ABS: Household and Family Projections, 2021 to 2046 · Australian Bureau of Statistics
- ABS, Population Projections, Australia, 2022 (base) to 2071 · Australian Bureau of Statistics
- ABS Total Value of Dwellings, March quarter 2026 · Australian Bureau of Statistics
- ABS Consumer Price Index, Australia (latest release, Cat. 6401.0) · Australian Bureau of Statistics
- NHSAC State of the Housing System 2026 · nhsac.gov.au
- Productivity Commission, Geographic Labour Mobility, research report, April 2014 · pc.gov.au
- Centre for Population, 2025 Population Statement · population.gov.au
- Centre for Population, Components of Australia's population since 1982, January 2025 · population.gov.au
- RBA Bulletin, A new measure of average household size, March 2023 · Reserve Bank of Australia
