


Published
- Australia's house price-to-income ratio vs long-term average
- 154.1%
- March quarter 2026, the highest since 1970
- Australia's OECD house price-to-income ranking, 2025
- 2nd of 22
- At 147.9% of its long-term average, after Canada at 150.4%
- Mean dwelling price in years of full-time earnings
- 10.2 years
- Illustrative calculation using ABS mean dwelling prices (June quarter 2026) and annualised full-time earnings (May 2026)
- Change in Poland's price-to-income ratio
- −23.0%
- 2010 to 2025, compared with an increase of 27.0% for Australia
 Housing affordability across countriesAustralia's price-to-income index, housing costs and rents compared with other OECD economies.
 Cost of living overseasHow the cost of living in Thailand, Malaysia and Poland compares with Australia.
Section 01 · The measure
What does a house price-to-income ratio measure?
The OECD's house price-to-income ratio compares changes in house prices with changes in household disposable income per person. The ratio rises when house prices increase faster than incomes1. Australia's ratio was 124.9 in the March quarter 2026 on a base of 2015 equal to 100, meaning house prices relative to disposable income per head were 24.9 per cent higher than in 2015.
The OECD publishes the ratio in two forms. The first uses 2015 as a starting point of 100 for every country, showing how much each country's ratio has changed since then. The second compares the ratio with each country's long-term average, set at 100. Australia's value of 154.1 means its ratio was 54.1 per cent above its long-term average1.
Annual values are averages of the four quarters. The March quarter 2026 value covers a single quarter. Both columns measure the same ratio but use different starting points for comparison.
| Australia’s house price-to-income ratio in the OECD’s two forms, 1970 to 2026 | ||
|---|---|---|
| Period | Index, 2015 = 100 | % of long-term average |
| 1970 | 56.31 | 69.51 |
| 1983 | 51.81 | 63.91 |
| 2000 | 67.81 | 83.71 |
| 2010 | 94.31 | 116.41 |
| 2015 | 100.01 | 123.41 |
| 2020 | 100.41 | 123.91 |
| 2025 | 119.91 | 147.91 |
| March quarter 2026 | 124.91 | 154.11 |
Source · OECD Analytical house prices indicators (dataset last updated 7 October 2026).
Section 02 · Australia
What is Australia's house price-to-income ratio?
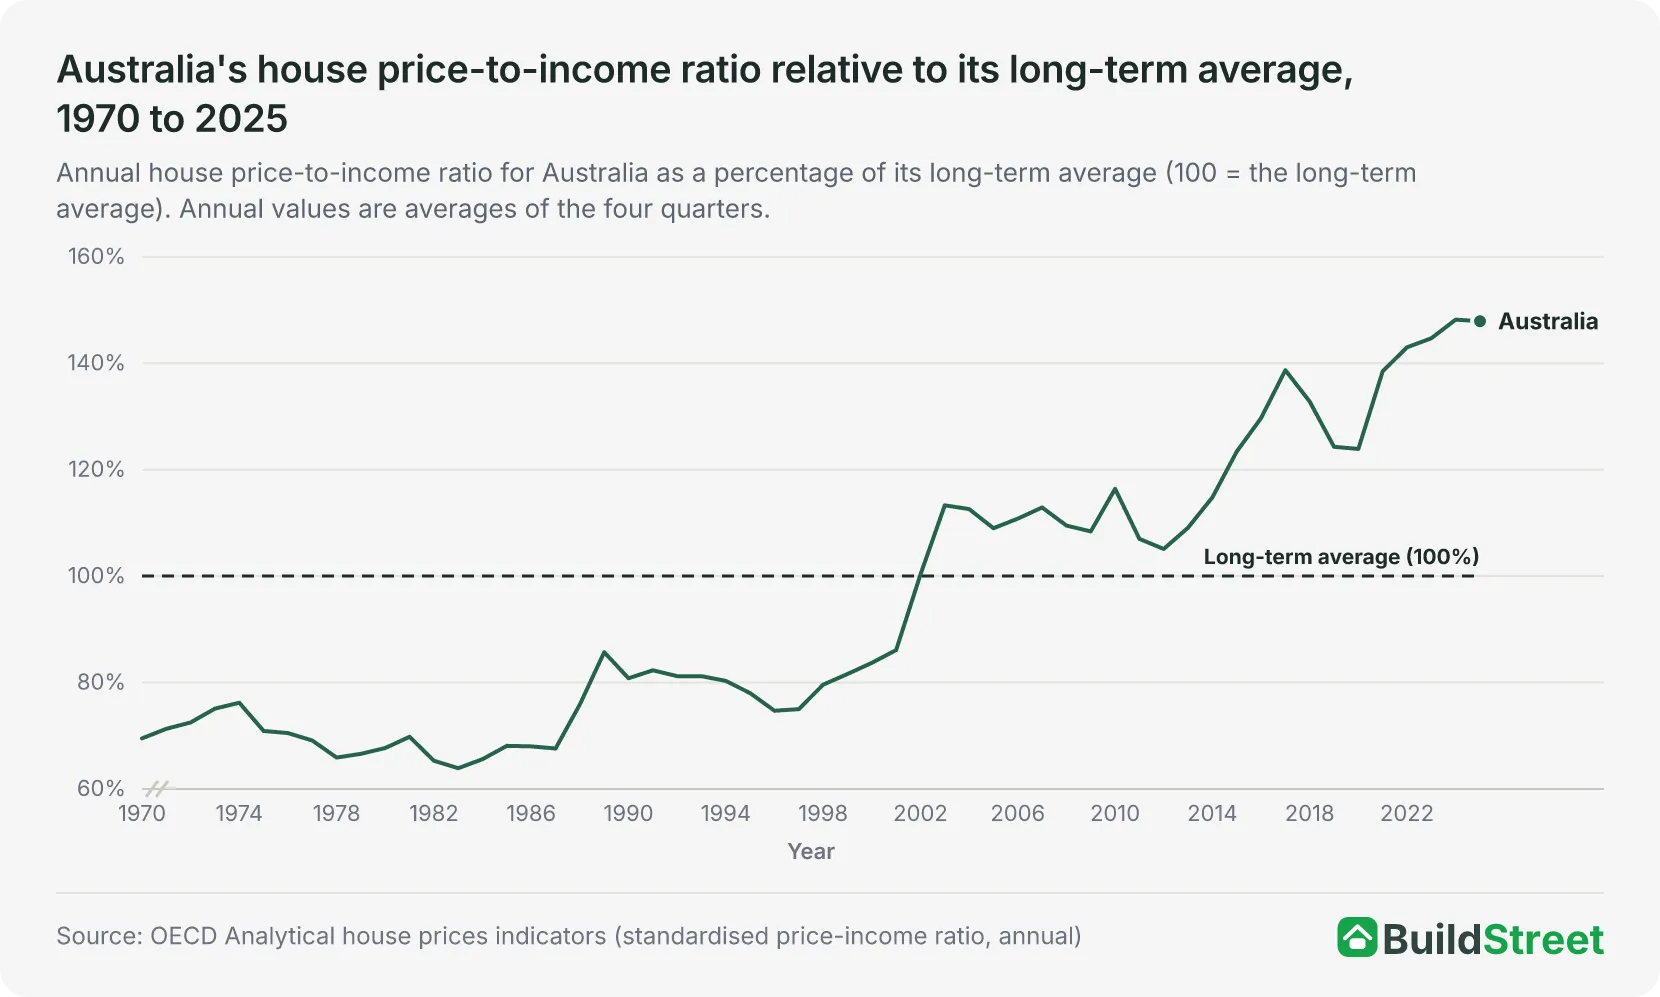
Australia's house price-to-income ratio was 154.1 per cent of its long-term average in the March quarter 2026, the highest quarterly level since 19701. The annual ratio was 148.2 per cent in 2024 and 147.9 per cent in 2025.
Australia's ratio was below its long-term average in every year from 1970 to 2001. It was above its long-term average in every year from 2002 to 2025, reaching 116.4 per cent in 2010 and 123.9 per cent in 20201.
How many years of full-time earnings does the mean dwelling price in Australia equal?
The mean price of residential dwellings in Australia, which is the total value of all homes divided by the number of homes rather than an average sale price, was $1,100,400 in the June quarter 2026, according to the Australian Bureau of Statistics (ABS)2. Full-time adult average weekly ordinary time earnings were $2,083.70 in May 2026, or $108,352 over 52 weeks3.
The mean dwelling price was equal to 10.2 years of one full-time adult's earnings before tax. This is a comparison based on ABS figures, not an official measure of housing affordability.
The June quarter 2026 dwelling estimates are preliminary and may be revised2.
New South Wales recorded the highest mean dwelling price relative to full-time earnings among the states and territories, at 11.9 years. The Northern Territory recorded the lowest, at 6.0 years3.
| Mean dwelling price in years of full-time earnings, states and territories, 2026 | ||||
|---|---|---|---|---|
| State or territory | Mean dwelling price, June quarter 2026 | Full-time adult weekly earnings, May 2026 | Annual earnings (52 weeks) | Years of earnings |
| New South Wales | $1,304,9002 | $2,108.803 | $109,658 | 11.9 |
| Queensland | $1,130,600 | $2,039.70 | $106,064 | 10.7 |
| Western Australia | $1,123,700 | $2,227.40 | $115,825 | 9.7 |
| South Australia | $979,600 | $1,970.20 | $102,450 | 9.6 |
| Victoria | $918,400 | $2,041.10 | $106,137 | 8.7 |
| Australian Capital Territory | $981,700 | $2,290.20 | $119,090 | 8.2 |
| Tasmania | $733,200 | $1,846.30 | $96,008 | 7.6 |
| Northern Territory | $614,4002 | $1,984.103 | $103,173 | 6.0 |
| Australia | $1,100,4002 | $2,083.703 | $108,352 | 10.2 |
Source · ABS Total Value of Dwellings, June Quarter 2026; ABS Average Weekly Earnings, Australia, May 2026, Tables 3 and 13a to 13h.
Section 03 · OECD ranking
How does Australia's house price-to-income ratio rank among OECD countries?
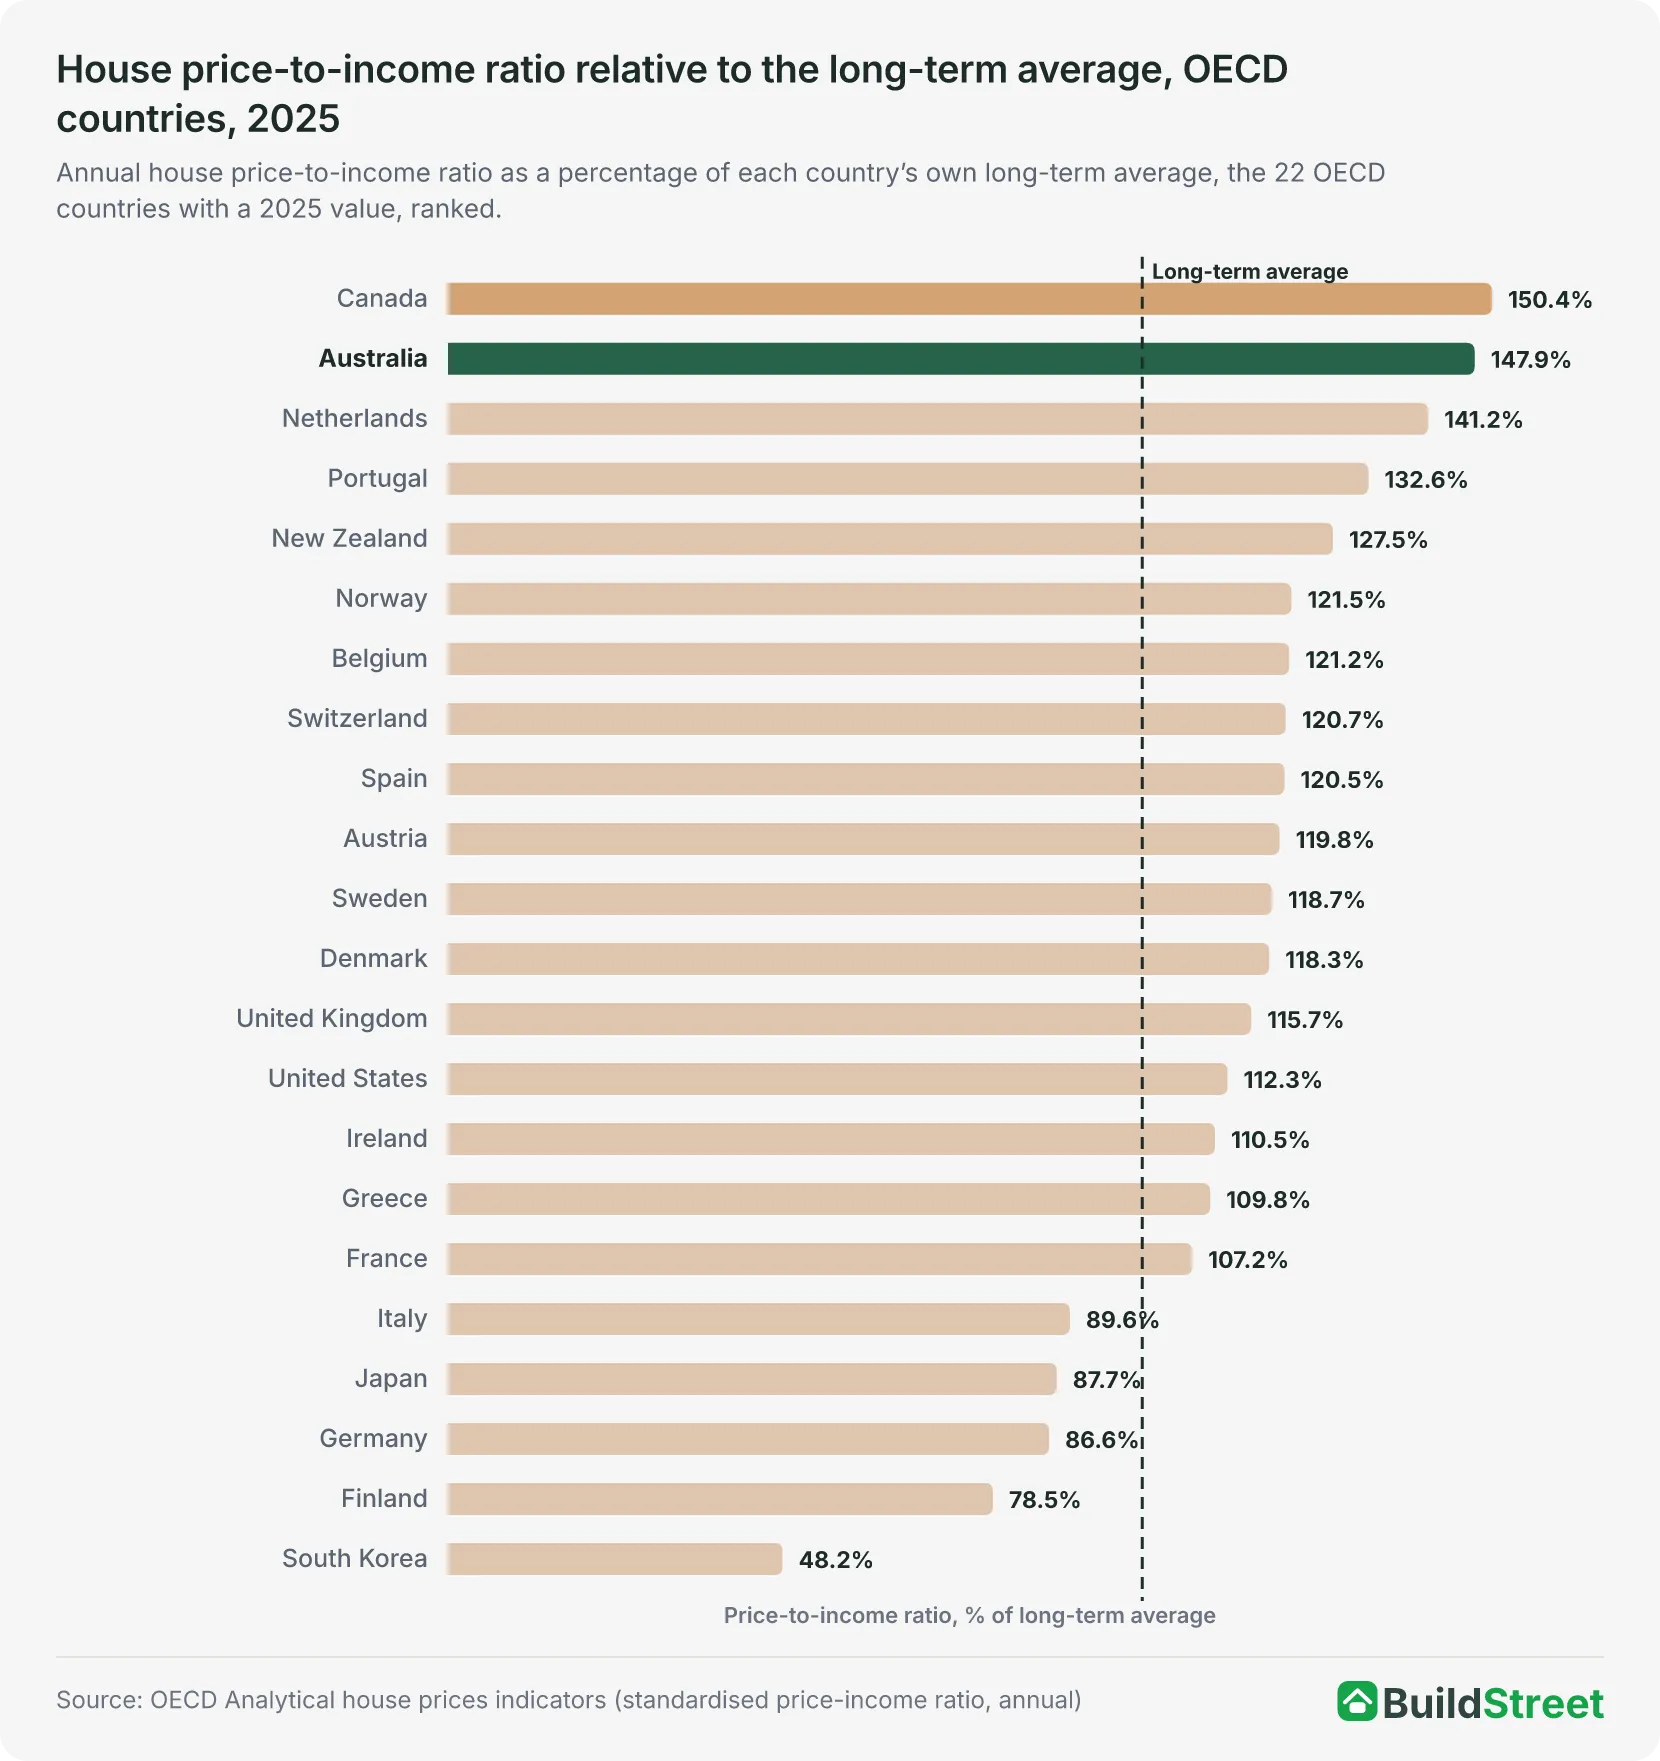
Australia recorded the second-highest house price-to-income ratio relative to its long-term average among the 22 OECD countries with data for 2025, at 147.9 per cent, after Canada at 150.4 per cent1. The Netherlands was third, at 141.2 per cent, and Portugal was fourth, at 132.6 per cent.
The OECD average house price-to-income ratio was 107.6 per cent of its long-term average in 2025. Italy, Japan, Germany, Finland and South Korea were the only five of the 22 countries below their long-term averages. South Korea recorded the lowest ratio, at 48.2 per cent, followed by Finland at 78.5 per cent1. South Korea's series starts in 1986, when its ratio was at its highest, so its low value shows how far the ratio has fallen since then rather than how its house prices compare with other countries.
In the March quarter 2026, Australia recorded the highest house price-to-income ratio relative to its long-term average among the 20 OECD countries with data for that quarter, at 154.1 per cent1. Canada's ratio fell in every quarter, from 155.0 per cent in the March quarter 2025 to 144.6 per cent in the March quarter 2026. Portugal's ratio rose from 125.6 per cent to 142.0 per cent over the same period.
Other measures of housing affordability across countries, including housing costs as a share of income for owners, are compared in How does housing affordability in Australia compare internationally?
Section 04 · Europe
How do price-to-income ratios in Poland, Portugal, Spain and Greece compare with Australia's?
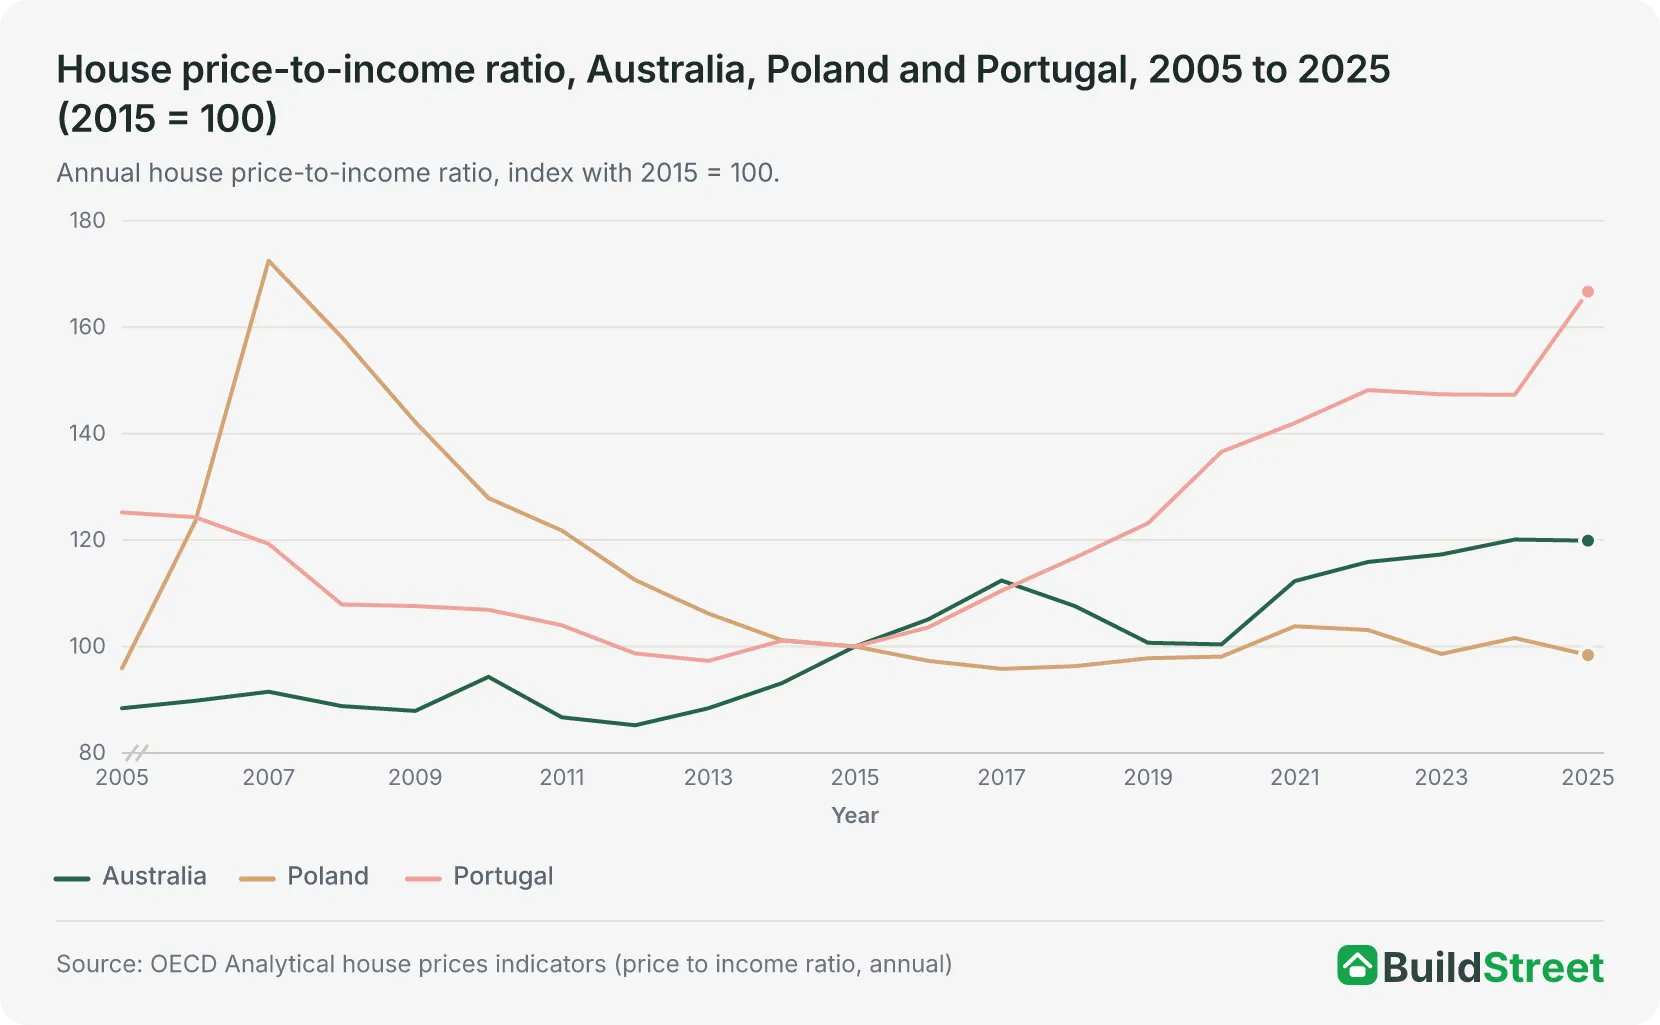
Poland's house price-to-income ratio fell 23.0 per cent between 2010 and 2025, from 127.9 to 98.4 on an index where 2015 equals 100. Australia's ratio rose 27.0 per cent over the same period1.
Poland recorded its highest annual ratio between 2005 and 2025 in 2007, at 172.5. The ratio remained between 95.8 and 103.8 from 2015 to 20251.
The OECD does not publish Poland's ratio relative to a long-term average1, so Poland cannot be included in the ranking of 22 countries.
Portugal recorded the largest increase among Poland, Portugal, Spain and Greece, with its ratio rising from 106.9 in 2010 to 166.7 in 2025, an increase of 56.0 per cent1. Spain's ratio fell 6.6 per cent, from 134.7 in 2010 to 125.9 in 2025. Greece's ratio rose 1.5 per cent, from 117.5 to 119.2.
| House price-to-income ratio, Australia and four European countries, 2010 to 2025 | ||||
|---|---|---|---|---|
| Country | 2010 (2015 = 100) | 2025 (2015 = 100) | Change, 2010 to 2025 | % of long-term average, 2025 |
| Australia | 94.31 | 119.91 | +27.0%1 | 147.91 |
| Poland | 127.91 | 98.41 | −23.0%1 | Not published |
| Portugal | 106.91 | 166.71 | +56.0%1 | 132.61 |
| Spain | 134.71 | 125.91 | −6.6%1 | 120.51 |
| Greece | 117.51 | 119.21 | +1.5%1 | 109.81 |
| OECD aggregate | 101.31 | 114.01 | +12.6%1 | 107.61 |
Source · OECD Analytical house prices indicators (dataset last updated 7 October 2026).
In 2025, the ratios of Portugal, Spain and Greece were 132.6, 120.5 and 109.8 per cent of their long-term averages, respectively, compared with 147.9 per cent for Australia1.
The cost of living, housing and residency rules for Australians in these four countries are covered in Living in Poland, Portugal, Greece and Spain.
Section 05 · Rents
What share of household income goes on rent in Australia and other OECD countries?
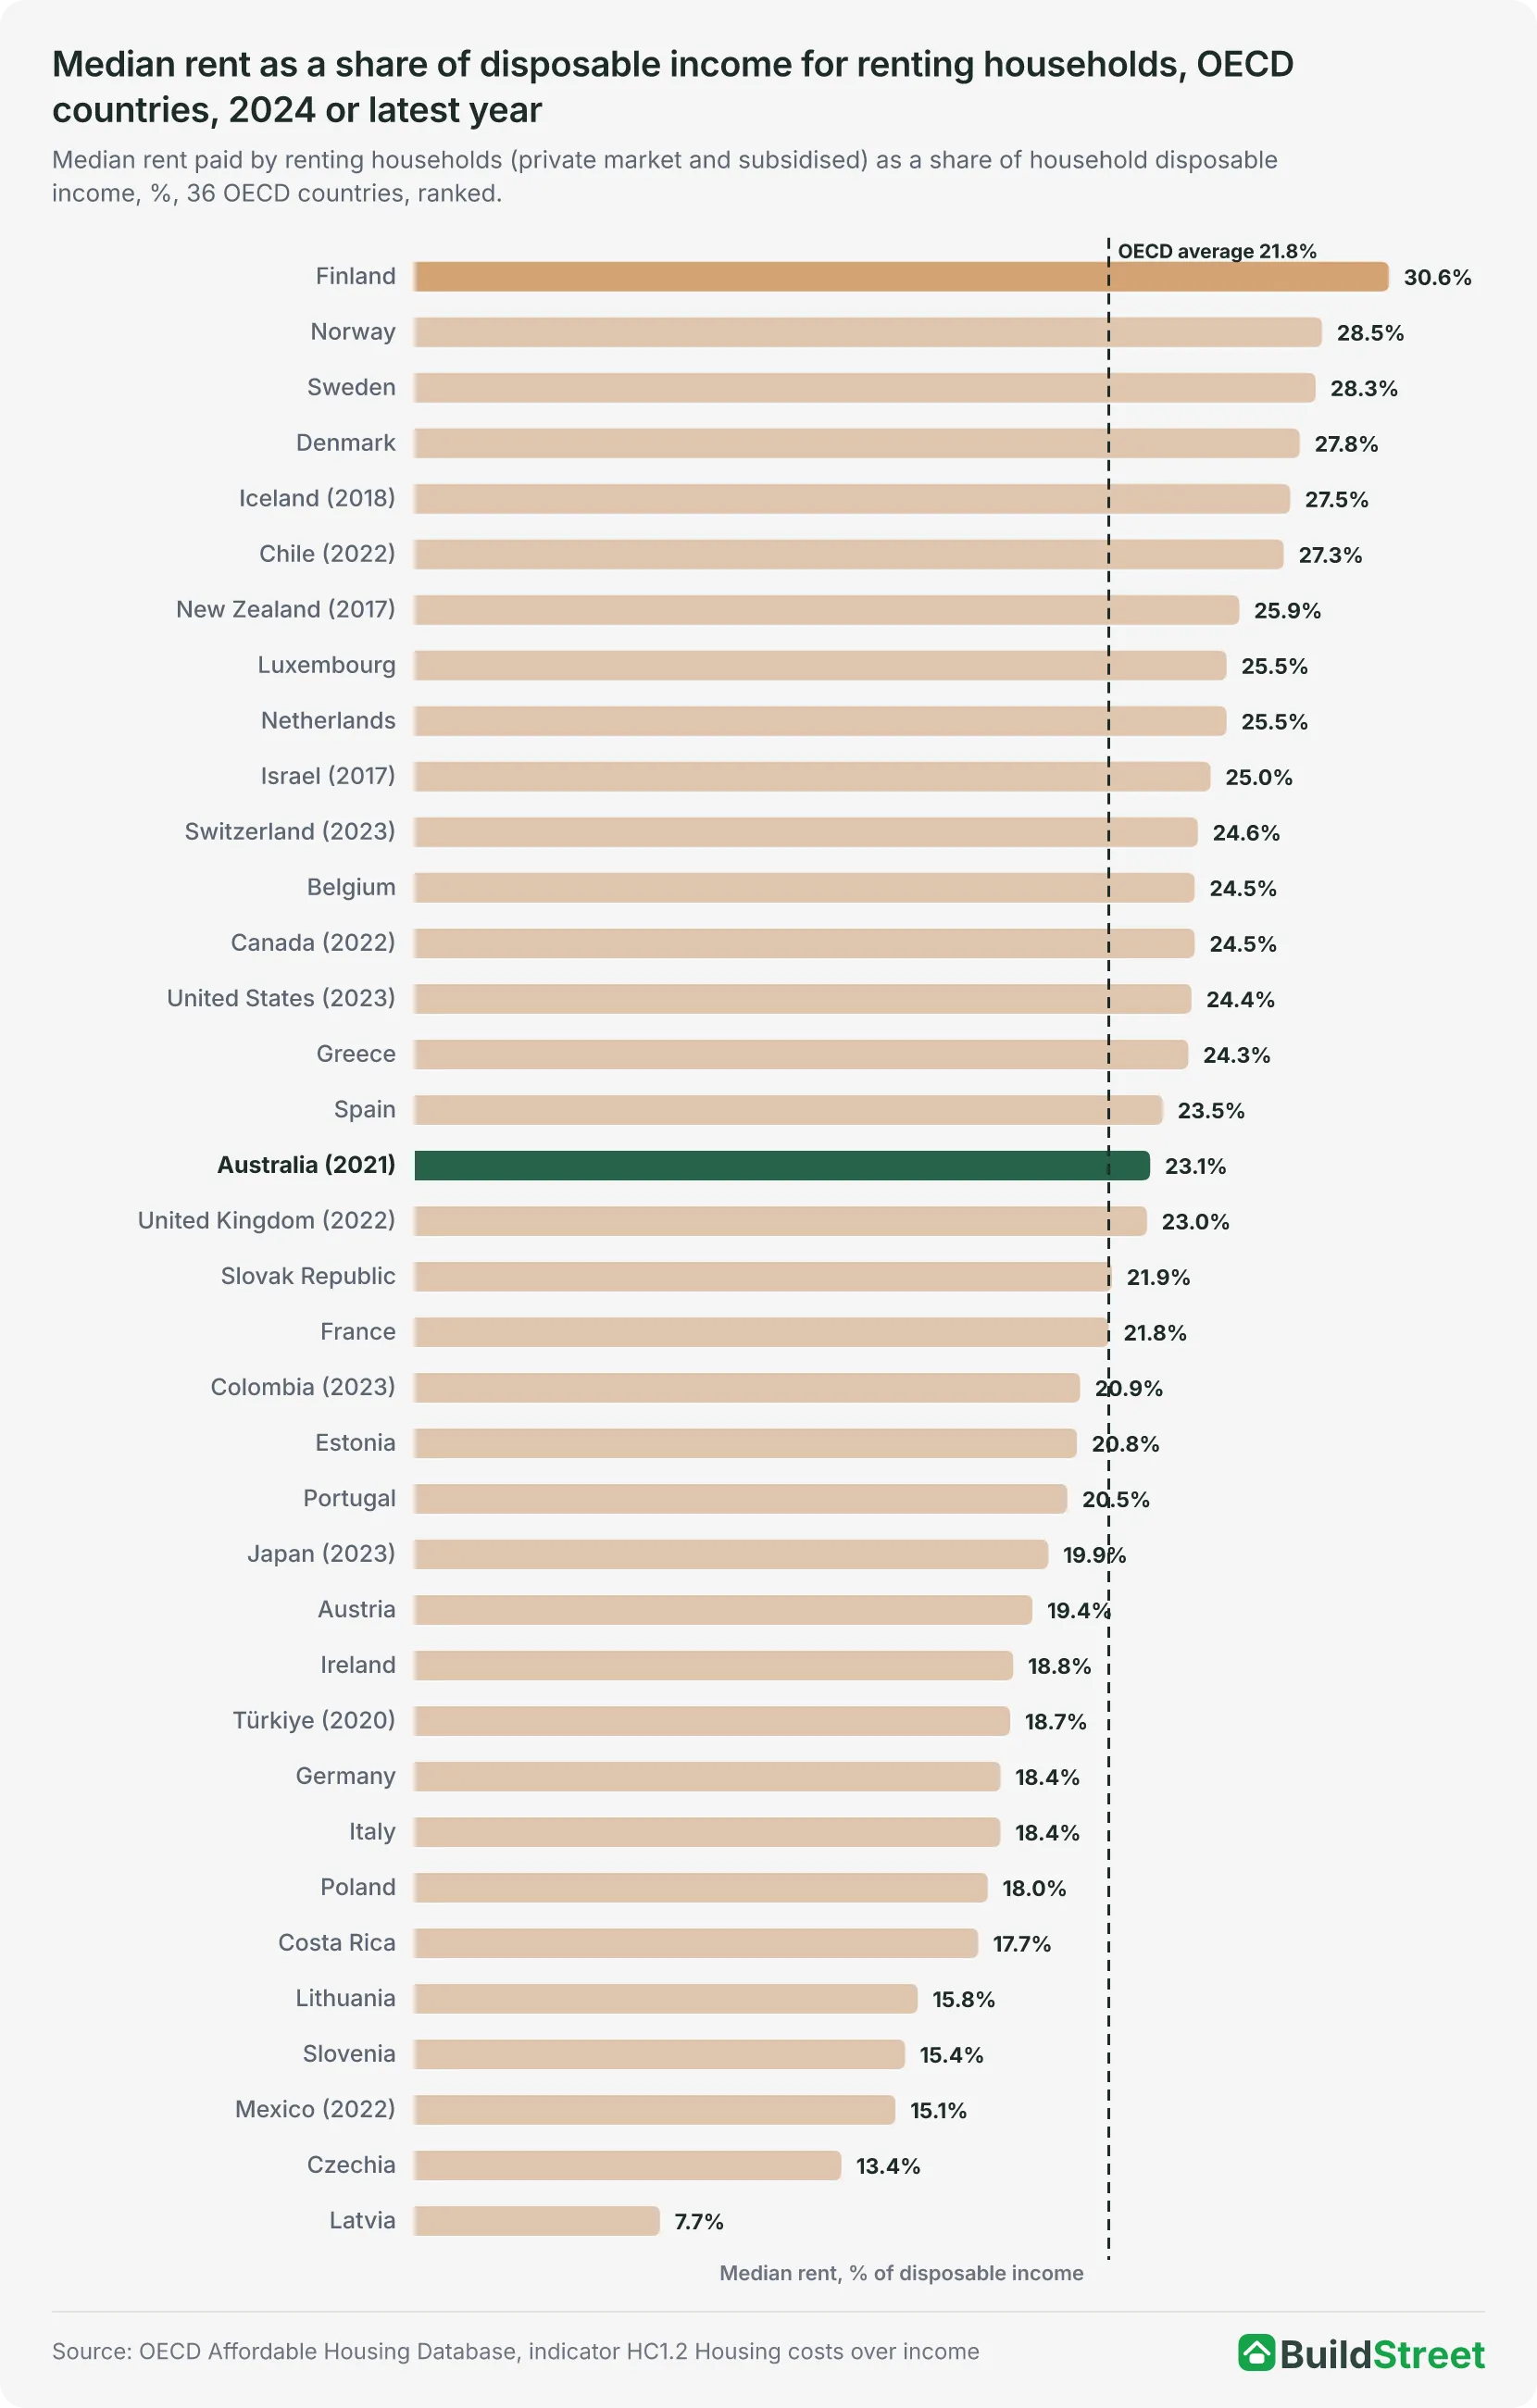
Renting households in Australia spent a median of 23.1 per cent of their disposable income on rent in 2021, compared with an OECD average of 21.8 per cent, according to the OECD Affordable Housing Database4. Australia recorded the 17th-highest median rent share among the 36 OECD countries with data.
Finland recorded the highest median rent share among the 36 countries, at 30.6 per cent in 2024. Latvia recorded the lowest, at 7.7 per cent4. In 2024, the median was 24.3 per cent in Greece, 23.5 per cent in Spain, 20.5 per cent in Portugal and 18.0 per cent in Poland.
The OECD figures come from household surveys conducted in different years, including 2021 for Australia, 2017 for New Zealand and Israel, and 2024 for most European countries. The OECD does not publish margins of error for these figures.
Australia's median rent share was 23.1 per cent in both 2010 and 2021, rising to 25.1 per cent in 2017 and 20184.
Rent burdens, the 40 per cent housing-cost overburden rate and capital-city housing costs are compared across several measures on a separate page.
Section 06 · Since 2010
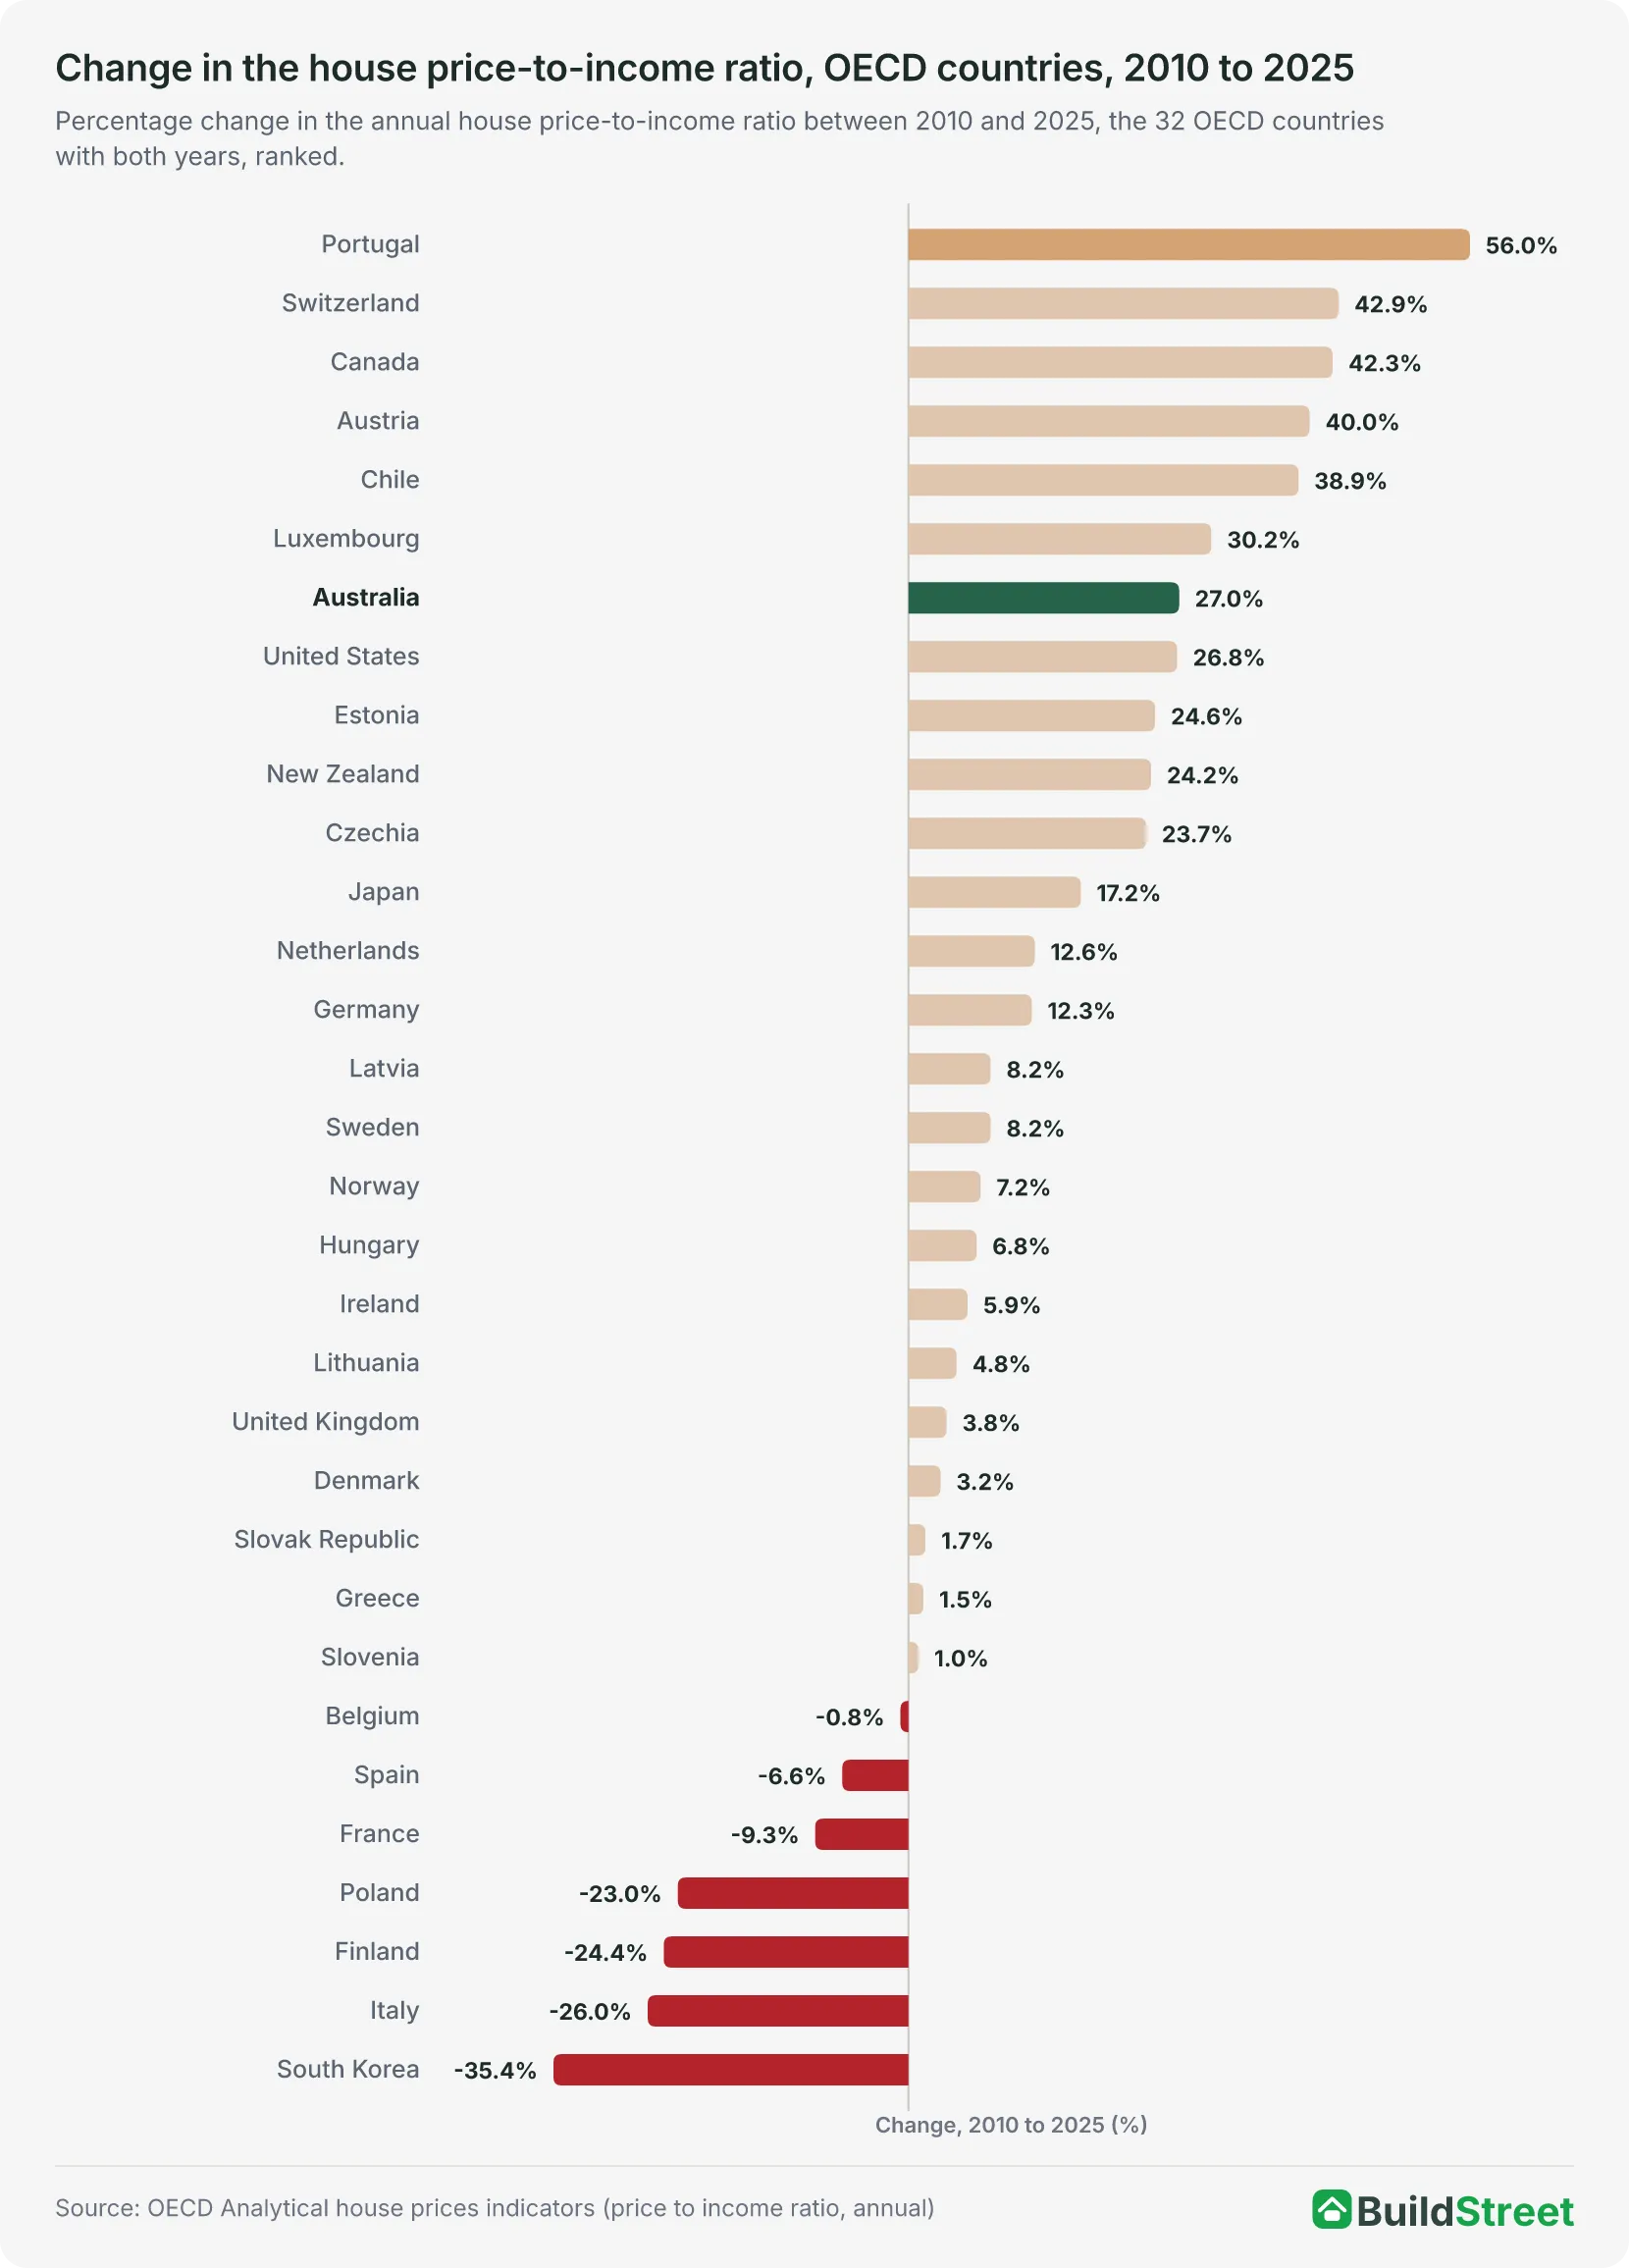
Which OECD countries' house price-to-income ratios have risen most since 2010?
Portugal recorded the largest increase in its house price-to-income ratio among the 32 OECD countries with data for both 2010 and 2025, at 56.0 per cent, followed by Switzerland at 42.9 per cent and Canada at 42.3 per cent1.
Australia's ratio rose 27.0 per cent, from 94.3 in 2010 to 119.9 in 2025, making it the seventh-largest increase among the 32 OECD countries1. The OECD aggregate ratio rose 12.6 per cent, from 101.3 in 2010 to 114.0 in 2025.
South Korea recorded the largest fall in its ratio among the 32 countries, at 35.4 per cent, followed by Italy at 26.0 per cent, Finland at 24.4 per cent and Poland at 23.0 per cent1. Of the 32 countries, seven had a lower ratio in 2025 than in 2010.
Section 07 · The limits
What are the limits of comparing price-to-income ratios between countries?
The OECD's house price-to-income ratios do not show which country has the highest house prices relative to income. Each ratio measures changes against a country's own history rather than actual price levels1. A ratio of 150 in two countries means both ratios are 50 per cent above their own long-term averages, not that homes cost the same number of years of income.
Four other limitations affect comparisons between countries
- Housing data differs between countries. The Bank for International Settlements (BIS), which collects national residential property price data, uses figures that cover as much of each country as possible. Most countries include new and existing homes of all types, but coverage differs5.
- Income figures do not represent individual buyers. The OECD uses household disposable income per person, not the income of homebuyers or a typical household. The ratio therefore cannot show what an individual buyer can afford.
- Some countries are not covered. The OECD does not provide house price-to-income ratios for Malaysia or Thailand. The BIS publishes house price data and changes over time for both countries, but not comparable price-to-income ratios5.
- Australia's years-of-earnings calculation uses a different measure. The Australian figure compares the mean dwelling price with one full-time adult's earnings before tax, rather than household income. It is an illustrative calculation and cannot be directly compared with the OECD or BIS figures for other countries.
Section 08 · Common questions
Frequently asked questions
How high is Australia's house price-to-income ratio compared with its long-term average?
Australia's house price-to-income ratio was 154.1 per cent of its long-term average in the March quarter 2026, the highest level since 1970, according to the Organisation for Economic Co-operation and Development (OECD). Using 2015 as a starting point of 100, the ratio was 124.9, meaning house prices relative to disposable income per person were 24.9 per cent higher than in 2015.
How many years of full-time earnings does the mean dwelling price in Australia equal?
The mean dwelling price in Australia was equal to 10.2 years of full-time adult ordinary time earnings before tax in 2026, based on Australian Bureau of Statistics (ABS) figures for the June quarter 2026 price and May 2026 earnings. This is an illustrative calculation rather than an official affordability measure, and it uses one person's earnings rather than household income.
Which OECD country has the highest house price-to-income ratio relative to its long-term average?
Canada recorded the highest house price-to-income ratio relative to its long-term average among 22 OECD countries in 2025, at 150.4 per cent, with Australia second at 147.9 per cent. In the March quarter 2026, Australia recorded the highest house price-to-income ratio relative to its long-term average among the 20 OECD countries with data for that quarter, at 154.1 per cent.
How does Poland's house price-to-income ratio compare with Australia's?
Poland's house price-to-income ratio fell 23.0 per cent between 2010 and 2025, while Australia's rose 27.0 per cent, according to the OECD. These figures measure changes in house prices relative to incomes over time. They do not show whether homes cost more years of income in Poland or Australia.
How much of their income do renting households in Australia spend on rent?
Renting households in Australia spent a median of 23.1 per cent of their disposable income on rent in 2021, according to the OECD Affordable Housing Database, compared with an OECD average of 21.8 per cent. In Poland, the median was 18.0 per cent in 2024.
Do house price-to-income ratios show how many years of income a home costs?
The OECD's house price-to-income ratios do not show how many years of income a home costs, because each is an index that compares a country with its own past. National house price data also cover different types of homes in different countries, which limits comparisons.
References
- OECD Analytical house price indicators, dataflow DSD_AN_HOUSE_PRICES (price-to-income, series HPI_YDH and HPI_YDH_AVG) · sdmx.oecd.org ↑ b c d e f g h i j k l m n o p q r s t u v w x y z a2 b2 c2 d2 e2 f2 g2 h2 i2 j2 k2 l2 m2 n2 o2 p2 q2 r2 s2 t2 u2 v2 w2 x2 y2 z2 a3 b3 c3
- ABS Total Value of Dwellings, June quarter 2026 (Cat. 6432.0) · Australian Bureau of Statistics ↑ b c d e
- ABS Average Weekly Earnings, Australia, May 2026 · Australian Bureau of Statistics ↑ b c d e
- OECD Affordable Housing Database, indicator HC1.2 Housing costs over income · webfs.oecd.org ↑ b c
- BIS, Selected residential property prices · data.bis.org ↑ b
