

Published 24 July 2026
At the 2021 Census, 848,162 people were recorded as group-household members, and 361,822 group households were counted, equal to 3.9% of classified households, down from 4.3% in 2016. Group-household living was most common among people aged 15 to 34, especially those aged 25 to 34, with the highest rates in Greater Darwin among the capital cities and in inner-city SA2 areas nationally.
The number of older residents in group households has also grown, rising by 53.8% among people aged 55 and over between 2011 and 2021. The average number of adults per Australian household rose to 2.10 in 2024–25, up from a recent low of 2.05 in 2021–22, according to the National Housing Supply and Affordability Council (NHSAC).
 What is driving housing demand in Australia in 2026? Population, migration and household formationNew household formation in Australia is projected to exceed net new housing supply by 24,000 dwellings in 2025–26, down from a 78,000-dwelling gap two years earlier, according to the National Housing…
 Australia's average household size: what smaller households mean for housing demandAustralia's average household size was 2.5 people in the 2021 Census, down from 2.6 in 2016 after remaining at 2.6 across the previous four Censuses. The RBA's survey-based measure recorded a historic…
Section 01 · The national picture
How many people in Australia live in group households?
At the 2021 Census, 848,162 people were classified as group-household members, counted at their usual address. Separately, 361,822 group households were recorded based on where people were on Census night, equal to 3.9% of all classified occupied private households. Group-household members accounted for 3.6% of all people living in occupied private dwellings nationally.
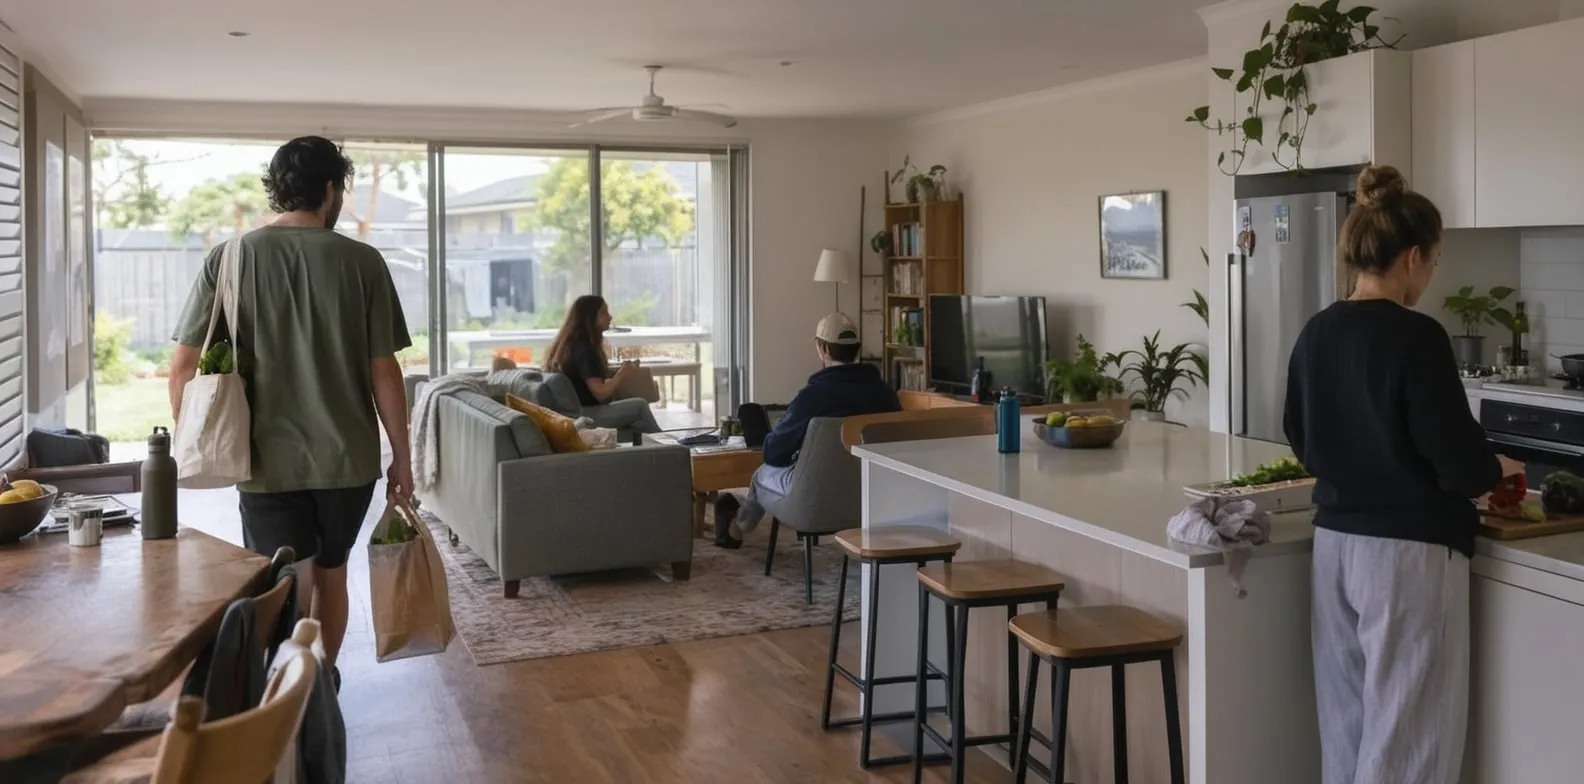
The Australian Bureau of Statistics (ABS) defines a group household as two or more unrelated people, all aged 15 or over, sharing a dwelling with no couple, parent-child or other family relationship between them. An unrelated boarder or flatmate living inside an otherwise family household is still classified under that family's household type rather than as a group household. These figures therefore capture only people specifically classified as group-household members, rather than everyone renting a room or sharing accommodation.
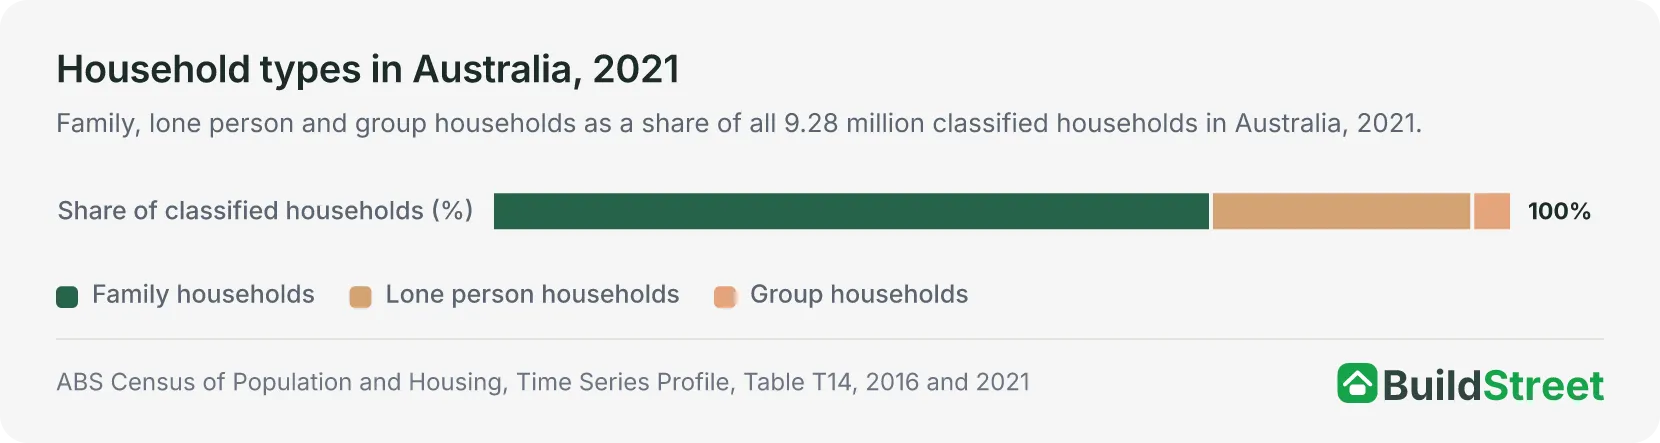
The person and household counts above use different counting methods: people are counted by usual address, while households are counted by Census-night location. The two figures therefore cannot be divided to calculate an average group-household size. A separate ABS estimate places the average at approximately 2.3 people per group household in 2021.
There were more group households in 2021 than in 2011, but their share of all classified households fell over the same period, from 4.1% to 3.9%.
Section 02 · The twenty-year trend
How group households in Australia have changed since 2001
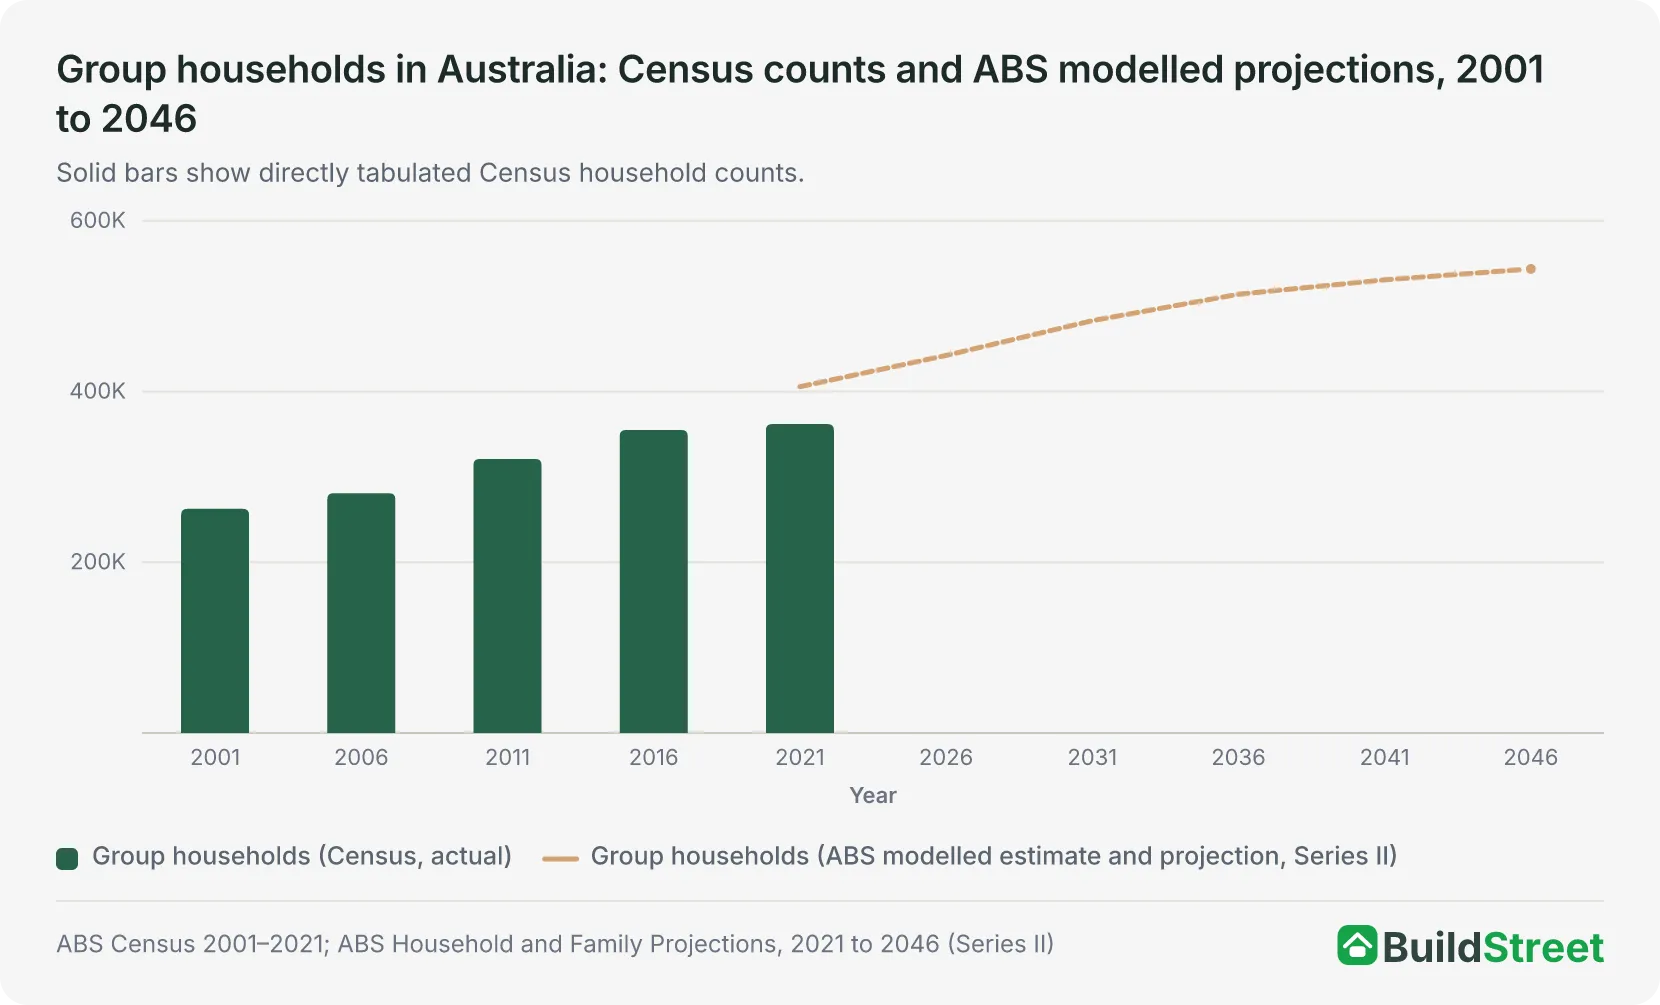
The number of group households has increased at every Census since 2001, from 262,551 that year to 280,856 in 2006, 321,007 in 2011, 354,911 in 2016 and 361,822 in 2021.
Using a consistent method that includes only family, lone-person and group households, group households made up approximately 3.9% of all households in both 2001 and 2006. The share rose to 4.1% in 2011 and 4.3% in 2016, before falling to 3.9% in 2021.
The ABS's published figures for 2001 and 2006 show a lower rate of 3.7% because they were calculated using a wider base that also includes visitor-only and other uncategorised households. When recalculated using the narrower, consistent household base, the 1996 rate was approximately 4.2%, only slightly higher than the 2021 rate of 3.9%. The officially published 1996 figure also uses the wider base.
| Year | Group households | Basis/status | Group-household members – usual residence | Group-household share or recalculated share |
|---|---|---|---|---|
| 2001 | 262,551 | Census, place of enumeration | – | 3.9% |
| 2006 | 280,856 | Census, place of enumeration | – | 3.9% |
| 2011 | 321,007 | Census, place of enumeration | 716,332 | 4.1% |
| 2016 | 354,911 | Census, place of enumeration | 825,383 | 4.3% |
| 2021 | 361,822 | Census, place of enumeration | 848,162 | 3.9% |
| 2021 (modelled base) | 405,672 | ABS projection framework | – | 4.1% |
| 2026 (projected) | 442,274 | ABS projection framework | – | 4.1% |
| 2031 (projected) | 483,016 | ABS projection framework | – | 4.2% |
| 2036 (projected) | 514,016 | ABS projection framework | – | 4.2% |
| 2041 (projected) | 530,882 | ABS projection framework | – | 4.1% |
| 2046 (projected) | 543,688 | ABS projection framework | – | 4.0% |
2021 is the most recent Census and the latest year with an actual, measured group household count. The next Census will be held on 11 August 2026, with results released in phases from June 2027.
Section 03 · Age groups
Which age groups are most likely to live in a group household?
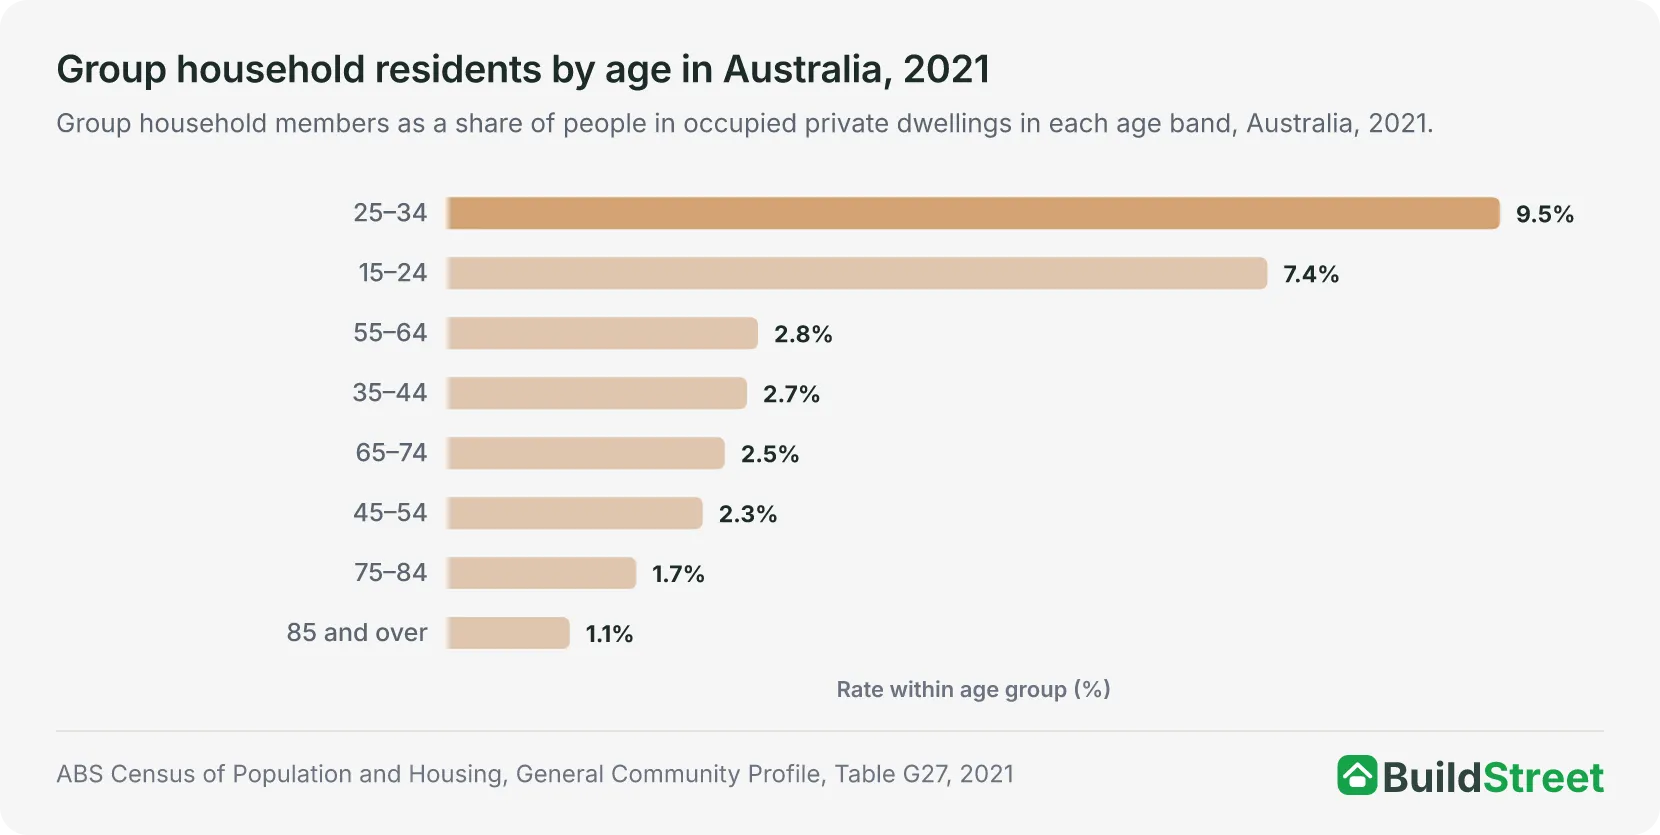
People aged 25 to 34 had both the largest number and the highest rate of group-household membership in 2021. A total of 318,009 people in that age band were group household members, equal to 9.5% of people aged 25 to 34 living in occupied private dwellings.
People aged 15 to 24 had the second-highest rate, at 7.4%. Together, people aged 15 to 34 accounted for 62.0% of group-household members, despite representing only about 26% of people living in occupied private dwellings.
The rate fell to 2.7% among people aged 35 to 44, but group-household living was recorded across every older age group. This included people aged 85 and over.
| Age group | Group household residents, 2021 | Rate within age group | Share of all group household residents |
|---|---|---|---|
| 15–24 | 208,052 | 7.4% | 24.5% |
| 25–34 | 318,009 | 9.5% | 37.5% |
| 35–44 | 88,732 | 2.7% | 10.5% |
| 45–54 | 70,926 | 2.3% | 8.4% |
| 55–64 | 79,331 | 2.8% | 9.4% |
| 65–74 | 57,200 | 2.5% | 6.7% |
| 75–84 | 21,374 | 1.7% | 2.5% |
| 85 and over | 4,528 | 1.1% | 0.5% |
| Total | 848,162 | 3.6% | 100% |
People aged 0–14 are not applicable to this table, since a group household by definition contains only people aged 15 and over. The total rate of 3.6% uses all people in occupied private dwellings, including people aged 0–14, in the denominator. It therefore cannot be calculated as a weighted total using only the age groups shown in the table.
The age rows sum to 848,152, 10 fewer than the separately published total of 848,162; this small difference reflects the ABS's random adjustment of individual Census cells. Source: ABS Census of Population and Housing, General Community Profile, Table G27, 2021.
Section 04 · Capital cities and SA2 areas
Where are group households most common in Australia?
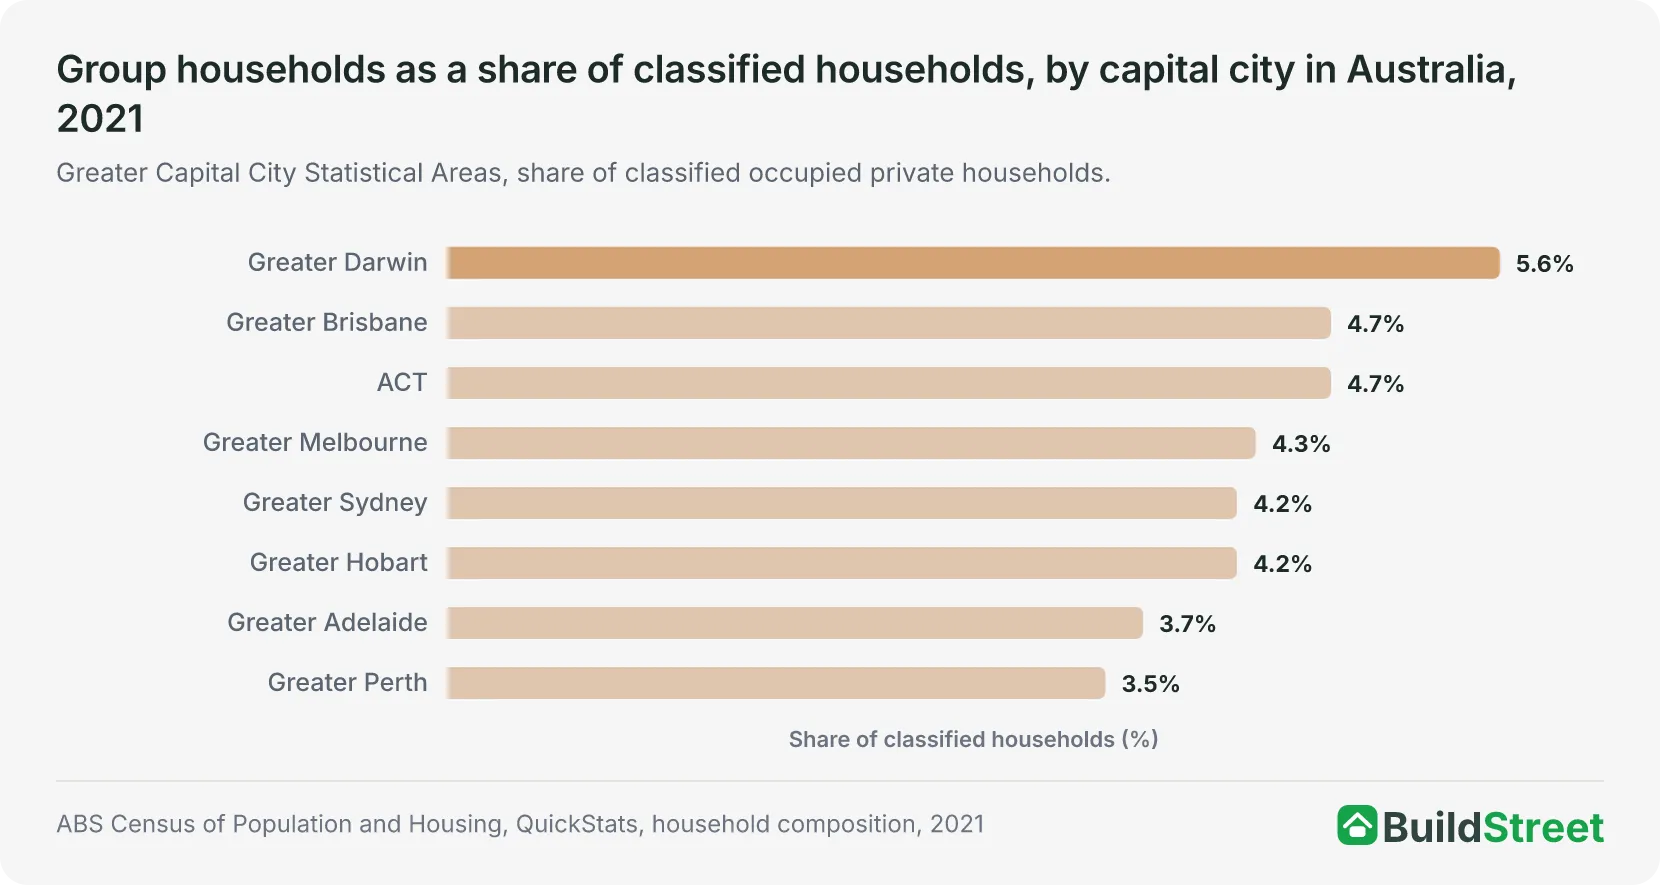
Greater Darwin had the highest group-household rate of any capital city in 2021, at 5.6% of classified occupied private households, followed by Greater Brisbane and the Australian Capital Territory, both at 4.7%. Greater Perth had the lowest rate among the capitals, at 3.5%.
In every state or territory with a separately defined rest-of-state area, the capital-city rate was higher than the rate outside the capital. This indicates that group households accounted for a larger share of classified households in metropolitan areas than in the rest of each state or territory.
The data do not identify tenure, lease type or rental-market participation, so they do not explain why that gap exists.
Which Australian capital city has the highest group-household rate?
Group households made up 4.3% of classified households in Greater Melbourne in 2021, equal to 76,606 households. Melbourne, Sydney and Brisbane together accounted for 195,595 group households, or 54.1% of the national total, although their group-household rates differed.
- Greater Darwin: 5.6%
- Greater Brisbane: 4.7%
- Australian Capital Territory: 4.7%
- Greater Melbourne: 4.3% (76,606 households)
- Greater Sydney: 4.2% (76,558 households)
- Greater Hobart: 4.2%
- Greater Adelaide: 3.7%
- Greater Perth: 3.5%
| Capital city / area | Group households, 2021 | Share of classified households |
|---|---|---|
| Greater Darwin | 2,654 | 5.6% |
| Greater Brisbane | 42,431 | 4.7% |
| Australian Capital Territory | 7,850 | 4.7% |
| Greater Melbourne | 76,606 | 4.3% |
| Greater Sydney | 76,558 | 4.2% |
| Greater Hobart | 4,007 | 4.2% |
| Greater Adelaide | 19,869 | 3.7% |
| Greater Perth | 27,450 | 3.5% |
| Australia | 361,822 | 3.9% |
Source · ABS Census of Population and Housing, General Community Profile, Table G27, 2021.
Which state or territory has the highest group-household rate?
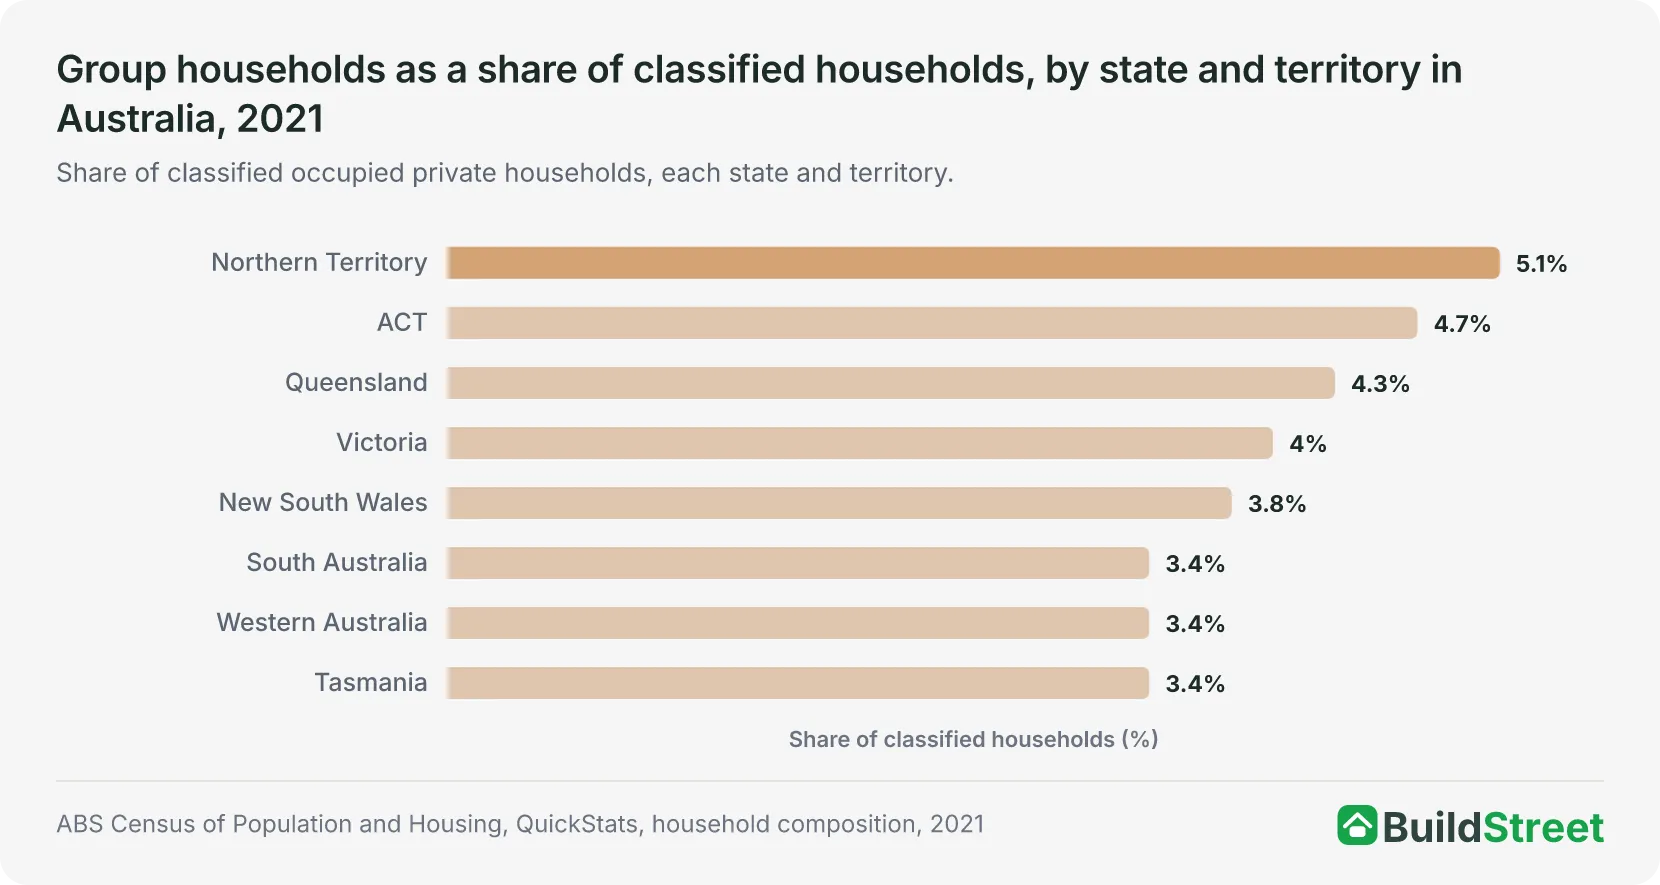
The Northern Territory had the highest group-household rate of any state or territory in 2021, at 5.1%, followed by the ACT at 4.7%. South Australia, Western Australia and Tasmania were tied for the lowest published rate, at 3.4%.
Tasmania stands out as the only jurisdiction where the published rate rose between 2016 and 2021, from 3.3% to 3.4%. Rates fell everywhere else. Over the same period, lone-person households increased by around 17% nationally, compared with growth of roughly 2% for group households.
| State / territory | Group households, 2021 | Rate, 2021 | Group households, 2016 | Rate, 2016 |
|---|---|---|---|---|
| Northern Territory | 3,605 | 5.1% | 3,441 | 5.3% |
| Australian Capital Territory | 7,850 | 4.7% | 6,937 | 4.9% |
| Queensland | 80,576 | 4.3% | 77,899 | 4.7% |
| Victoria | 94,559 | 4.0% | 95,585 | 4.5% |
| New South Wales | 111,646 | 3.8% | 109,005 | 4.2% |
| South Australia | 23,542 | 3.4% | 22,855 | 3.6% |
| Western Australia | 32,591 | 3.4% | 32,690 | 3.8% |
| Tasmania | 7,429 | 3.4% | 6,491 | 3.3% |
| Australia | 361,822 | 3.9% | 354,911 | 4.3% |
Source · ABS Census of Population and Housing, QuickStats, household composition, 2021 and 2016.
How do group-household rates compare between capital cities and the rest of each state?
The gap between capital-city and rest-of-state group-household rates is widest in the Northern Territory, at 1.5 percentage points. Every jurisdiction with a separately defined rest-of-state area recorded a higher group-household rate in its capital city.
- Northern Territory (Greater Darwin 5.6% vs rest 4.1%): +1.5 points
- Tasmania (Greater Hobart 4.2% vs rest 2.8%): +1.4 points
- Victoria (Greater Melbourne 4.3% vs rest 2.9%): +1.4 points
- South Australia (Greater Adelaide 3.7% vs rest 2.4%): +1.3 points
- New South Wales (Greater Sydney 4.2% vs rest 3.3%): +0.9 points
- Western Australia (Greater Perth 3.5% vs rest 2.8%): +0.8 points
- Queensland (Greater Brisbane 4.7% vs rest 4.0%): +0.7 points
| State | Capital city (GCCSA) | Capital city rate | Rest-of-state rate | Gap calculated from unrounded rates (percentage points) |
|---|---|---|---|---|
| Northern Territory | Greater Darwin | 5.6% | 4.1% | +1.5 |
| Tasmania | Greater Hobart | 4.2% | 2.8% | +1.4 |
| Victoria | Greater Melbourne | 4.3% | 2.9% | +1.4 |
| South Australia | Greater Adelaide | 3.7% | 2.4% | +1.3 |
| New South Wales | Greater Sydney | 4.2% | 3.3% | +0.9 |
| Western Australia | Greater Perth | 3.5% | 2.8% | +0.8 |
| Queensland | Greater Brisbane | 4.7% | 4.0% | +0.7 |
The ACT is not divided into separate capital-city and rest-of-territory regions in this ABS geographic framework, so it is excluded from this comparison. Rest-of-state group-household counts and classified-household denominators were calculated by subtracting each GCCSA value from the corresponding state value. The residual group-household count was then divided by the residual classified-household total. These are derived calculations rather than directly published ABS rates.
Gaps are calculated from unrounded rates before rounding to one decimal place, so they may differ slightly from subtracting the two rounded percentages shown. Because the state and GCCSA values are independently subjected to ABS random adjustment, the derived rest-of-state rates are approximate. Source: ABS Census of Population and Housing, QuickStats, household composition, 2021.
Which Australian SA2 areas have the highest group-household rates?
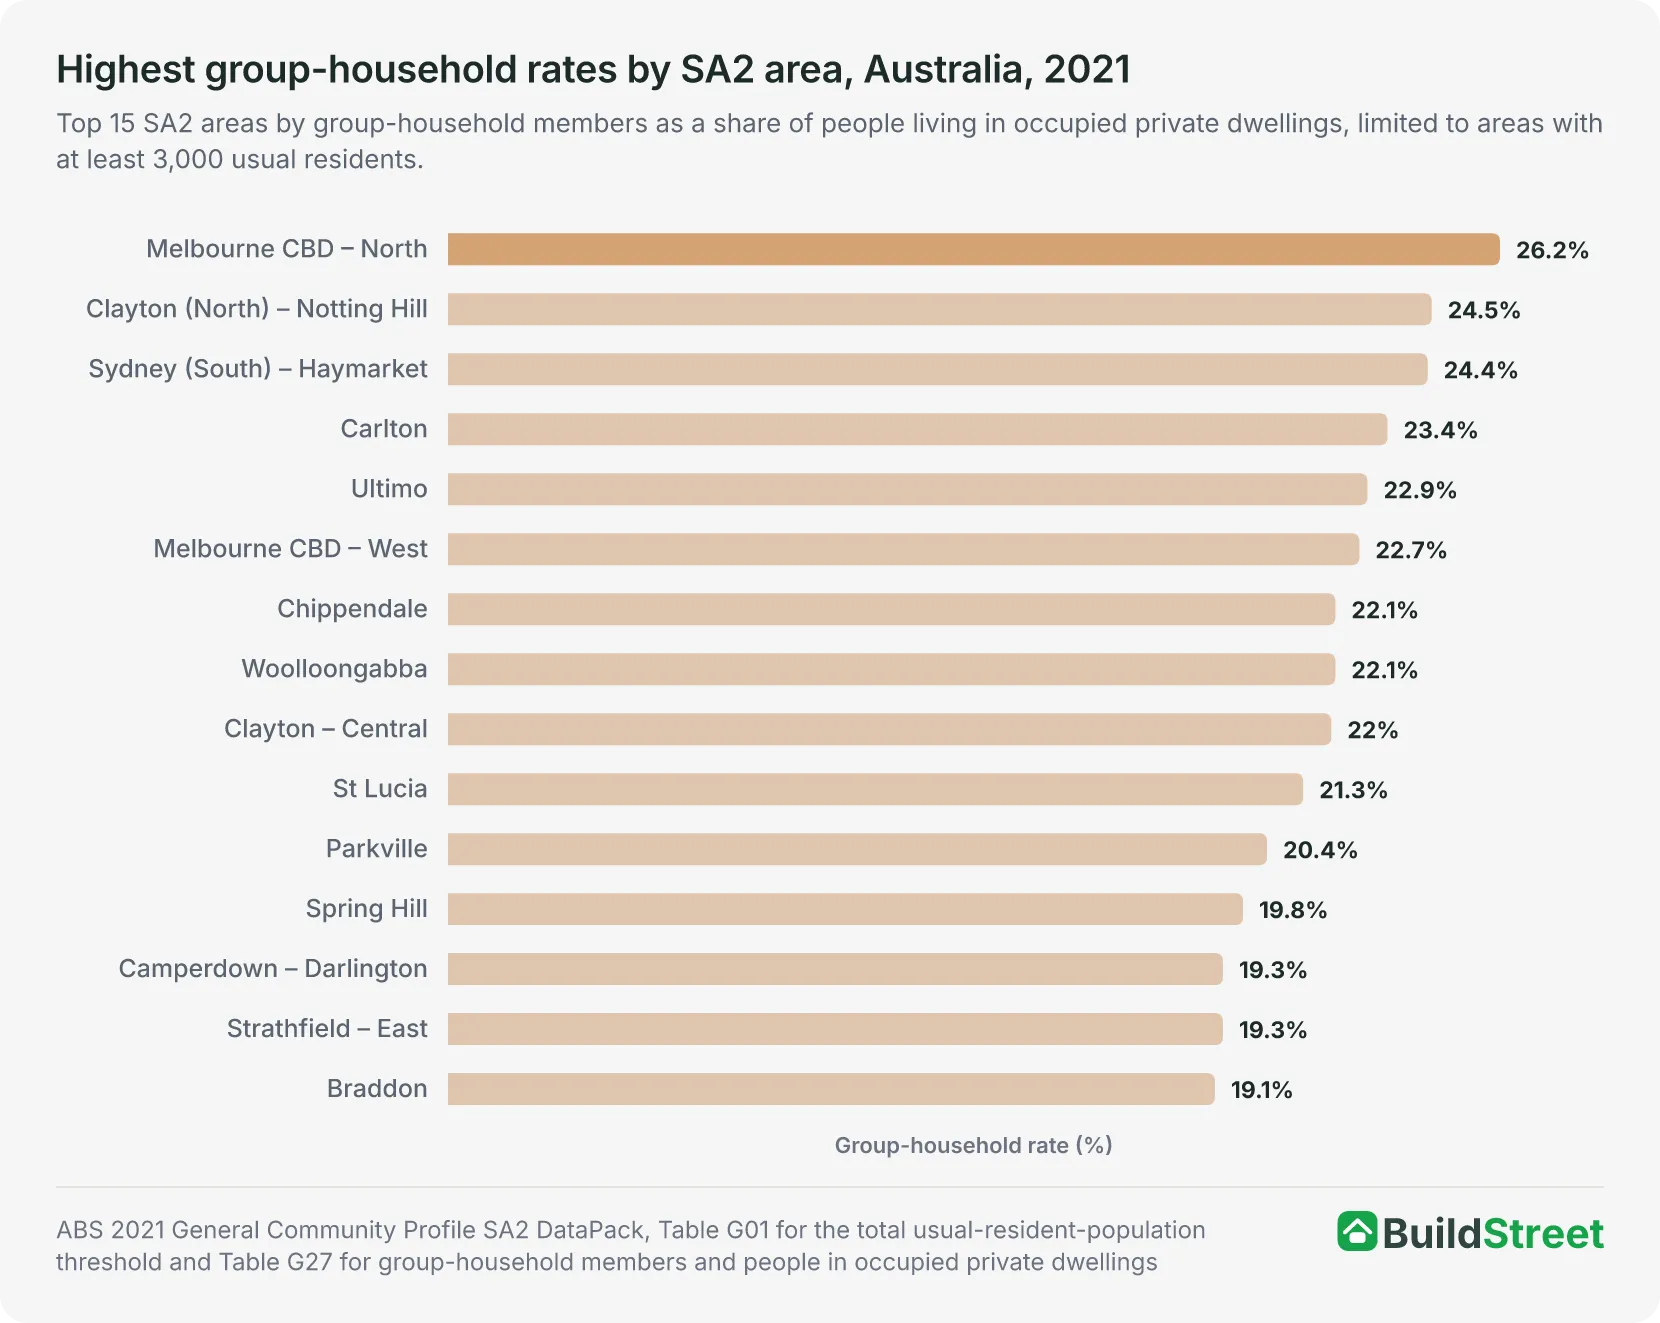
Melbourne CBD – North had the highest group-household rate of any SA2 area with at least 3,000 residents in 2021, at 26.2% of people in occupied private dwellings living in a group household, followed by Clayton (North) – Notting Hill at 24.5% and Sydney's Haymarket at 24.4%.
The ranking covers 2,177 Statistical Area Level 2 (SA2) areas in Australia with at least 3,000 residents. It shows that group-household rates can vary considerably within the same capital city and may be much higher in individual neighbourhoods than the broader city-level rate. Several of the highest-ranked areas are located in inner-city districts; the data identify this geographic concentration but do not establish why the rates are high.
Section 05 · Rental affordability
How has rental affordability changed since the 2021 Census?
The share of gross annual household income a median-income household needed to pay for rent on a new lease increased from 31.3% in the December quarter of 2023 to 32.9% in the December quarter of 2024, reaching a record 33.1% in the December quarter of 2025. Rental affordability has continued to decline since the 2021 Census, according to NHSAC.
Rental stress among lower-income renter households also increased from 47% in 2020 to 54% in 2023, measured using the 30/40 rule: households in the two lowest quintiles of equivalised disposable income are classified as being in rental stress when they spend more than 30% of that income on rent.
The rental-stress figures cover a different period and use a different measure from the new-lease affordability series. They are based on separate HILDA Survey analysis reported by NHSAC.
Lower-income renter households, HILDA data through 2023
2020
- Lower-income renter households in rental stress
47%
- In severe rental stress, spending more than 50% of disposable household income on rent
17%
2023
- Lower-income renter households in rental stress
54%
- In severe rental stress, spending more than 50% of disposable household income on rent
21%
Source · NHSAC, State of the Housing System 2025, analysis of HILDA Survey data using the 30/40 and 50/40 rules, 2020 and 2023.
How has the number of adults per Australian household changed?
The average number of adults per Australian household rose from a recent financial-year low of 2.05 in 2021–22 to 2.10 in 2024–25. A separate monthly measure also reached 2.10 in July 2025, compared with 2.08 in July 2024.
NHSAC reports that this increase may reflect affordability pressures leading more adults to live together for longer. This broader household pattern includes, but is not limited to, the group households measured by the Census.
Section 06 · Older residents
How group-household living has increased among older Australians
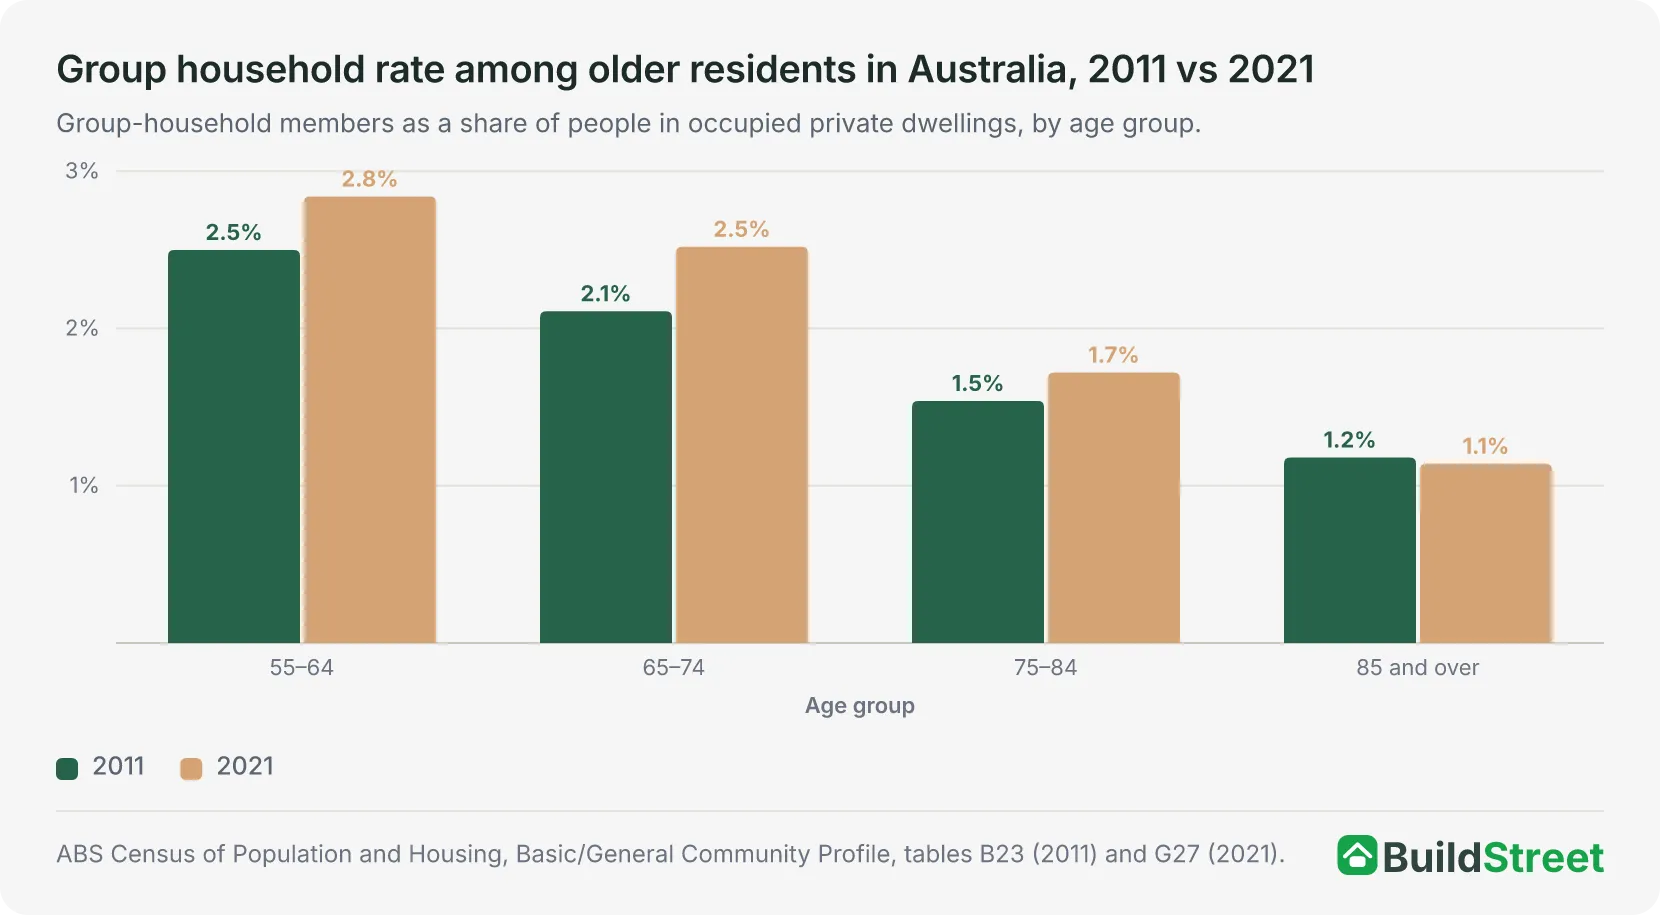
The number of residents aged 55 and over living in a group household rose from 105,606 in 2011 to 162,433 in 2021, an increase of 53.8%.
Among people aged 65 and over specifically, the number rose from 48,009 to 83,102, an increase of 73.1%.
Rates within each older age band rose more modestly than the raw counts, since Australia's older population was also growing and ageing. The only exception was the 85-and-over age group, where the rate fell slightly from 1.18% to 1.14%.
| Age group | 2011 residents | 2021 residents | Change | 2011 rate | 2021 rate |
|---|---|---|---|---|---|
| 55–64 | 57,597 | 79,331 | +37.7% | 2.50% | 2.84% |
| 65–74 | 31,356 | 57,200 | +82.4% | 2.11% | 2.52% |
| 75–84 | 13,342 | 21,374 | +60.2% | 1.54% | 1.72% |
| 85 and over | 3,311 | 4,528 | +36.8% | 1.18% | 1.14% |
| 55 and over (total) | 105,606 | 162,433 | +53.8% | – | – |
| 65 and over (total) | 48,009 | 83,102 | +73.1% | – | – |
Source · ABS Census of Population and Housing, Basic/General Community Profile, tables B23 (2011) and G27 (2021).
References
- ABS, 2021 Census General Community Profile · Australian Bureau of Statistics
- ABS 2021 Census of Population and Housing, All persons QuickStats · Australian Bureau of Statistics
- ABS, 2021 Census General Community Profile, SA2 DataPack · Australian Bureau of Statistics
- ABS, 2016 Census General Community Profile · Australian Bureau of Statistics
- ABS, 2011 Census Basic Community Profile · Australian Bureau of Statistics
- ABS, 2001 Census QuickStats, Australia · Australian Bureau of Statistics
- ABS, 2006 Census QuickStats, Australia · Australian Bureau of Statistics
- ABS: Household and Family Projections, 2021 to 2046 · Australian Bureau of Statistics
- ABS, 2026 Census topics and data release plan · Australian Bureau of Statistics
- ABS, Household and families: Census · Australian Bureau of Statistics
- AHURI, Census reveals changes in the makeup of households 2011 to 2021 · ahuri.edu.au
- NHSAC State of the Housing System, 2025 · nhsac.gov.au
- NHSAC State of the Housing System 2026 · nhsac.gov.au
