

Published 23 June 2026 · Updated 29 Sept 2026
The territory needs to deliver 21,057 homes between July 2024 and June 2029, or about 4,211 homes a year. Approvals have improved sharply, rising 42% in the 12 months to June 2026, the strongest growth rate of any state or territory on NHSAC's August 2026 scorecard1.
Approved homes are also moving into construction faster. At March 2026, 723 approved dwellings were still waiting to start, down from 1,200 at June 2025. Build times are still longer than before the pandemic, however, and quarterly completions remain uneven.
 Why is Australia falling short of its housing target?Australia is behind the pace needed to meet its 1.2 million-home target. By the March 2026 quarter, 308,000 homes had been completed, equal to about 26% of the National Housing Accord goal. To reach t…
 Is Australia on track to build 1.2 million homes by June 2029?Australia has completed 307,635 homes in the first seven quarters of the National Housing Accord, leaving the country 112,365 homes behind the pace needed to reach 1.2 million by June 2029. Australia…
Section 01 · The housing target
The ACT is projected to reach its housing target in December 2029
The ACT needs to deliver 21,057 homes between July 2024 and June 2029 under the National Housing Accord. That is the smallest target of any state or territory, reflecting the ACT's relatively small share of Australia's population when the Accord was agreed.
On NHSAC's August 2026 projections, the ACT is expected to reach that target in December 20291. That is two quarters after the official deadline, and later than the June 2029 date in NHSAC's State of the Housing System 2026 report, but it still puts the territory among the strongest performers nationally.
Only Victoria and Western Australia share the same projected completion date. Other jurisdictions are forecast to take longer:
- New South Wales is projected to reach its target in March 2032, almost three years after the deadline.
- Tasmania is projected to reach its target in June 2034, five years after the deadline.
- The Northern Territory is not expected to reach its target until after 2034.
- Nationally, the 1.2 million-home target is not expected to be reached until December 2030.
The ACT has two structural advantages. The territory government has direct control over land supply through its land release program, and planning policy directs most new housing into existing urban areas. That makes apartments and townhouses a larger part of the supply pipeline than detached greenfield housing.
ACT Housing Accord progress
Cumulative progress against the target of 21,057 homes by June 2029, on NHSAC's August 2026 scorecard (completions to March 2026, approvals to June 2026).
Near target · Dec 2029
- Built34%about 7,160 homes · Jul 2024 - Mar 2026 · about 13,900 still needed
- Approved33%about 6,950 homes · Jul 2024 - Jun 2026 · about 14,110 not yet approved
— Accord target: 21,057 homes by June 2029: 100%
How the ACT compares to other states and territories
The ACT has built 34% of its Accord target, the highest share of any state or territory, ahead of Victoria on 32%1. It is also one of three jurisdictions, with Victoria and Western Australia, projected to reach its target in December 2029, the earliest date of any.
| State / territory | 5-yr target | Built | Approved | Expected delivery | 12mo growth | Annual pace |
|---|---|---|---|---|---|---|
| Australian Capital Territory | 21,057 | 34% | 33% | Dec 2029 | +42% | 4,211 |
| Victoria | 306,000 | 32% | 37% | Dec 2029 | −2% | 61,200 |
| Western Australia | 129,000 | 29% | 38% | Dec 2029 | +11% | 25,800 |
| Queensland | 246,000 | 24% | 35% | Mar 2031 | +23% | 49,200 |
| South Australia | 84,000 | 28% | 35% | Mar 2031 | +4% | 16,800 |
| New South Wales | 376,000 | 21% | 27% | Mar 2032 | +6% | 75,200 |
| Tasmania | 26,000 | 16% | 20% | Jun 2034 | +17% | 5,200 |
| Northern Territory | 11,000 | 9% | 14% | After 2034 | +20% | 2,200 |
| Australia (total) | 1,200,000 | 26% | 33% | Dec 2030 | +8% | 240,000 |
Source · NHSAC Quarterly Report, August 2026 (approvals to June 2026, completions to March quarter 2026); ABS National, State and Territory Population (December 2022). 12mo growth is the rolling 12-month change in building approvals. Accord targets apportioned by population share, rounded to the nearest thousand except for the ACT.
The ACT's land release pipeline is larger than its Accord target
The ACT's five-year land release program targets 25,794 dwellings between 2026-27 and 2030-312. That is about 22% higher than the territory's 21,057-home Accord target. The extra capacity gives the ACT some room for delays and supports the territory government's separate goal of enabling 30,000 new homes by 2030.
In 2026-27, 4,293 dwellings are scheduled for release. Multi-unit dwellings make up 96% of those releases.
Section 02 · Approvals
ACT building approvals have recovered from their 2024-25 low
ACT building approvals rose 42% in the 12 months to June 20261, the fastest growth rate of any state or territory on NHSAC's August 2026 scorecard. Queensland was next at 23%, while approvals nationally rose 8%.
The ACT and Northern Territory are reported in original rather than seasonally adjusted terms, so the comparison with the states should be read as directional rather than exact.
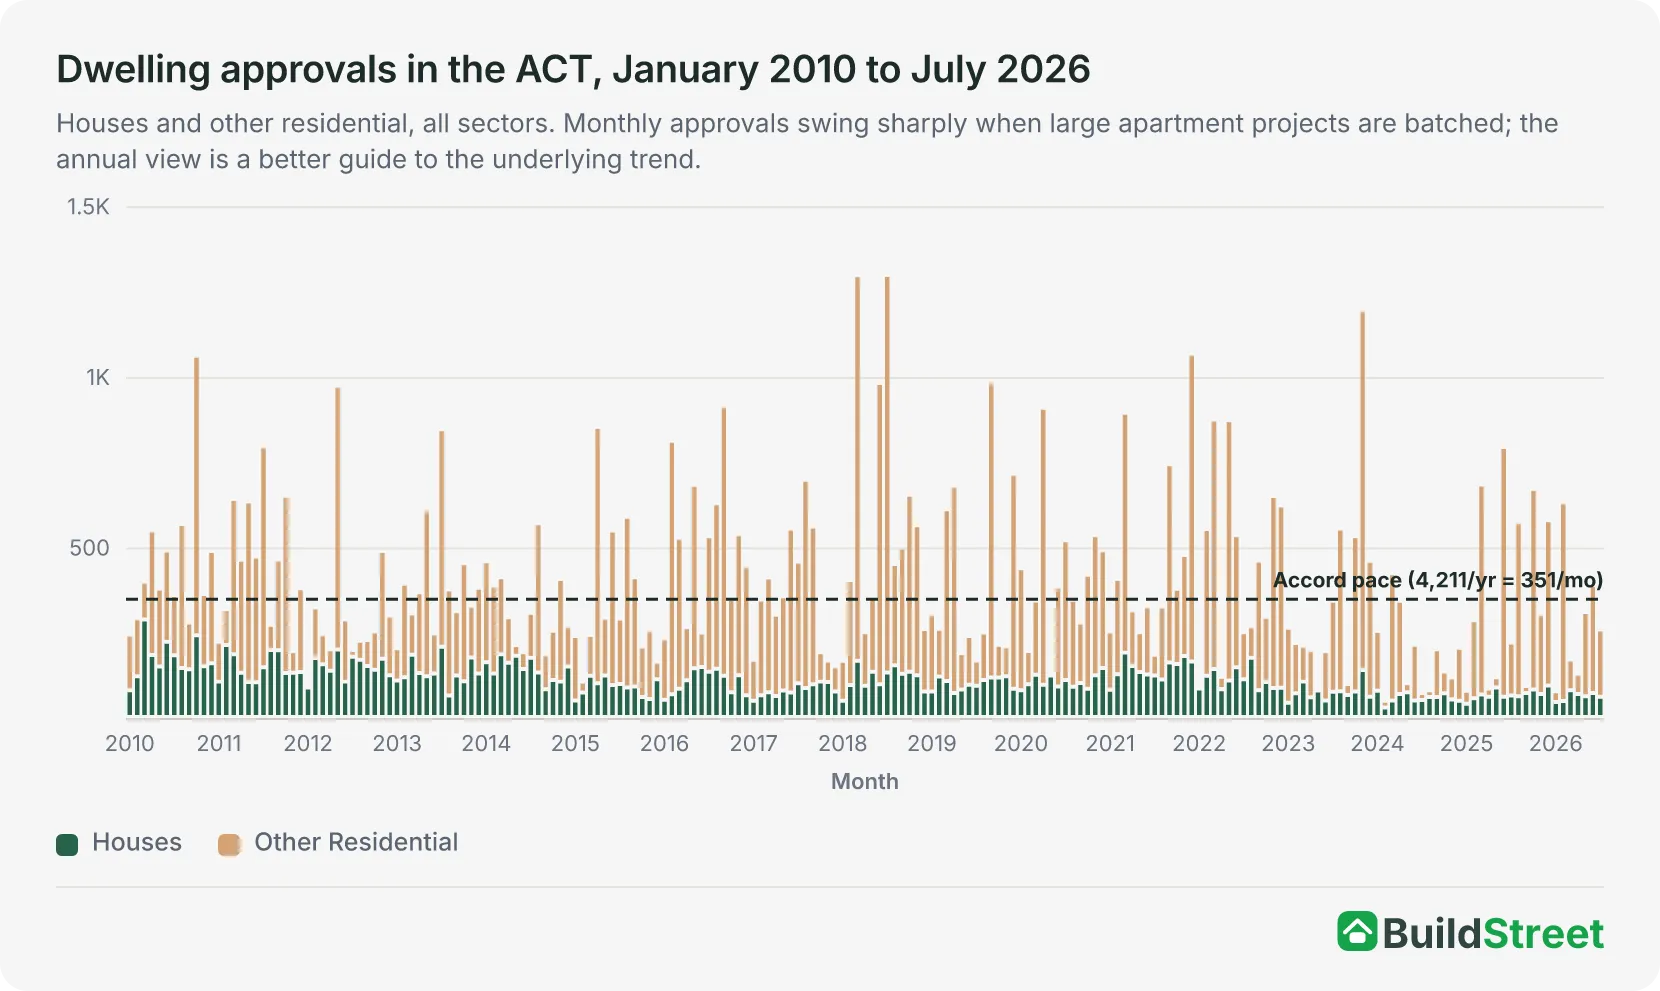
Monthly ACT approvals can move sharply because large apartment projects are approved in batches. A single multi-unit project can add hundreds of dwellings to one month's total:
- June 2025 recorded 792 approvals, one of the strongest months in the series.
- October 2025 recorded 669 approvals.
- September 2025, between those peaks, recorded just 91 approvals.
The annual view gives a clearer picture of the underlying trend. FY2021-22 remains the high point, with 6,193 approvals. Approvals fell to 3,703 in FY2022-23 and to 2,838 in FY2024-25, the lowest year since 2009-10, before recovering to 4,127 in FY2025-26, up 45% on the year before.
Most ACT approvals are now apartments and townhouses
Detached houses made up 45% of ACT residential approvals in FY2012-13. By FY2025-26, that share had fallen to 20%. The shift reflects the ACT's planning direction: with most new housing expected to be built within the existing urban footprint, infill sites are more likely to support apartments and townhouses than detached greenfield housing.
Why monthly ACT approval data is volatile
Monthly ACT building approval figures can be misleading when read in isolation. In December 2025, the ACT recorded 577 approvals. In January 2026, it recorded just 76. That does not necessarily mean demand or construction conditions changed dramatically in one month. It more likely reflects the timing of large multi-unit approvals. For the ACT, the rolling 12-month total is usually a better measure of the housing supply pipeline than any single month.
Section 03 · Commencements & build times
The backlog of approved homes is easing after a 2025 build-up
ACT dwelling commencements fell 8.7% in the six months to June 2025, dropping to 995 starts. Over the same period, approvals rose 154%. That gap shows the pressure lower down the pipeline. By June 2025, the number of approved dwellings that had not yet started construction had grown 40% to 1,200 homes.
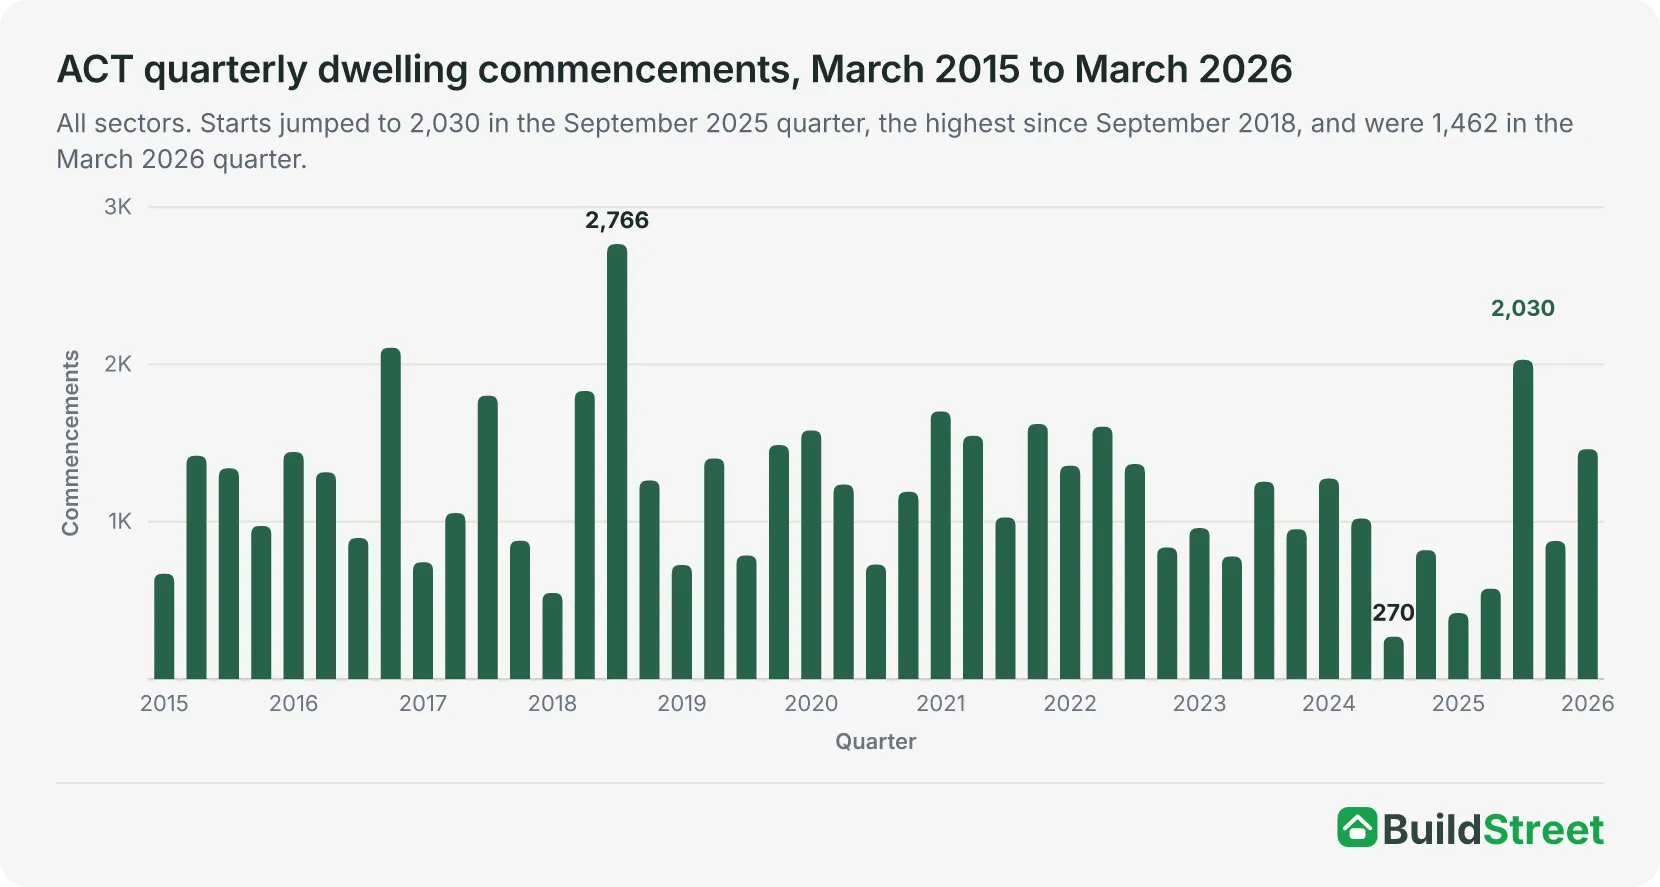
The September 2025 quarter showed a sharp rebound, with commencements reaching 2,030 dwellings. That was the highest quarterly figure since September 2018. However, the increase was likely driven by one or more large multi-unit projects starting construction, rather than a broad-based improvement across the market. Starts were 878 in the December 2025 quarter and 1,462 in the March 2026 quarter, and by March 2026 the backlog of approved homes yet to start had fallen to 7233.
House build times have increased since 2019-20
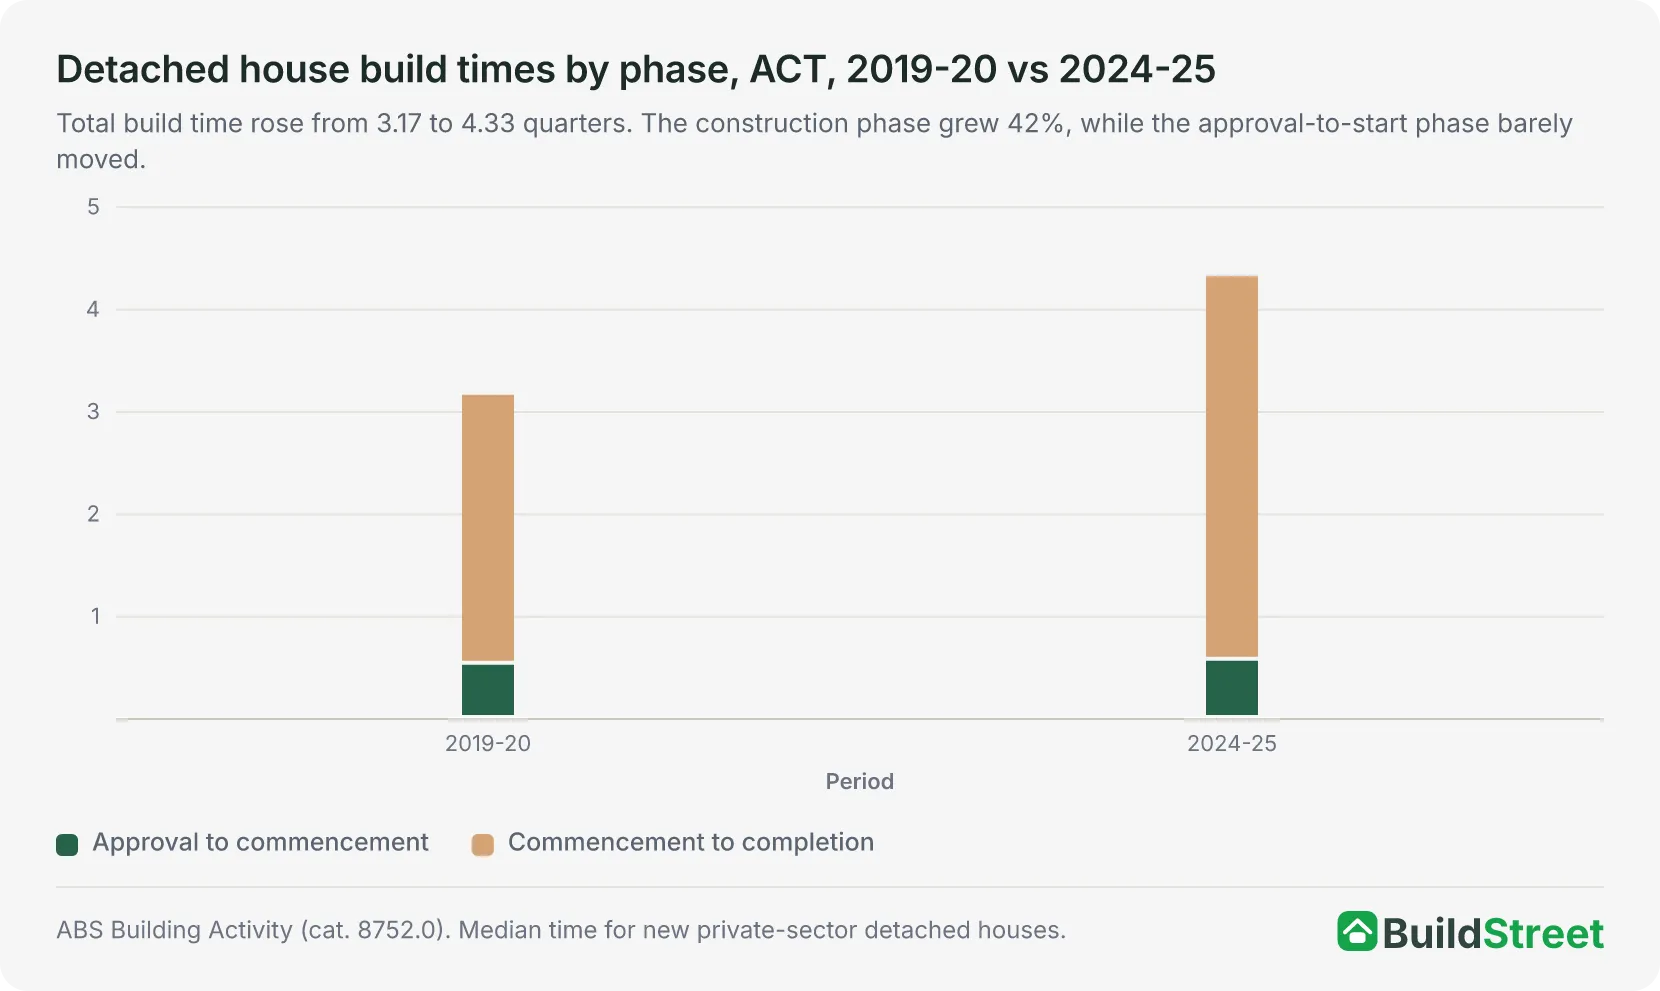
Total build time for a detached house in the ACT rose from 3.17 quarters in 2019-20 to 4.33 quarters in 2024-25, an increase of about 3.5 months. Most of the increase has come from the construction phase. The time from commencement to completion rose 42% to 3.76 quarters4.
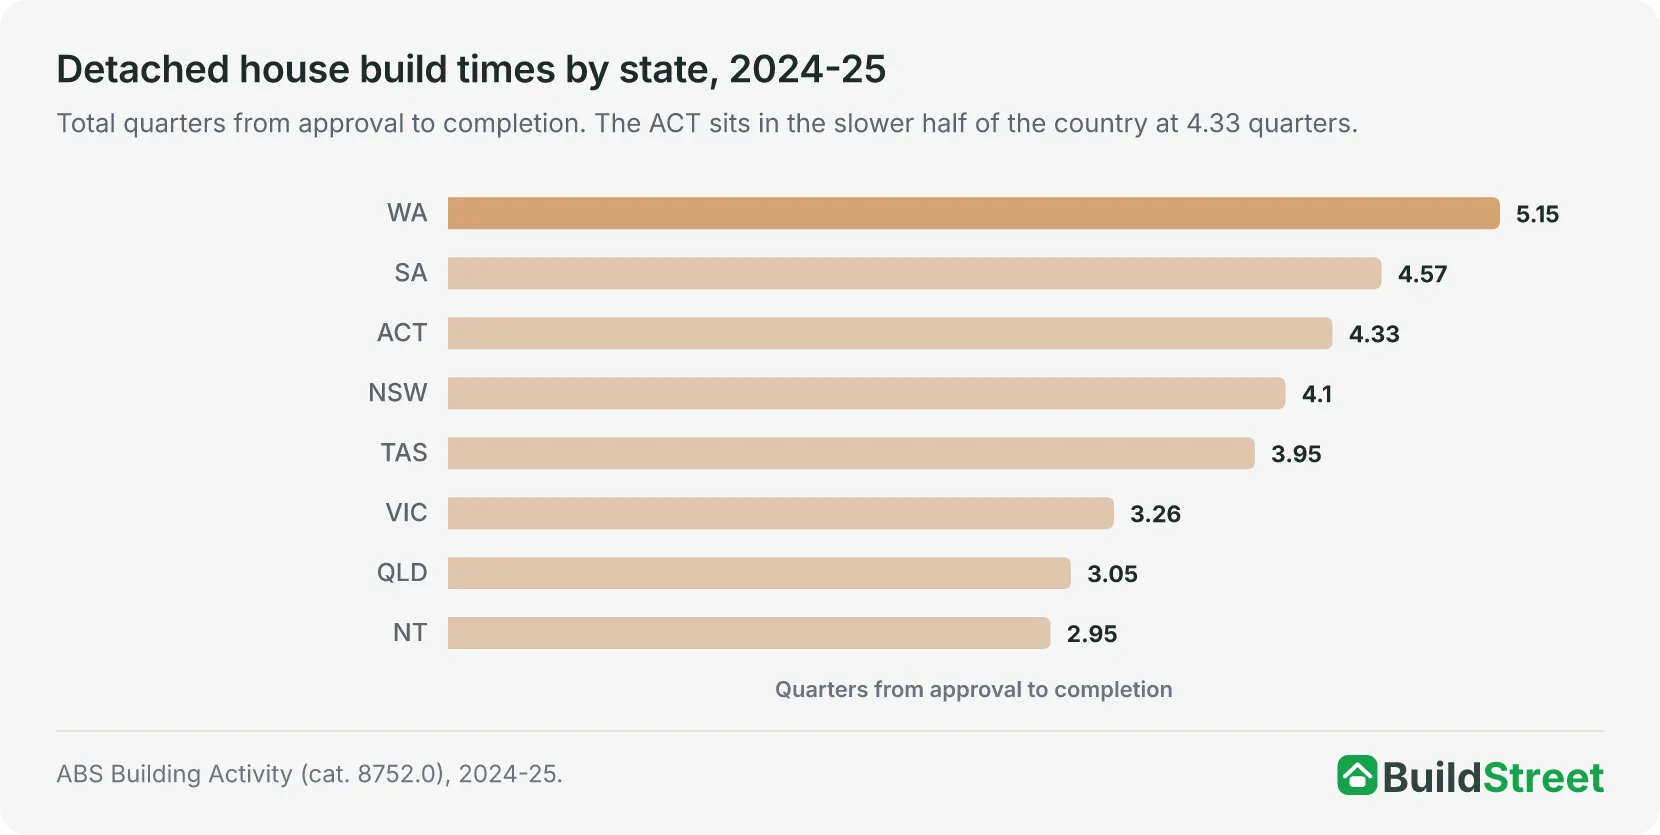
The ACT sits in the slower half of the country. Build times across states for 2024-25:
- Western Australia: 5.15 quarters (slowest nationally)
- South Australia: 4.57 quarters
- ACT: 4.33 quarters
- New South Wales: 4.10 quarters
- Tasmania: 3.95 quarters
- Victoria: 3.26 quarters
- Queensland: 3.05 quarters
- Northern Territory: 2.95 quarters (fastest nationally)
Section 04 · Completions
Are ACT housing completions recovering?
ACT dwelling completions fell 43% in the six months to June 2025, dropping from 2,619 homes in the previous six months to 1,497 homes.
The decline was sharper for attached dwellings, which is expected in a market where large apartment projects make up a major share of new supply. These projects take longer to complete and are often handed over in batches, making quarterly completion figures uneven.
The September and December quarters of 2025 brought a partial recovery, with 1,015 and 1,151 homes completed respectively. The March 2026 quarter added a further 1,003 completions.
Over the first seven quarters of the Accord period, from July 2024 to March 2026, ABS completions data shows 7,285 completed homes. NHSAC's August 2026 scorecard shows the ACT had built 34% of its Accord target, equal to about 7,160 homes. The two measures are now close, and both suggest the ACT is tracking comparatively well.
Section 05 · Where new homes are being built
Most new ACT housing is planned for Molonglo Valley
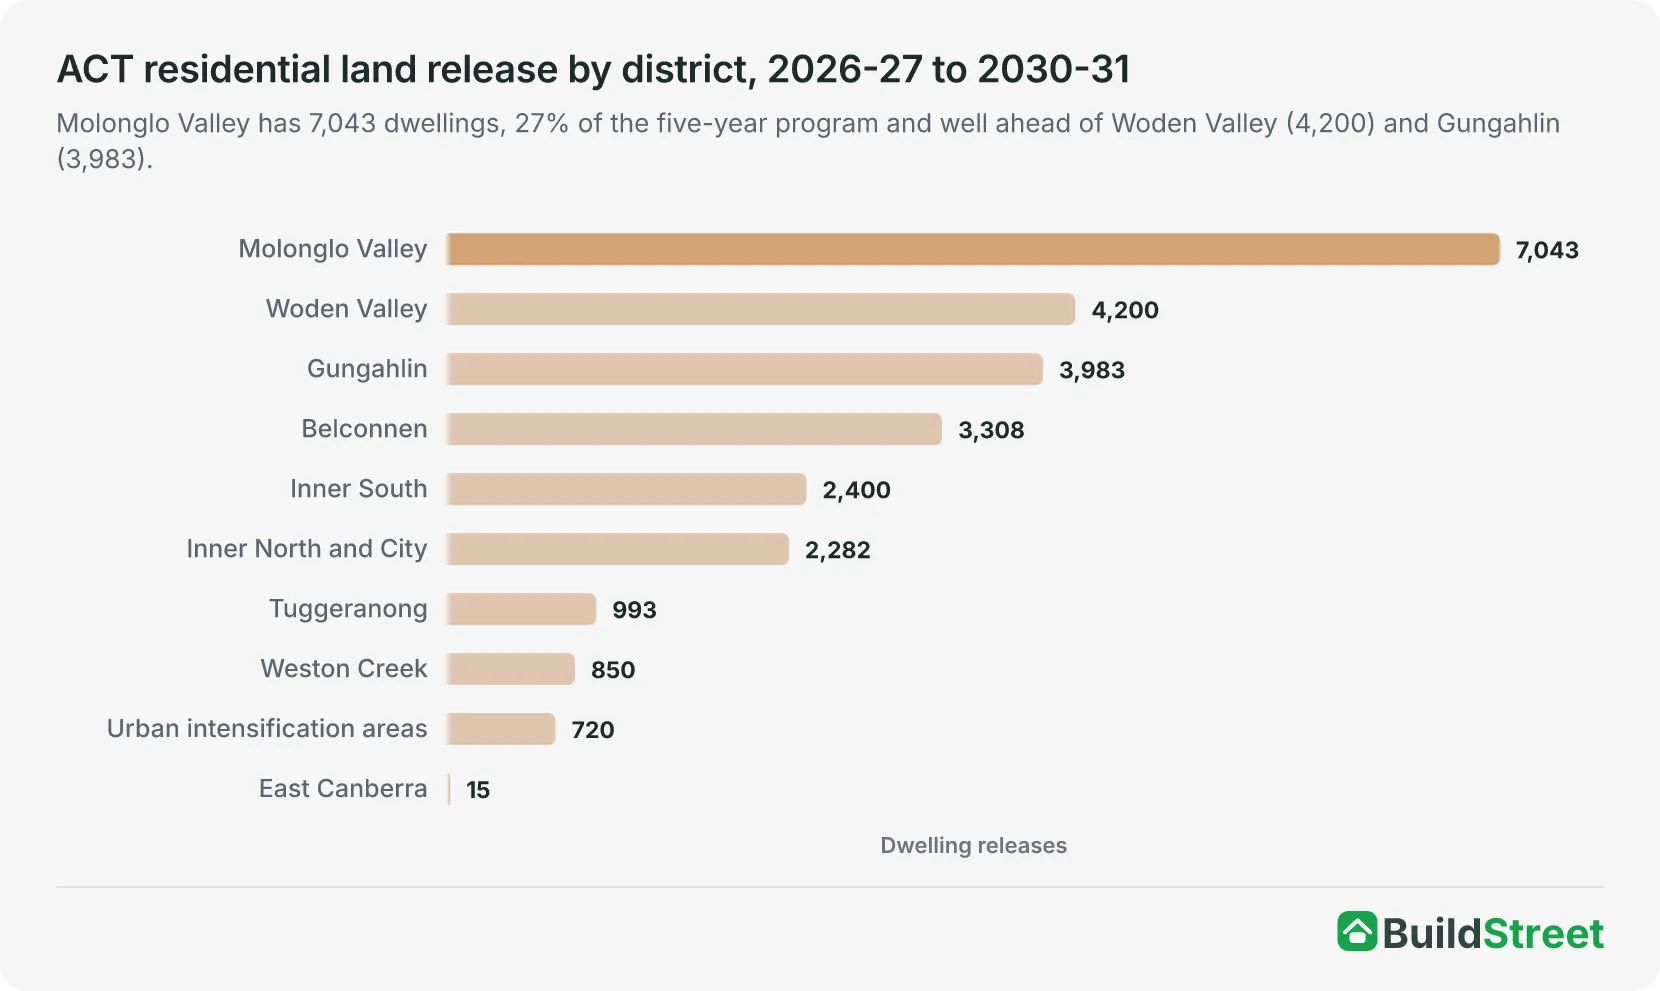
The ACT's five-year land release program allocates 25,794 dwellings across nine districts and an urban intensification area between 2026-27 and 2030-31.
Molonglo Valley has the largest allocation, with 7,043 planned dwelling releases2. That is 27% of the five-year program and well ahead of any other district.
- Woden Valley: 4,200
- Gungahlin: 3,983
- Belconnen: 3,308
- Inner South: 2,400
- Tuggeranong: 993 and Weston Creek: 850 (smallest allocations after East Canberra, with 15)
Population growth is also concentrated in Molonglo Valley
Molonglo Valley's population grew by 11.6% in 2024-25, adding 1,884 residents. That was more than eight times the ACT's overall growth rate of 1.3%.
Within Molonglo Valley, Whitlam recorded the fastest growth, increasing 83% from 891 to 1,632 residents. Denman Prospect grew 11%, from 4,939 to 5,503 residents.
Growth was much slower in some established areas. Tuggeranong added 92 residents, while Canberra East recorded a population decline.
Most new ACT housing is being directed into existing suburbs
Around 67% of new ACT housing capacity is being directed into existing suburbs, close to the planning strategy's 70% target. In the 2026-27 to 2030-31 program, government infill releases account for 40% of total residential capacity. Greenfield releases, mainly in Molonglo Valley and outer Gungahlin, account for 33%. Private-sector infill makes up the remaining 27%.
Composition of ACT residential land release, 2026-27 to 2030-31
Share of total five-year dwelling yield by location type.
- ACT Government infill releases40%
- ACT Government greenfield releases33%
- Private sector infill development27%
— 100%
Section 06 · What is being built
Most new ACT dwellings are apartments and townhouses
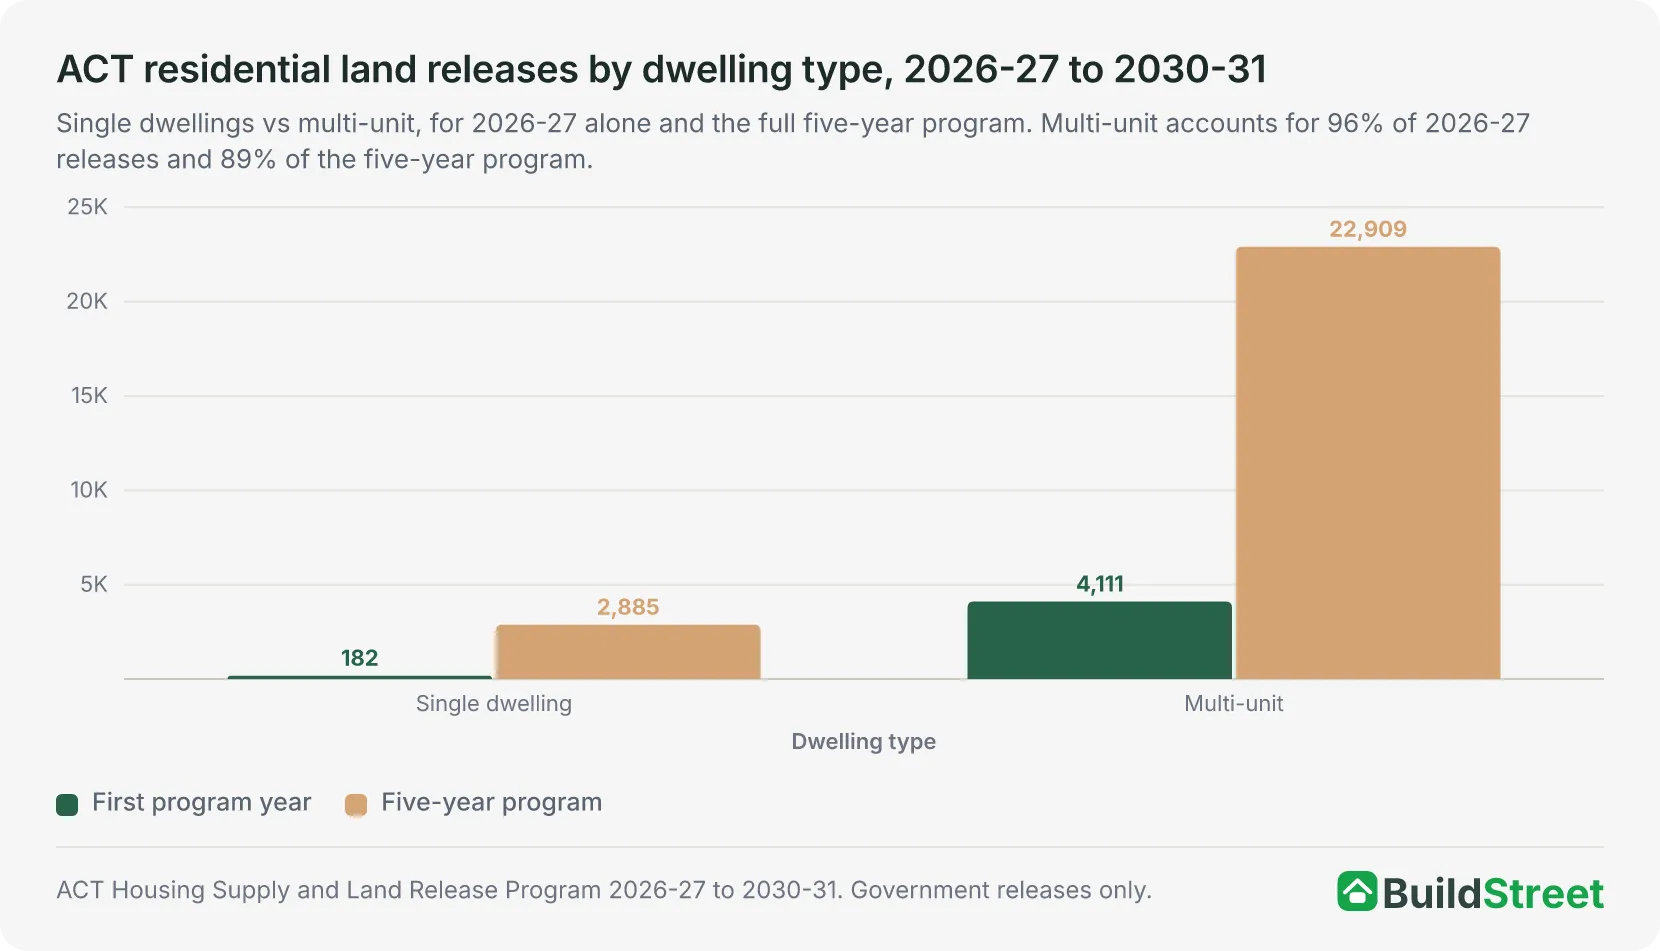
Of the 4,293 dwellings scheduled for release in 2026-27, only 182 are detached houses. The remaining 4,111 dwellings, or 96% of the total, are multi-unit homes such as apartments and townhouses.
The five-year land release program has a similar, if less extreme, mix. Between 2026-27 and 2030-31, the ACT plans to release capacity for 22,909 multi-unit dwellings, compared with 2,885 single-dwelling homes. This higher-density mix helps the ACT plan for more homes in a small jurisdiction, but it also creates delivery risks:
- Multi-unit projects often need presales, fixed-price contracts and financing before construction can start.
- Apartments and townhouses usually take longer to build than detached houses.
- Completions often arrive in batches, which can make quarterly supply figures uneven.
Recent planning reforms are likely to reinforce the shift toward apartments, townhouses and dual occupancies. The ACT's Missing Middle Housing Reforms cover much of the urban area and are designed to make it easier to build more homes on existing residential land. The reforms allow more flexible subdivision and multi-unit development in suburban zones, including two homes on some larger residential blocks. Stamp duty exemptions and Lease Variation Charge changes are also being used to encourage take-up.
Section 07 · Population vs supply
Housing stock is growing faster than the ACT population
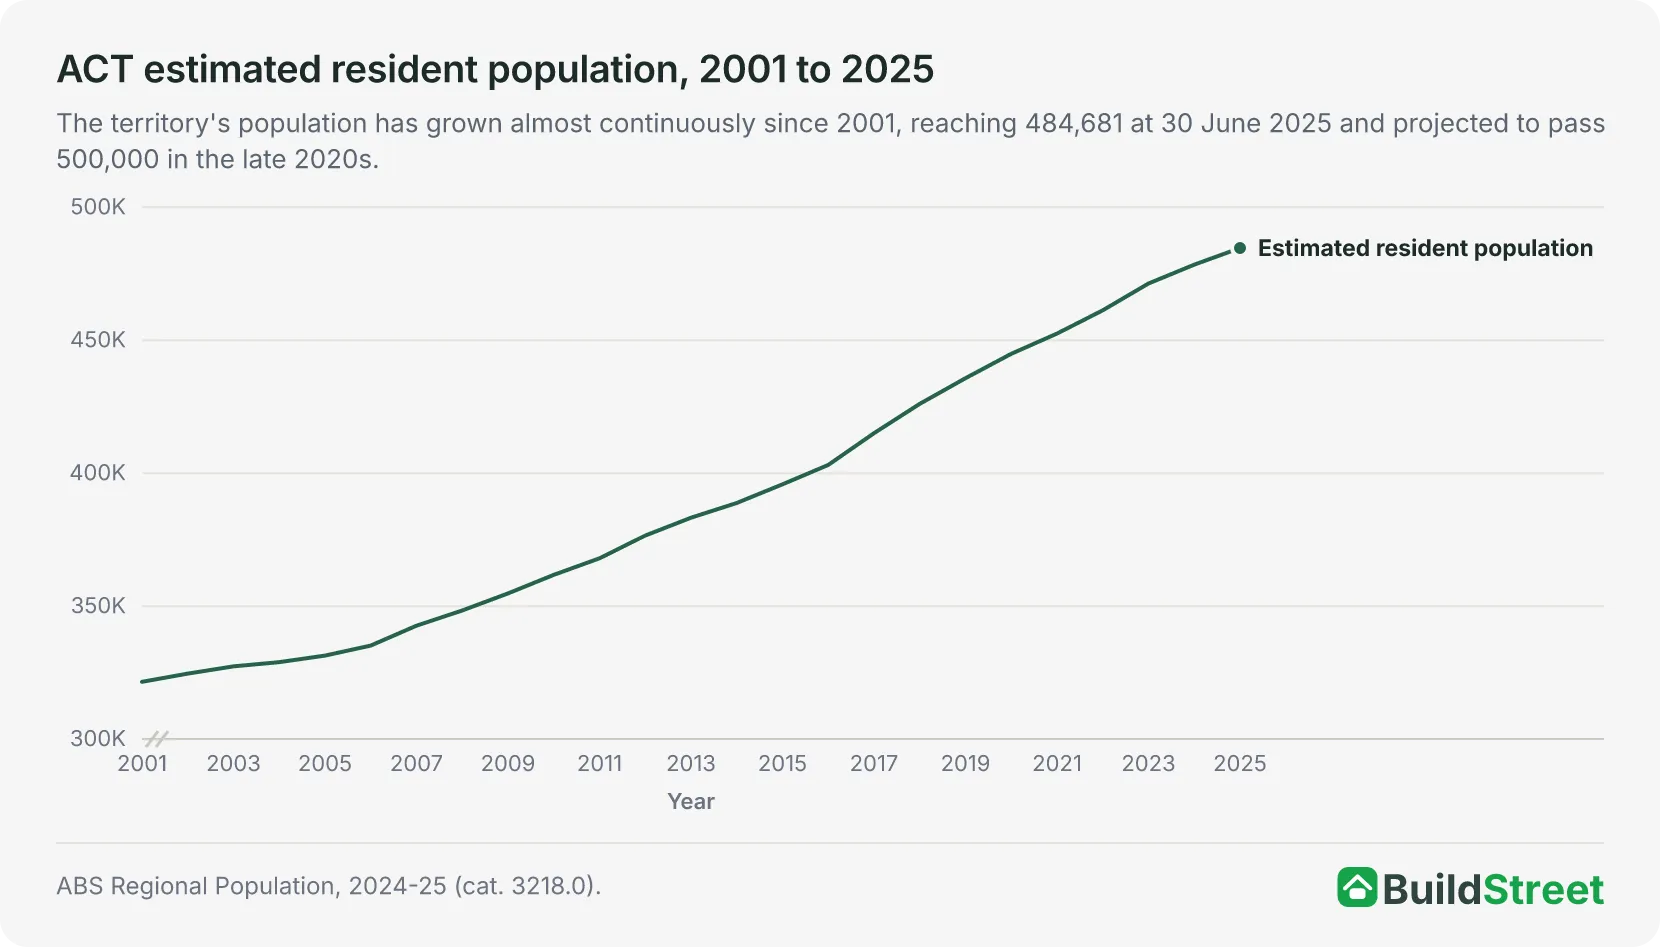
The ACT's dwelling stock grew 1.8% in the year to September 2025, or about 3,700 homes, faster than population growth of 1.3% over the same period. The territory's population reached 484,681 at 30 June 2025, an increase of 6,251 people over 12 months5.
More dwellings than residents does not automatically mean affordability will improve. The type, price point and location of new homes matter as much as the total number built. Average household sizes are also falling as the population ages and more people live alone. That means the ACT needs more dwellings to house the same number of residents, which is one reason affordability pressure can persist even when overall supply looks strong.
Components of ACT population growth, 2024-25
Natural increase, net overseas migration and net interstate migration.
- Natural increase2,949
- Net overseas migration4,425
- Net interstate migration-1,123
- Total change6,251
— Benchmark: 6,251
The ACT's population has grown almost continuously since the early 2000s, with only a brief pause during the pandemic years, when international arrivals slowed. The territory is projected to pass 500,000 residents in the late 2020s, reach nearly 700,000 around 2050, and surpass 800,000 by 2065. Most long-term growth is expected in Molonglo Valley and Belconnen.
Section 08 · Historical pipeline
ACT housing approvals and completions since 2009-10
Annual completions peaked at 5,424 in FY2022-23, the highest result in the dataset. That peak followed the record approvals year in FY2021-22, when 6,193 dwellings were approved.
Approvals fell to 3,703 in FY2022-23 and to 2,838 in FY2024-25, the lowest year since 2009-10, before recovering to 4,127 in FY2025-26.
The Accord benchmark is 4,211 completions a year. The ACT met or exceeded that benchmark in 10 of the 16 financial years shown, including every year from 2016-17 to 2022-23. In FY2024-25, the ACT completed 4,116 dwellings. That was 97.7% of the annual Accord pace, or 95 homes below the benchmark.
Show full tables
| Financial year | Approvals | Commencements | Completions | % of Accord pace |
|---|---|---|---|---|
| 2009-10 | 4,536 | 4,425 | 3,317 | 78.8% |
| 2010-11 | 5,849 | 5,106 | 3,950 | 93.8% |
| 2011-12 | 4,854 | 4,595 | 4,139 | 98.3% |
| 2012-13 | 3,798 | 4,499 | 4,993 | 118.6% |
| 2013-14 | 4,631 | 4,235 | 4,443 | 105.5% |
| 2014-15 | 4,254 | 4,052 | 4,792 | 113.8% |
| 2015-16 | 4,669 | 5,073 | 3,284 | 78.0% |
| 2016-17 | 5,523 | 4,803 | 4,369 | 103.8% |
| 2017-18 | 5,655 | 5,062 | 4,603 | 109.3% |
| 2018-19 | 5,988 | 6,158 | 4,818 | 114.4% |
| 2019-20 | 4,922 | 5,092 | 4,938 | 117.3% |
| 2020-21 | 5,013 | 5,168 | 5,130 | 121.8% |
| 2021-22 | 6,193 | 5,612 | 4,737 | 112.5% |
| 2022-23 | 3,703 | 3,944 | 5,424 | 128.8% |
| 2023-24 | 4,546 | 4,504 | 4,078 | 96.8% |
| 2024-25 | 2,838 | 2,085 | 4,116 | 97.7% |
Source · ABS Building Approvals (cat. 8731.0) and Building Activity (cat. 8752.0); Accord pace benchmark 4,211 completions a year.
References
- NHSAC Quarterly Report – August 2026 · nhsac.gov.au ↑ b c d
- ACT Housing Supply and Land Release Program 2026-27 to 2030-31 · planning.act.gov.au ↑ b
- ABS Building Activity, Australia, March 2026 — Table 80 (dwellings approved but not yet commenced, states) · Australian Bureau of Statistics ↑
- ABS Building Activity, Australia — Average dwelling completion times (jun-2025) · Australian Bureau of Statistics ↑
- ABS National, state and territory population, March 2026: Table 4 — Estimated resident population, states and territories · Australian Bureau of Statistics ↑
- ABS Building Approvals, Australia (latest release, Cat. 8731.0) · Australian Bureau of Statistics
- ABS, Building Activity, Australia (latest release, Cat. 8752.0) · Australian Bureau of Statistics
- ABS: Regional Population, 2024–25 · Australian Bureau of Statistics
- ACT Population Projections 2025 to 2065 · treasury.act.gov.au
- ABS, National, state and territory population (latest release) · Australian Bureau of Statistics
- NHSAC State of the Housing System 2026 · nhsac.gov.au
