

Published 19 May 2026 · Updated 22 Sept 2026
Separate houses still dominate Australia's housing stock, accounting for 72.3% of occupied private dwellings in 20211. But the share has been steadily declining, down from 76.6% in 20062. At the same time, non-house dwellings accounted for 42.2% of all residential building approvals in 2025, up from 36.2% a year earlier.
The existing housing stock remains overwhelmingly detached, but new construction is shifting more rapidly toward townhouses and apartments, reshaping affordability, density and urban growth patterns.
 Duplex and semi-detached housing statistics Australia 2025: approvals, building values and state trendsAustralia approved 34,488 semi-detached dwellings, townhouses and duplexes in 2025, the highest annual total since 2017 and up 20.8% from the year before. These dwellings made up 17.6% of all new resi…
 What the post-2020 cost surge means for homebuilding in AustraliaHouse construction prices in Australia surged 40.8% between September 2020 and June 2024, according to ABS producer price data for house construction. That increase has permanently reset the cost base…
Section 01 · Dwelling stock
Separate houses still make up most Australian dwellings
Separate houses remain the dominant dwelling type in Australia, although their share has been gradually declining. In the 2021 Census, the ABS recorded 9,275,217 occupied private dwellings nationally1. Around three in four were separate houses, while flats and apartments accounted for roughly one in seven.
When unoccupied dwellings are included, the ABS recorded 10,852,208 private dwellings in total. Separate houses made up 70% of all private dwellings, compared with 13% for townhouses and 16% for apartments3.
The overall picture
The shift away from separate housing is real but gradual. After 15 years of change, Australia remains firmly a country of separate houses. What has changed is the margin: townhouses and apartments are both larger parts of the stock than they were, and the new supply pipeline is accelerating that shift.
What the numbers don't show
National averages mask extreme local variation. The apartment story is concentrated in a handful of inner-city statistical areas. In Sydney's City and Inner South, apartments are a majority — 69.4% — but that area is the exception, not the rule. At the national level, almost three in four occupied dwellings are still separate houses.
Section 02 · Census trends
How the dwelling mix has changed since 2006
Census data shows a gradual shift away from separate houses, but not a broad move to apartment living. Separate houses fell from 76.6% of occupied private dwellings in 20062 to 72.3% in 2021. Over the same period, semi-detached homes and townhouses rose from 9.2% to 12.6%, while flats and apartments edged up from 13.1% to 14.2%.
Over the full 15 years, the change has been driven more by townhouses and semi-detached homes than by apartments, pointing to a broader middle-density shift in Australia's housing mix. The latest period looks different: between 2016 and 2021 the apartment share rose from 13.1% to 14.2% while the townhouse share was flat1, so apartments did more of the work in the most recent Census.
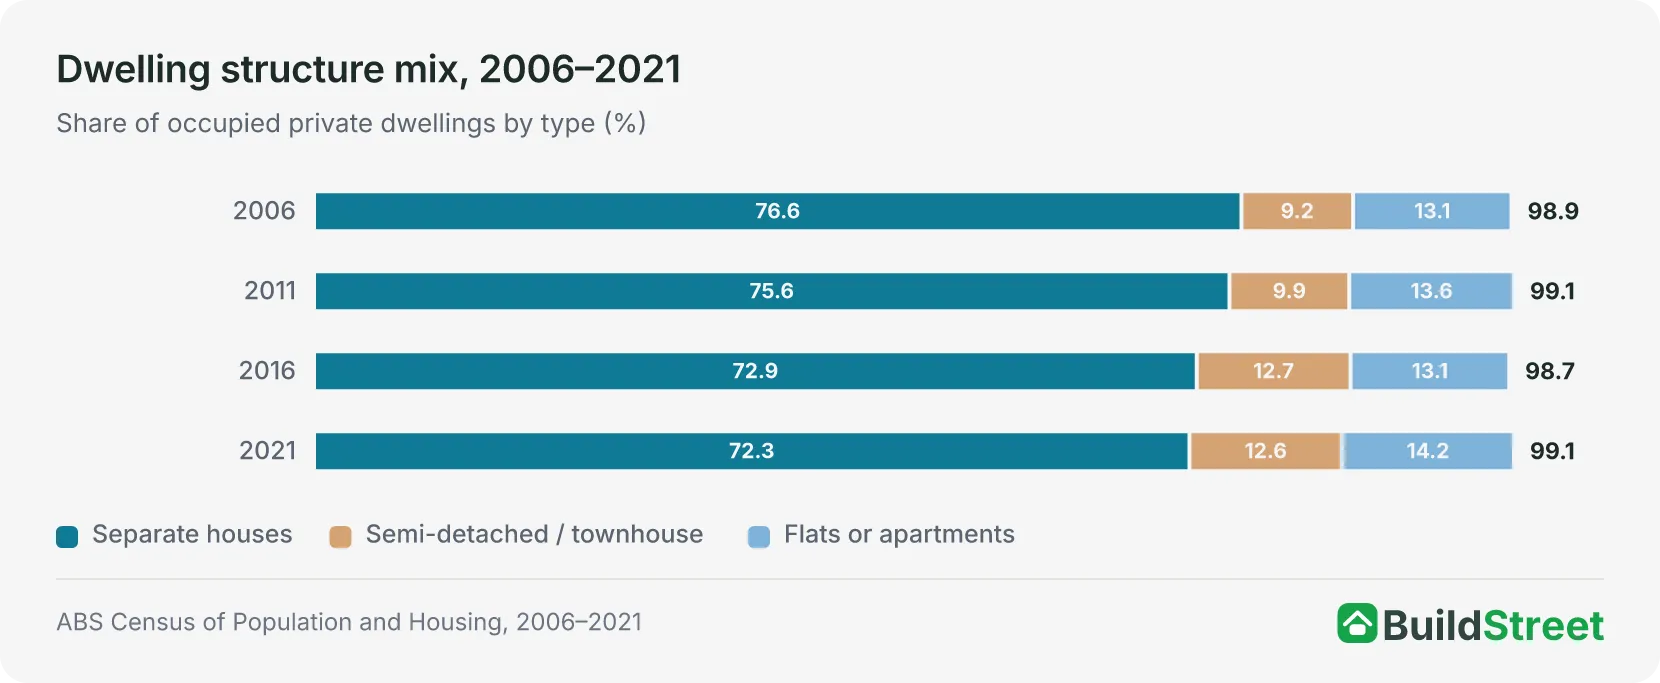
Australia's housing mix is changing, but the shift is clearer in percentages than in total dwelling numbers. Separate houses are taking up a smaller share of the national housing stock, yet the actual number of separate houses has continued to grow.
In dwelling numbers, separate houses still increased, rising from 5.47 million in 20062 to 6.71 million in 2021, a gain of about 22.6%. Flats and apartments grew by 41.4%, while semi-detached homes and townhouses recorded the strongest growth at 77.4%, although from a smaller starting point.
| Census dwelling stock by type, 2006–2021 | ||||
|---|---|---|---|---|
| Census year | Total occupied | Separate houses | Semi / townhouse | Flats or apartments |
| 2006 | 7,144,093 | 5,472,527 (76.6%) | 658,858 (9.2%) | 932,862 (13.1%) |
| 2011 | 7,760,320 | 5,864,574 (75.6%) | 765,980 (9.9%) | 1,056,237 (13.6%) |
| 2016 | 8,286,079 | 6,041,787 (72.9%) | 1,055,016 (12.7%) | 1,087,441 (13.1%) |
| 2021 | 9,275,217 | 6,710,582 (72.3%) | 1,168,860 (12.6%) | 1,319,095 (14.2%) |
Source · ABS Census of Population and Housing, 2006–2021 QuickStats, national totals for occupied private dwellings.
Section 03 · Apartments
Where apartments are most common in Australia
Apartments make up a larger share of housing in some parts of Australia, but they are still not the main dwelling type in any state or territory. Apartment living is concentrated in a small number of jurisdictions, particularly those with larger urban centres and higher-density housing.
In 2021, the highest apartment shares were in New South Wales at 21.7%4, the Australian Capital Territory at 19.4% and the Northern Territory at 17.9%. No jurisdiction had a separate-house share below 63.2%. Tasmania had the highest share of separate houses at 87.7%, while apartments accounted for just 5.3% of dwellings5.
| Dwelling type by state and territory, 2021 | ||||
|---|---|---|---|---|
| State or territory | Houses % | Semi % | Apts % | Apt change since 2016 |
| New South Wales | 65.6% | 11.7% | 21.7% | +1.8 pp |
| Victoria | 73.4% | 13.9% | 12.1% | +0.5 pp |
| Queensland | 74.8% | 11.7% | 12.5% | +1.2 pp |
| South Australia | 78.0% | 14.6% | 6.8% | +0.2 pp |
| Western Australia | 79.7% | 13.0% | 6.5% | +0.8 pp |
| Tasmania | 87.7% | 6.1% | 5.3% | −0.4 pp |
| Northern Territory | 66.8% | 12.7% | 17.9% | +0.4 pp |
| Australian Capital Territory | 63.2% | 17.2% | 19.4% | +4.4 pp ★ |
Source · ABS 2021 Census QuickStats, occupied private dwellings by state and territory.
In major cities, the contrast is clearer. Greater Sydney had the highest apartment share in 2021, with apartments accounting for 30.7% of dwellings6. Greater Darwin followed at 25.0%, ahead of Greater Melbourne at 15.6% and Greater Brisbane at 14.7%. Even in Greater Sydney, separate houses remained the largest dwelling category, accounting for 55.8% of dwellings.
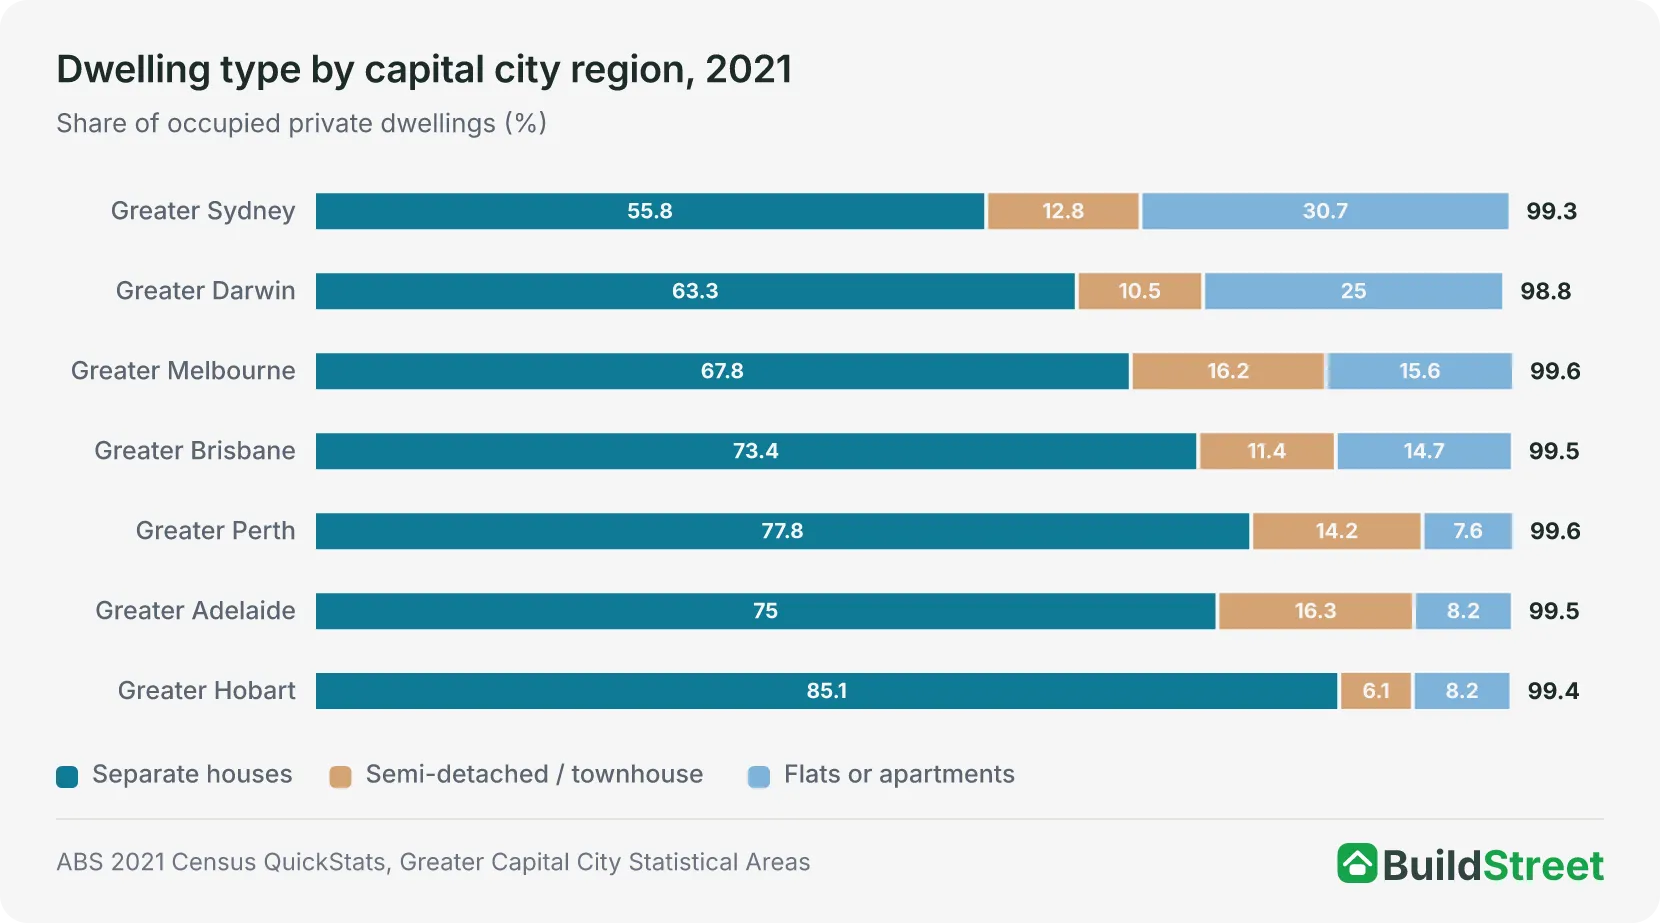
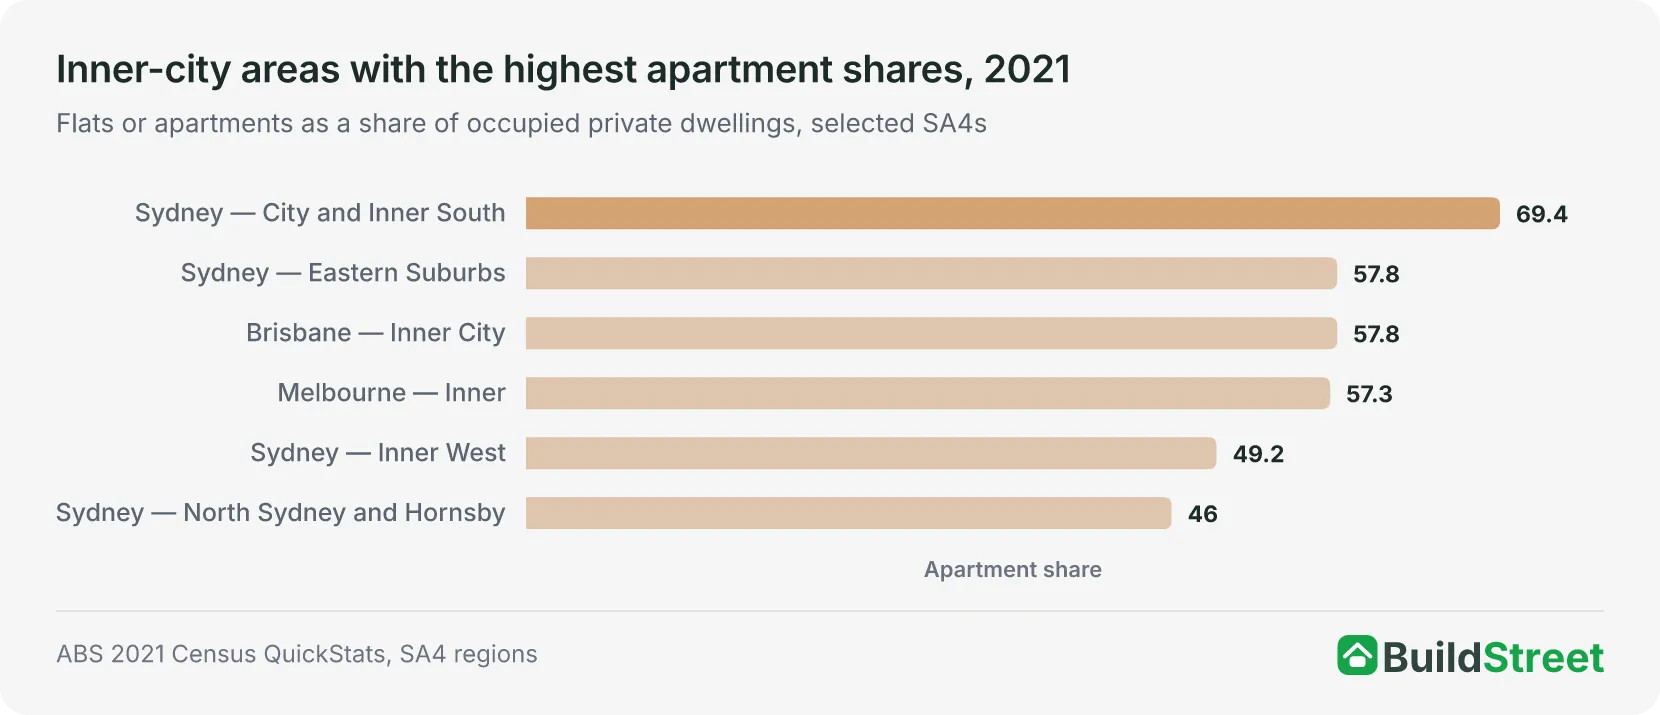
The capital-city figures show where apartment living is more common at a broad regional level. The pattern becomes much stronger when the data is narrowed to inner-city statistical areas.
The sharpest concentration is in Sydney's City and Inner South, where apartments accounted for 69.4% of occupied private dwellings in 20217. In that area, apartments are the main form of housing, not a niche.
Section 04 · New supply
What new housing approvals show about Australia's dwelling mix
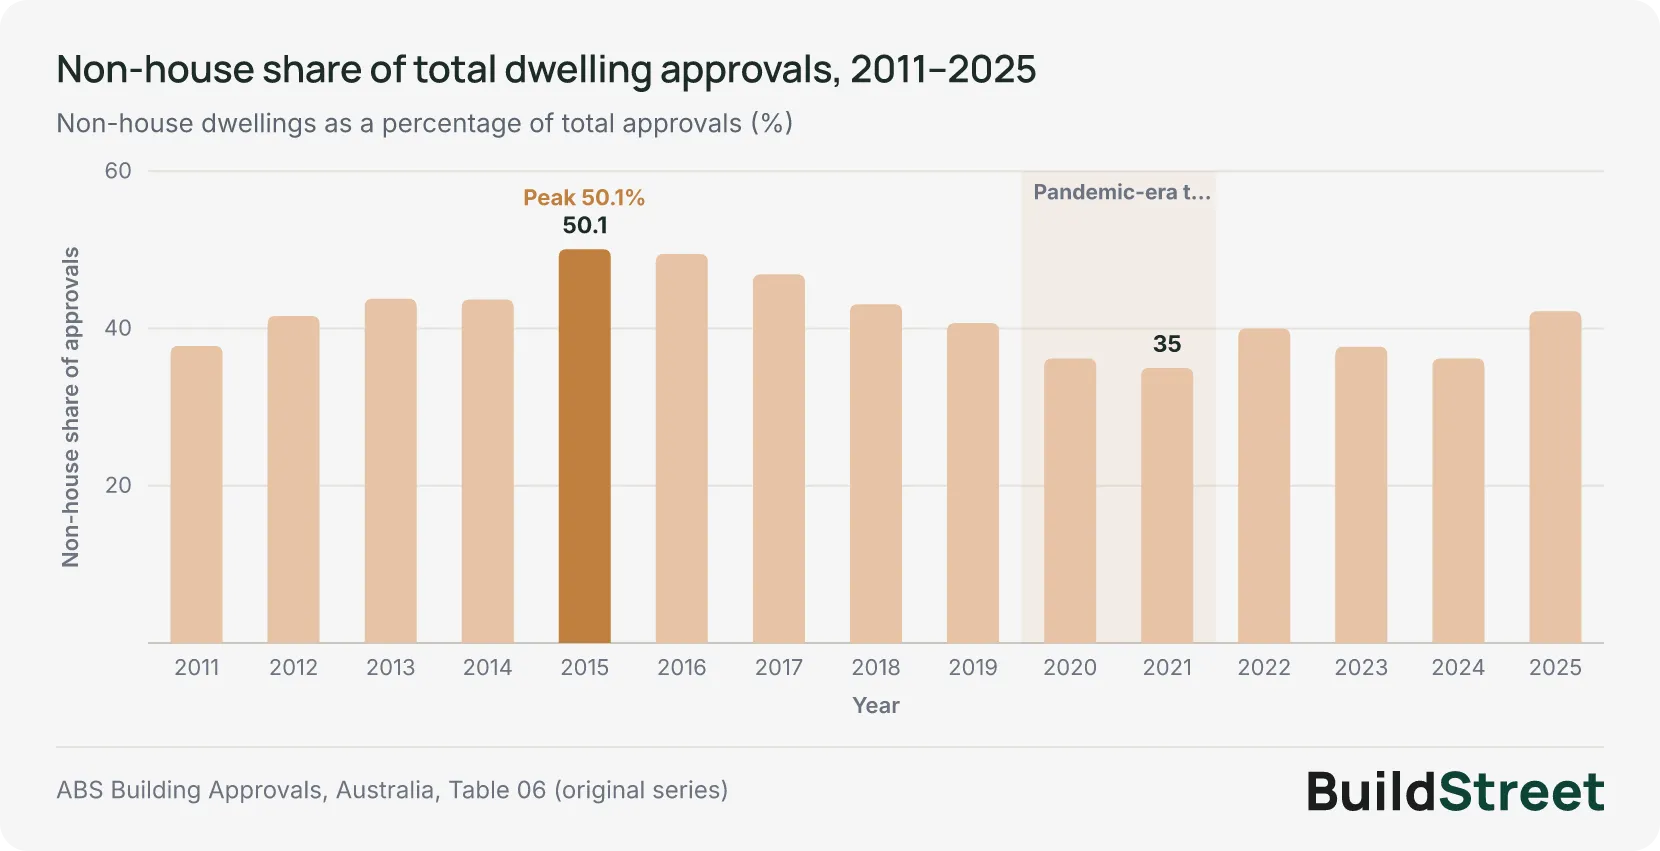
New housing approvals suggest Australia's future housing supply is becoming less detached-house heavy, even though the existing stock is still mostly separate houses. In 2025, non-house dwellings made up 42.2% of all approvals, up from 36.2% in 2024.
Building approvals and construction data show the direction of change, not the homes Australians currently live in. They are best read as a pipeline signal rather than a measure of existing housing stock.
The long-run approvals data shows the non-house share has been volatile. It peaked at just over 50% in 2015 and 2016, then fell during the pandemic-era rise in detached-house approvals. Since then, the non-house share has been recovering. From 2024 to 2025, total approvals rose by about 12.9%, while non-house approvals rose by about 31.6%.
Under construction — Mar Qtr 2026
- Total dwellings (original terms)
243,864
- Non-house
151,902
- Houses
90,972
- Non-house share of pipeline
62%
- Source: ABS Building Activity, Australia, March Quarter 2026.
Jul 2026 monthly approvals
- Seasonally adjusted total approvals
17,687
- Non-house
7,292
- Houses
10,395
- Non-house share of approvals
41.2%
- Source: ABS Building Approvals, Australia, July 2026.
| Annual approvals, commencements and completions, 2011–2025 | ||||||
|---|---|---|---|---|---|---|
| Year | Total approved | Houses | Non-house | Non-house share | Commenced | Completed |
| 2011 | 153,755 | 95,635 | 58,120 | 37.8% | 154,801 | 154,374 |
| 2012 | 157,676 | 92,035 | 65,641 | 41.6% | 154,104 | 146,227 |
| 2013 | 183,275 | 102,967 | 80,308 | 43.8% | 171,934 | 153,827 |
| 2014 | 210,007 | 118,152 | 91,855 | 43.7% | 203,799 | 177,814 |
| 2015 | 239,735 | 119,644 | 120,091 | 50.1% | 227,495 | 197,253 |
| 2016 | 234,869 | 118,492 | 116,377 | 49.5% | 234,113 | 213,644 |
| 2017 | 224,609 | 119,302 | 105,307 | 46.9% | 216,640 | 213,181 |
| 2018 | 211,539 | 120,410 | 91,129 | 43.1% | 223,795 | 219,588 |
| 2019 | 176,611 | 104,756 | 71,855 | 40.7% | 175,263 | 202,467 |
| 2020 | 187,365 | 119,600 | 67,765 | 36.2% | 182,998 | 181,340 |
| 2021 | 228,995 | 148,867 | 80,128 | 35.0% | 229,378 | 178,560 |
| 2022 | 191,664 | 114,932 | 76,732 | 40.0% | 182,441 | 173,902 |
| 2023 | 164,332 | 102,362 | 61,970 | 37.7% | 165,856 | 176,636 |
| 2024 | 174,364 | 111,242 | 63,122 | 36.2% | 169,607 | 179,076 |
| 2025 | 196,933 | 113,851 | 83,082 | 42.2% | 197,186 | 173,228 |
Source · ABS Building Approvals, Table 06 (July 2026 release); commencements and completions from ABS Building Activity (March quarter 2026 release).
References
- ABS 2021 Census of Population and Housing, All persons QuickStats · Australian Bureau of Statistics ↑ b c
- ABS, Census QuickStats, Australia, 2011 · Australian Bureau of Statistics ↑ b c
- ABS Snapshot of Australia, 2021 · Australian Bureau of Statistics ↑
- ABS, 2021 Census All persons QuickStats — state and territory pages · Australian Bureau of Statistics ↑
- ABS Census QuickStats: Tasmania, 2021 · Australian Bureau of Statistics ↑
- ABS Census QuickStats: Greater Sydney, 2021 · Australian Bureau of Statistics ↑
- ABS Census QuickStats: Sydney - City and Inner South (SA4), 2021 · Australian Bureau of Statistics ↑
- ABS Building Approvals, Australia (latest release, Cat. 8731.0) · Australian Bureau of Statistics
- ABS, Building Activity, Australia (latest release, Cat. 8752.0) · Australian Bureau of Statistics
- Building Activity, Australia, June 2025 · Australian Bureau of Statistics
