

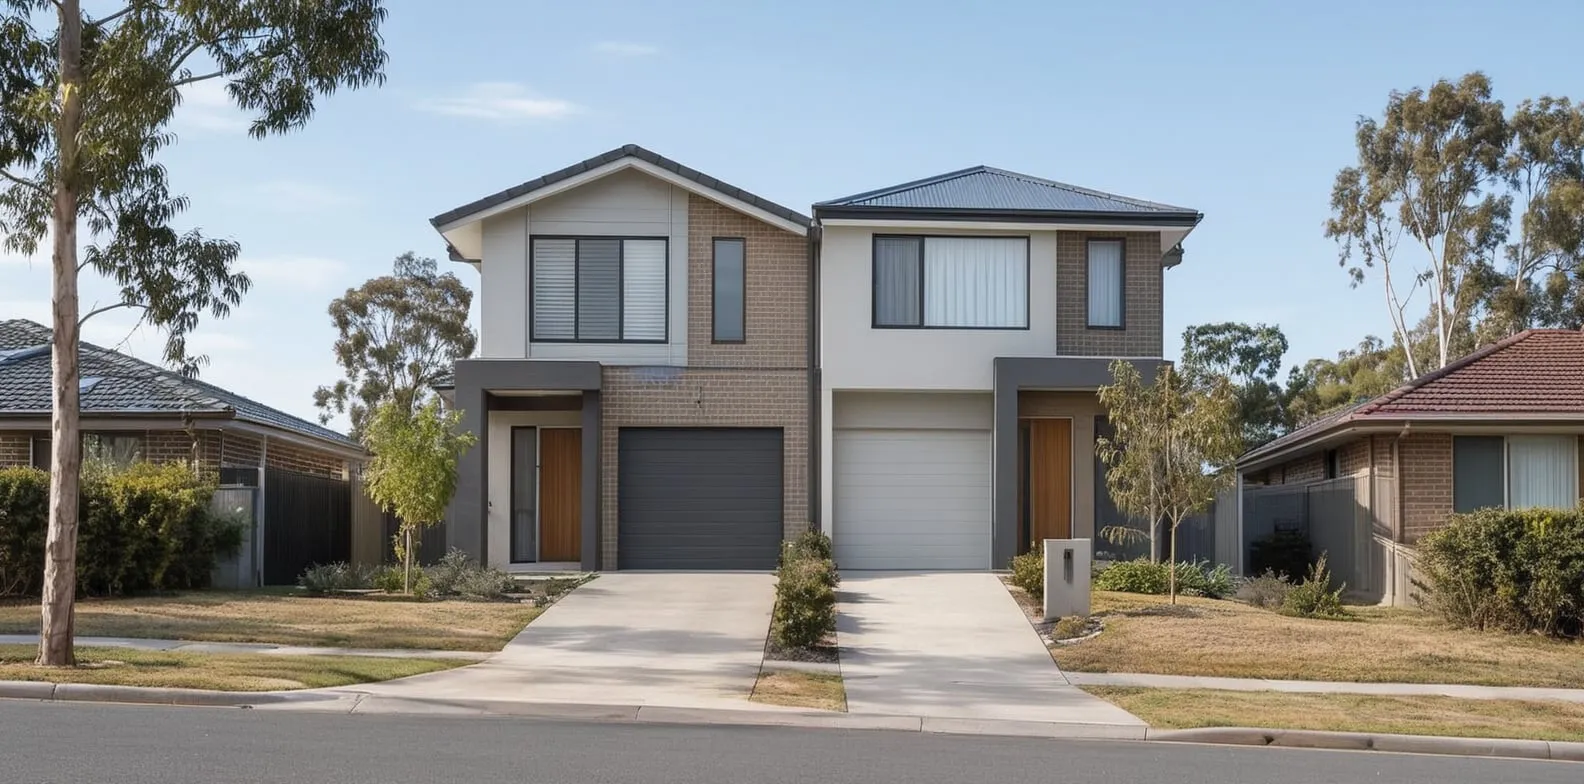
Published 23 June 2026
Australia approved 34,488 semi-detached dwellings, townhouses and duplexes in 2025, the highest annual total since 2017 and up 20.8% from the year before. These dwellings made up 17.6% of all new residential approvals nationally, compared with 13.5% in 2015. NSW and Victoria together accounted for about 64% of the total.
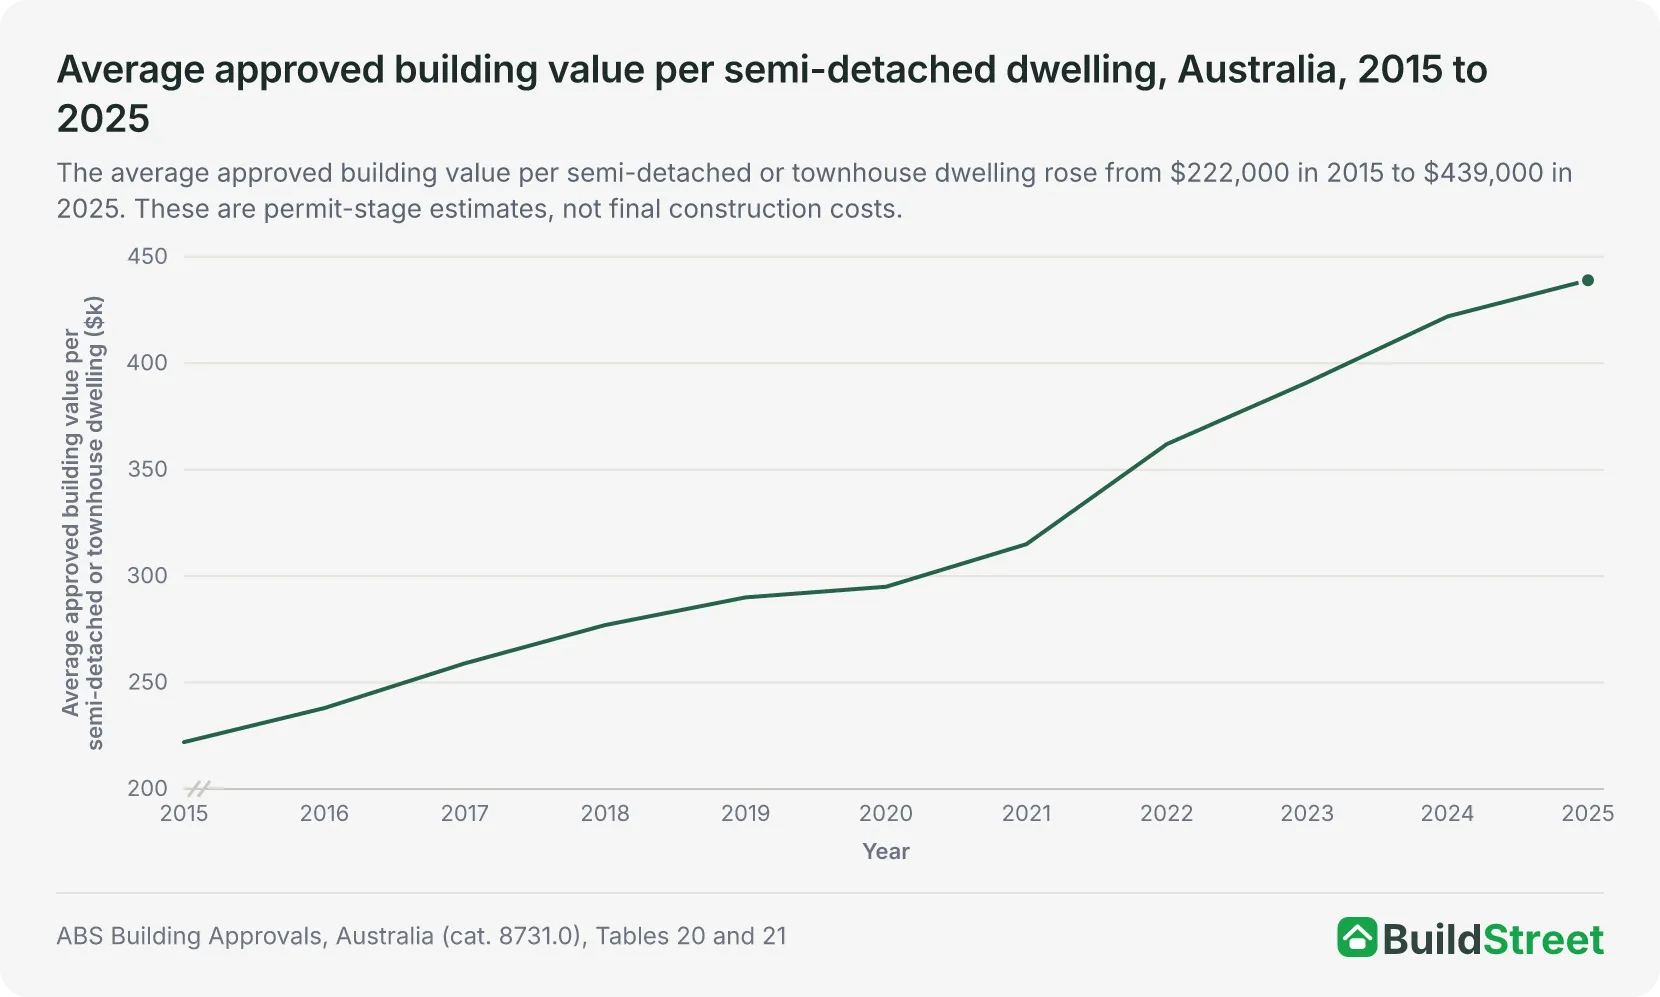
The average approved building value per semi-detached or townhouse dwelling reached $439,000 in 2025, up from $422,000 in 2024 and $222,000 in 2015. This is the estimated value of building work declared at permit stage, not the final build cost, total development cost or project cost.
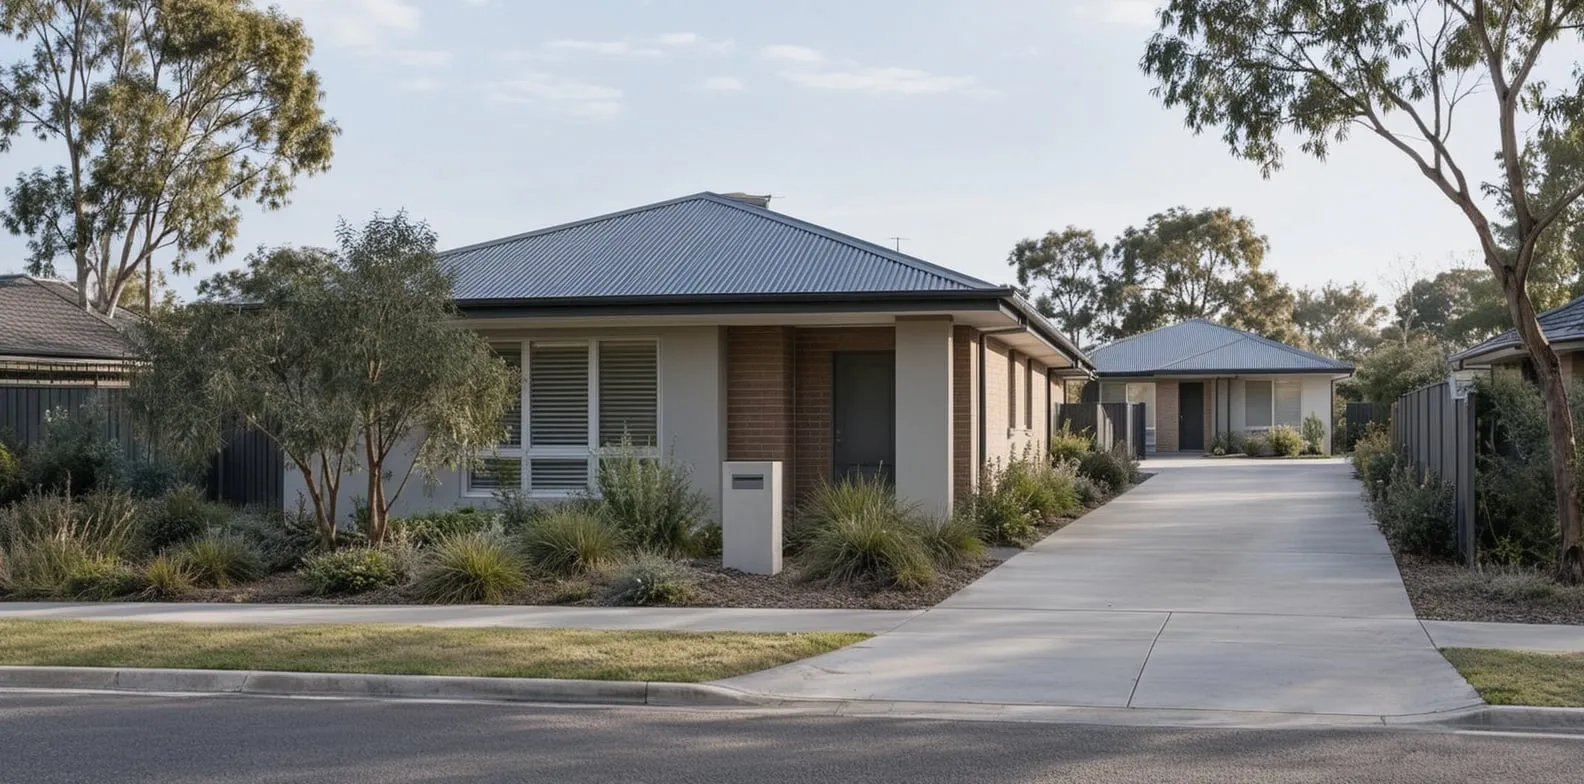 Dual occupancy in Australia 2026: rules, approvals and how it differs from duplexesDual occupancy generally means* two dwellings on one lot,* although the exact rules differ by state and territory. Australia does not publish a national dual occupancy approvals dataset, so this artic…
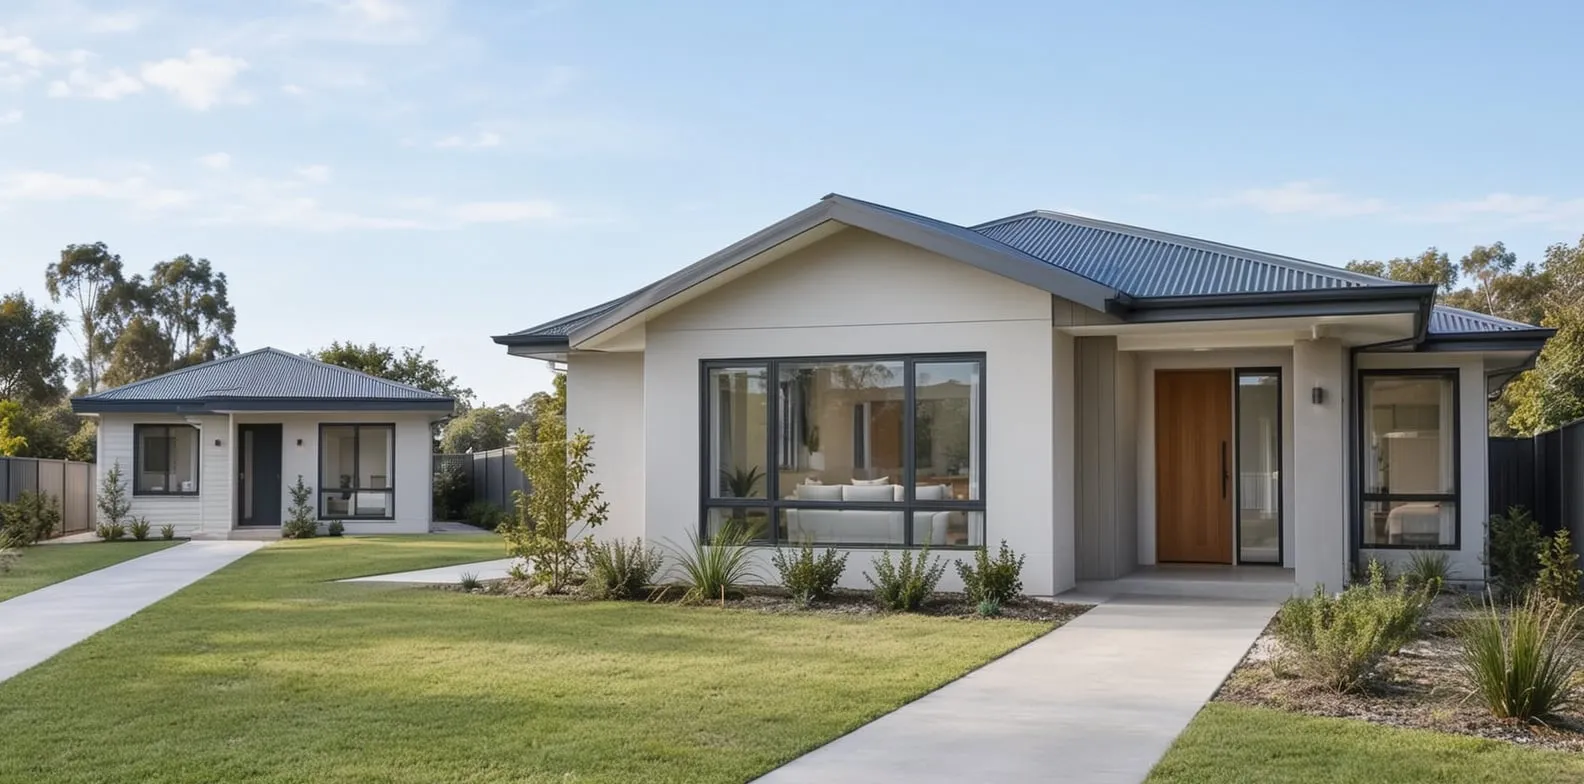 Granny flats in Australia: data, rules, costs and official gapsGranny flats are allowed in every Australian state and territory, but the data is fragmented across industry estimates, planning approvals, building permits and state rules. The clearest available bui…
What does the ABS semi-detached category include?
The ABS groups duplexes, semi-detached pairs, terraces, row houses and townhouses into a single category: "semi-detached, row or terrace houses, townhouses." It covers attached dwellings that are not detached houses or apartments. Duplexes are included in this category, but they are not counted separately in the national ABS series.
What does the ABS semi-detached category include?
South Australia and Western Australia recorded the strongest growth, with approvals increasing by 78.7% and 73.8% respectively. NSW also grew by 22.0% and contributed the largest absolute increase of any state. Planning reforms in several states may support more attached-housing approvals over time, but the ABS approvals data does not isolate the effect of those policies.
Section 01 · National approvals
How many semi-detached homes are approved in Australia?
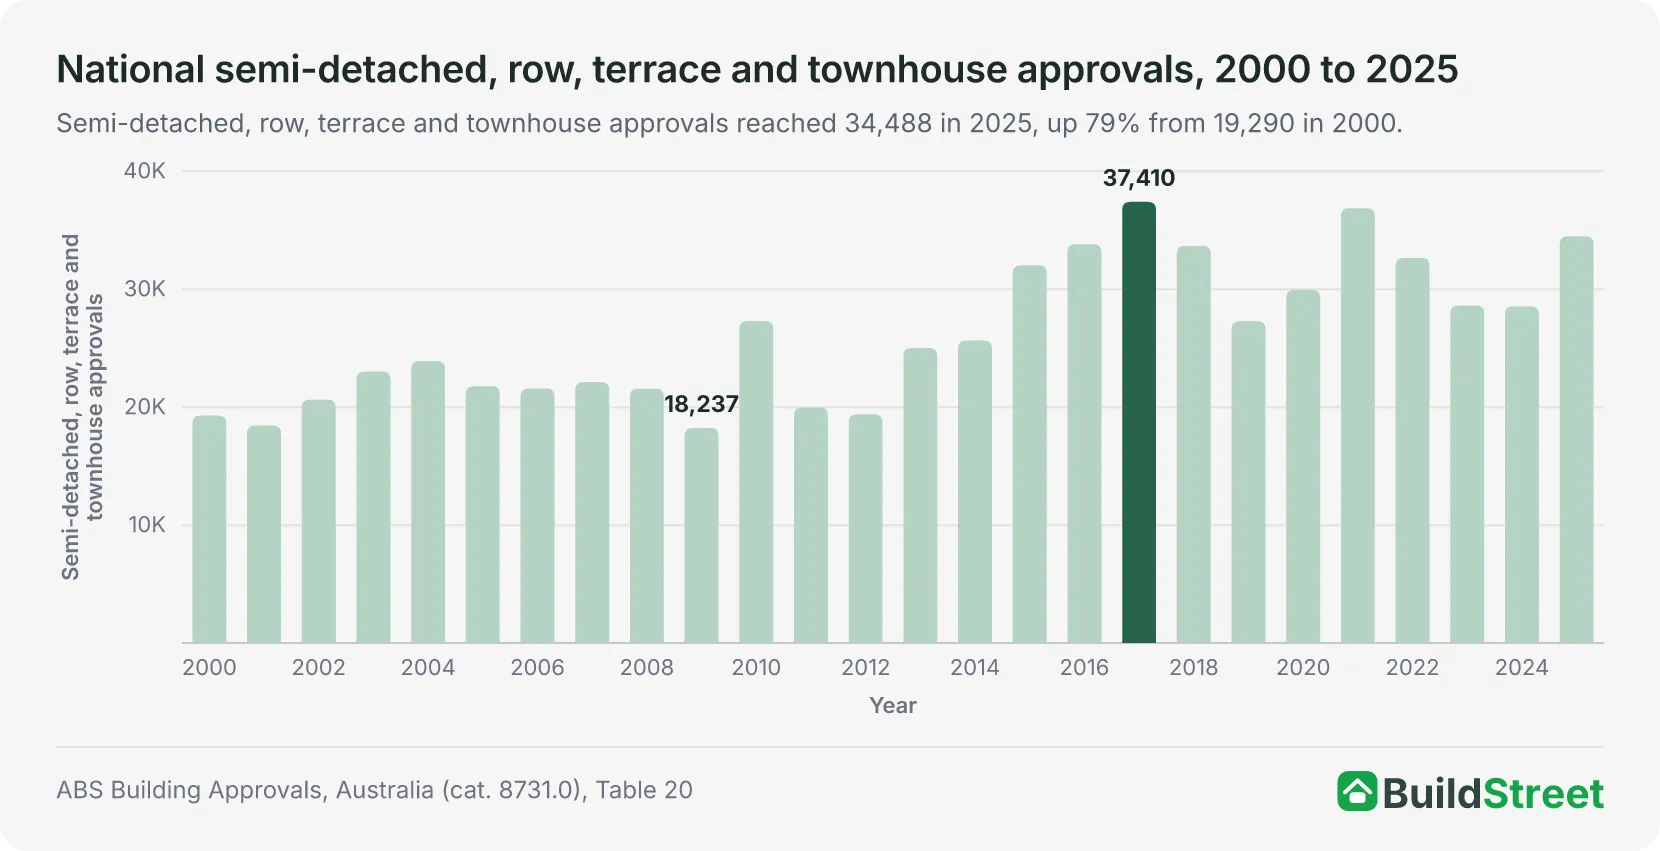
Semi-detached, row, terrace and townhouse approvals rose 20.8% in 2025 to reach 34,488, the highest annual total since 2017. These dwellings made up 17.6% of all new residential approvals nationally, up from 13.5% in 2015.
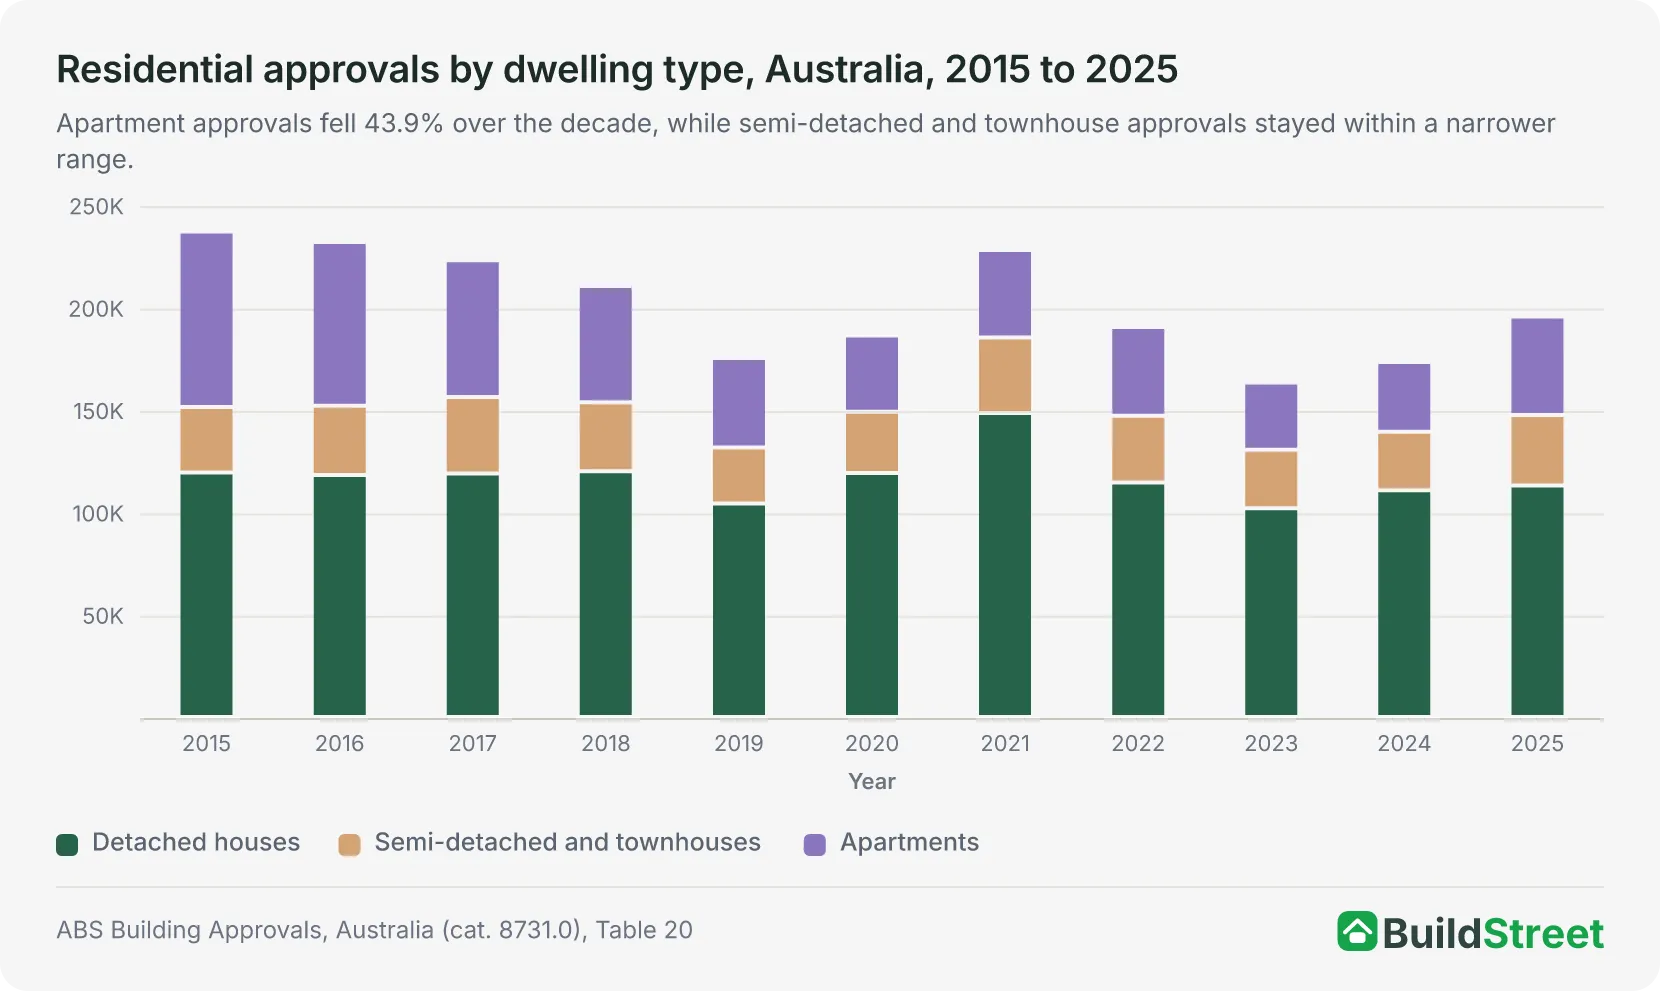
The increase in share reflects both higher semi-detached and townhouse approvals and a decline in apartment approvals over the decade. Apartment approvals fell from 85,695 in 2015 to 48,108 in 2025, a decline of 43.9%.
Over the longer term, annual semi-detached, row, terrace and townhouse approvals increased by about 79% from 19,290 in 2000 to 34,488 in 2025. Approvals reached 37,410 in 2017, fell to 27,294 in 2019, recovered to 36,877 in 2021, dropped again to 28,546 in 2024, and rebounded to 34,488 in 2025.
Semi-detached and townhouse approvals compared with houses and apartments
| New residential approvals by dwelling type, Australia, 2025 | ||
|---|---|---|
| Dwelling type | Share of approvals | Approvals |
| Detached houses | 57.8% | 113,088 |
| Semi-det & townhouses | 17.6% | 34,488 |
| Apartments | 24.6% | 48,108 |
Source · ABS Building Approvals, Australia (cat. 8731.0), Table 20, calendar year 2025, original series.
One-storey and multi-storey semi-detached approvals
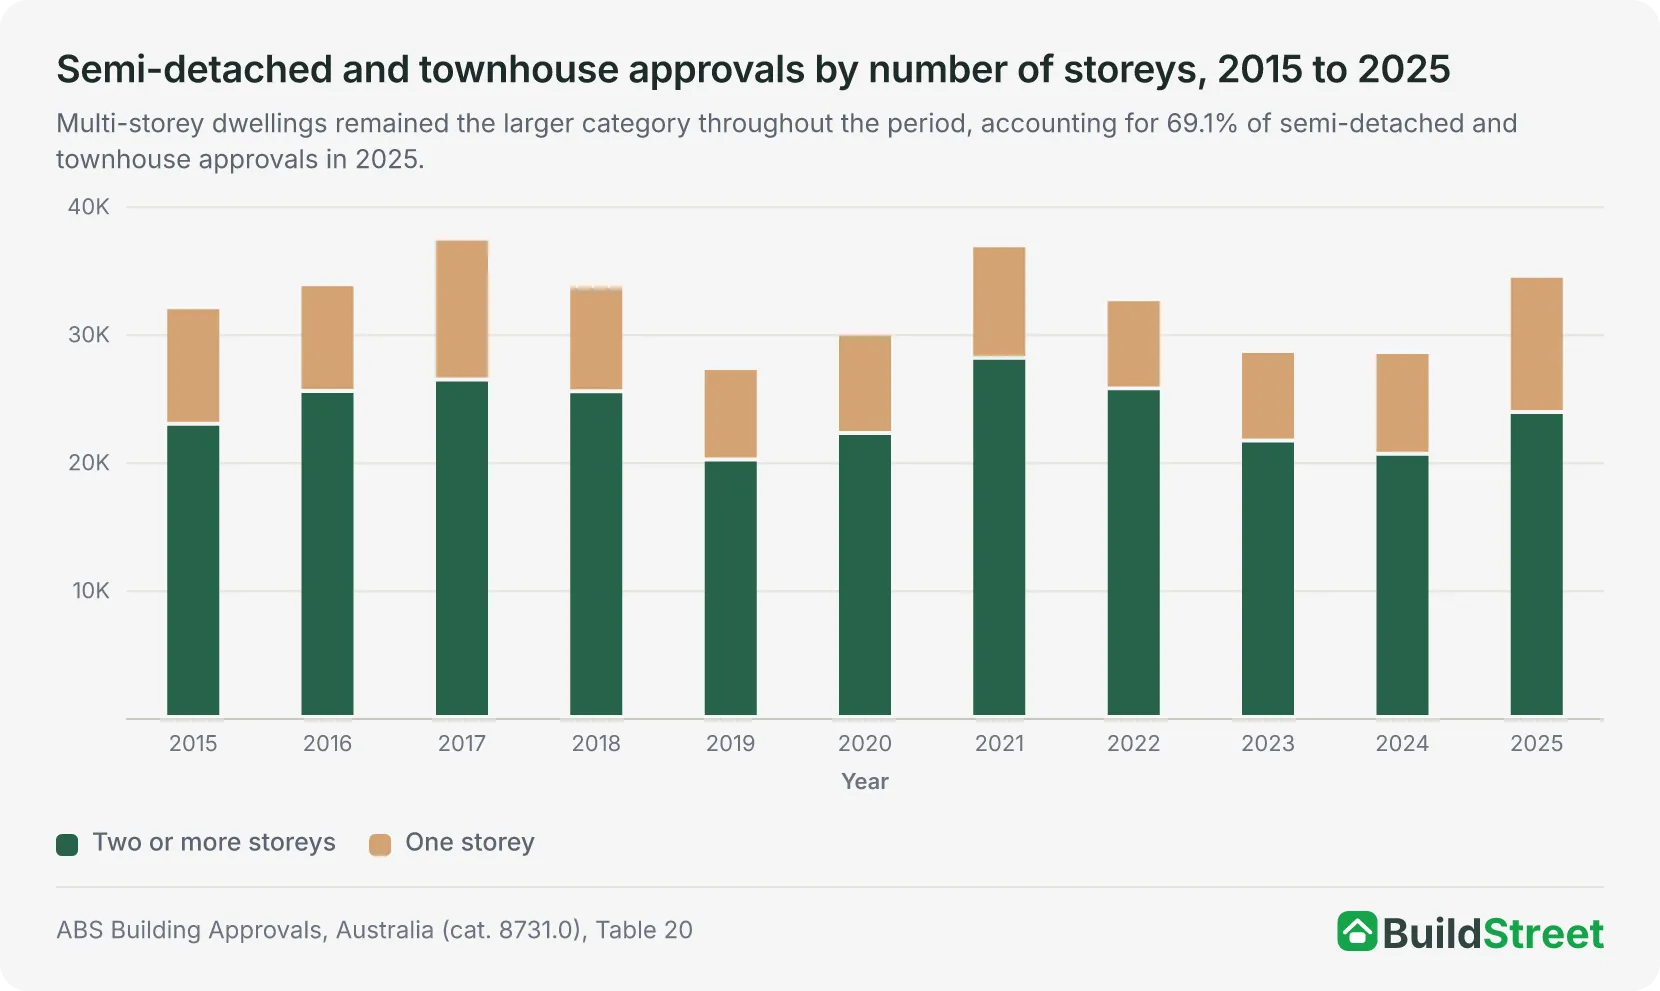
Most semi-detached, row, terrace and townhouse approvals are for multi-storey formats. In 2025, two-or-more-storey dwellings made up 23,848 of the 34,488 total, or 69.1%. One-storey dwellings accounted for the remaining 10,640, or 30.9%.
One-storey approvals grew faster year-on-year, up 33.7% from 7,958 in 2024. Two-or-more-storey approvals rose 15.8% from 20,588 over the same period.
Multi-storey formats have dominated semi-detached and townhouse approvals throughout the decade, accounting for at least 69% of approvals in every year since 2015. The two-or-more-storey share peaked at 78.7% in 2022 and fell to 69.1% in 2025. One-storey dwellings, which may include some side-by-side duplex construction on wider lots, ranged between 21.3% and 30.9% of the total from 2015 to 2025.
Show full table
| Storey breakdown table, 2015 to 2025 | |||||
|---|---|---|---|---|---|
| Year | One storey | Two or more storeys | Total | One-storey share | Two+ share |
| 2015 | 9,120 | 22,921 | 32,041 | 28.5% | 71.5% |
| 2016 | 8,335 | 25,490 | 33,825 | 24.6% | 75.4% |
| 2017 | 11,015 | 26,395 | 37,410 | 29.4% | 70.6% |
| 2018 | 8,213 | 25,476 | 33,689 | 24.4% | 75.6% |
| 2019 | 7,166 | 20,128 | 27,294 | 26.3% | 73.7% |
| 2020 | 7,763 | 22,203 | 29,966 | 25.9% | 74.1% |
| 2021 | 8,800 | 28,077 | 36,877 | 23.9% | 76.1% |
| 2022 | 6,964 | 25,693 | 32,657 | 21.3% | 78.7% |
| 2023 | 6,993 | 21,626 | 28,619 | 24.4% | 75.6% |
| 2024 | 7,958 | 20,588 | 28,546 | 27.9% | 72.1% |
| 2025 | 10,640 | 23,848 | 34,488 | 30.9% | 69.1% |
Source · ABS Building Approvals, Australia (cat. 8731.0), Table 20, original series, calendar year totals.
Section 02 · Decade trend
Semi-detached, townhouse and duplex approval trends in Australia
Semi-detached, row, terrace and townhouse approvals fell 22.6% between 2021 and 2024, dropping from 36,877 to 28,546, before recovering to 34,488 in 2025. Over the decade from 2015 to 2025, annual approvals ranged from 27,294 to 37,410. This was a narrower range than detached houses, which ranged from 101,972 to 148,493, and apartments, which ranged from 32,798 to 85,695.
Detached house approvals reached 148,493 in 2021, while semi-detached and townhouse approvals reached 36,877 in the same year. Both categories then declined before semi-detached and townhouse approvals recovered to 34,488 in 2025.
The 2025 recovery came from growth across several states, rather than one state alone.
Show full table
| Full national historical table, 2015 to 2025 | |||||
|---|---|---|---|---|---|
| Year | Houses | Semi-det & townhouses | Apartments | Total residential | Semi-det share |
| 2015 | 119,431 | 32,041 | 85,695 | 237,167 | 13.5% |
| 2016 | 118,219 | 33,825 | 80,077 | 232,121 | 14.6% |
| 2017 | 118,974 | 37,410 | 66,791 | 223,175 | 16.8% |
| 2018 | 120,059 | 33,689 | 56,776 | 210,524 | 16.0% |
| 2019 | 104,382 | 27,294 | 43,700 | 175,376 | 15.6% |
| 2020 | 119,227 | 29,966 | 37,207 | 186,400 | 16.1% |
| 2021 | 148,493 | 36,877 | 42,749 | 228,119 | 16.2% |
| 2022 | 114,571 | 32,657 | 43,392 | 190,620 | 17.1% |
| 2023 | 101,972 | 28,619 | 32,798 | 163,389 | 17.5% |
| 2024 | 110,790 | 28,546 | 34,146 | 173,482 | 16.5% |
| 2025 | 113,088 | 34,488 | 48,108 | 195,684 | 17.6% |
Source · ABS Building Approvals, Australia (cat. 8731.0), Table 20, original series, calendar year totals.
Section 03 · State and territory
Semi-detached, townhouse and duplex approvals by state and territory
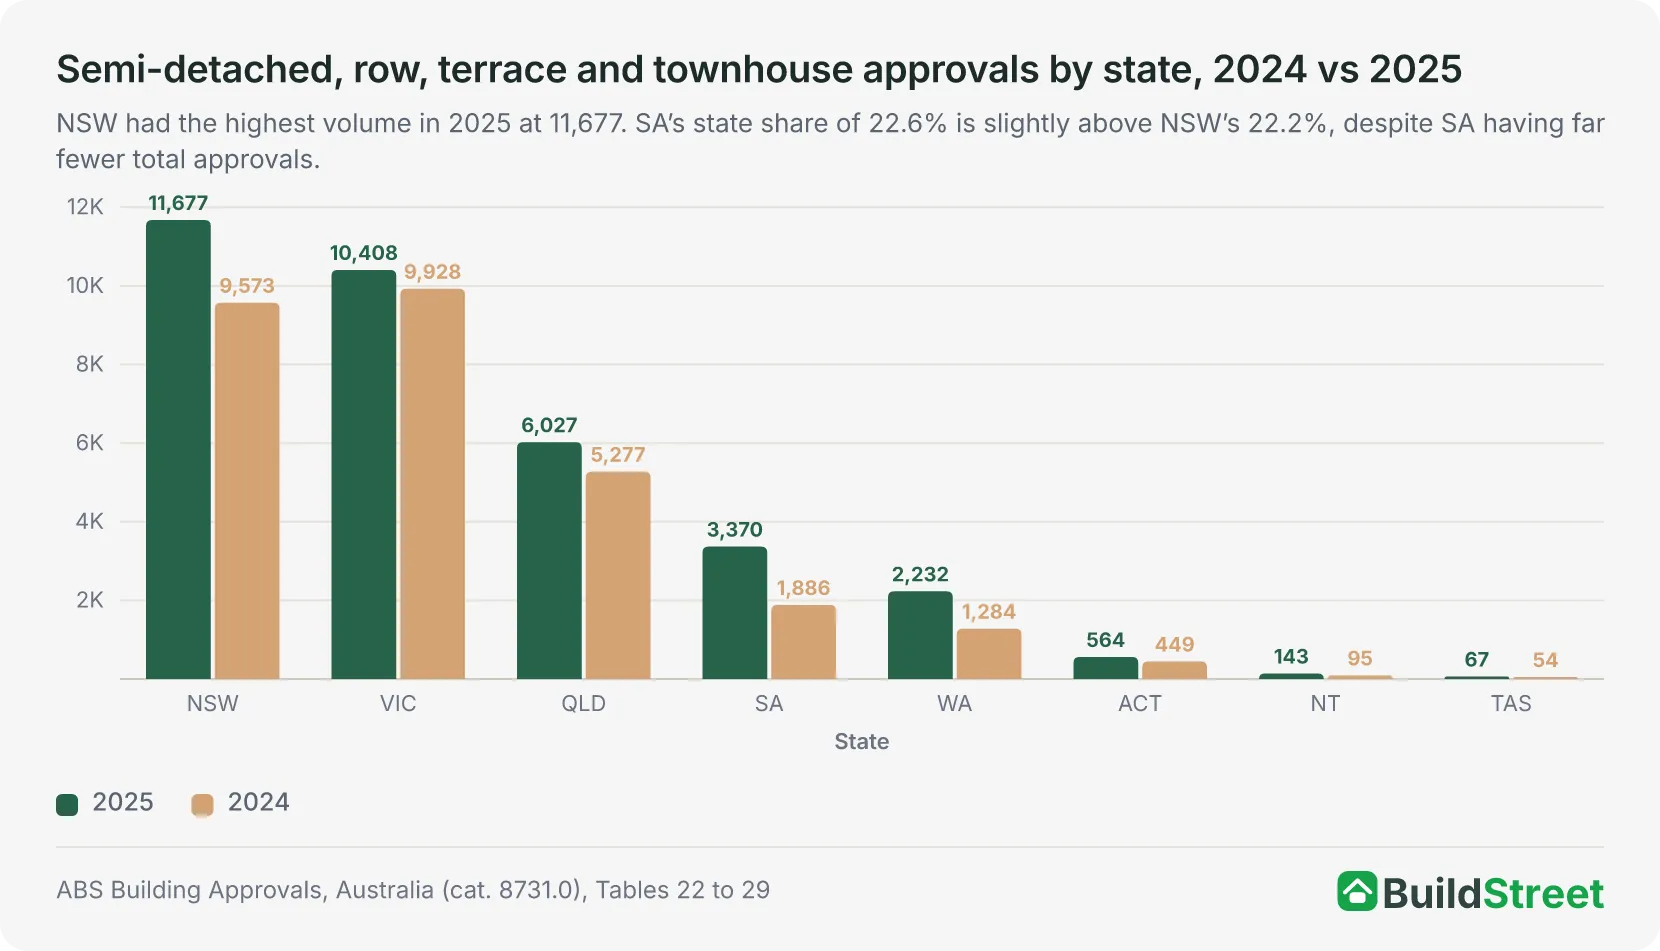
NSW and Victoria together accounted for 64% of Australia’s 34,488 semi-detached, row, terrace and townhouse approvals in 2025. NSW led with 11,677 approvals, up 22.0% on 2024. Victoria followed with 10,408, up 4.8%. Queensland added 6,027, up 14.2%.
South Australia recorded the largest percentage increase of any state, rising from 1,886 to 3,370, up 78.7%. Semi-detached and townhouse dwellings made up 22.6% of all residential approvals in South Australia in 2025, up from 15.1% in 2024. This was slightly higher than NSW at 22.2% and Victoria at 19.1%.
Western Australia recorded the second-largest percentage increase, rising from 1,284 approvals in 2024 to 2,232 in 2025, an increase of 73.8%. Its semi-detached and townhouse share of residential approvals increased from 6.1% to 9.3%. South Australia and Western Australia recorded strong percentage growth from lower approval volumes than NSW and Victoria.
Tasmania recorded 67 approvals in 2025, equal to 2.8% of its state residential total. The Northern Territory recorded 143 approvals, equal to 17.5% of its territory residential total.
Show table · Note: Semi-detached totals combine one-storey and two-or-more-storey classifications. Calendar year totals.
| Full state and territory table, 2022 to 2025 | |||||||
|---|---|---|---|---|---|---|---|
| State/territory | 2022 | 2023 | 2024 | 2025 | 2024 share | 2025 share | 24 to 25 chg |
| NSW | 11,961 | 9,542 | 9,573 | 11,677 | 21.8% | 22.2% | +22.0% |
| Victoria | 11,858 | 10,797 | 9,928 | 10,408 | 18.5% | 19.1% | +4.8% |
| Queensland | 4,923 | 4,645 | 5,277 | 6,027 | 14.2% | 14.3% | +14.2% |
| South Australia | 1,810 | 1,868 | 1,886 | 3,370 | 15.1% | 22.6% | +78.7% |
| Western Australia | 605 | 918 | 1,284 | 2,232 | 6.1% | 9.3% | +73.8% |
| ACT | 1,231 | 682 | 449 | 564 | 20.6% | 12.6% | +25.6% |
| Northern Territory | 82 | 56 | 95 | 143 | 18.4% | 17.5% | +50.5% |
| Tasmania | 187 | 111 | 54 | 67 | 2.2% | 2.8% | +24.1% |
| Australia | 32,657 | 28,619 | 28,546 | 34,488 | 16.5% | 17.6% | +20.8% |
Source · ABS Building Approvals, Australia (cat. 8731.0), Tables 20 to 29, original series.
Semi-detached and townhouse approvals grew fastest in South Australia and Western Australia
South Australia added 1,484 semi-detached, row, terrace and townhouse approvals in 2025, rising from 1,886 in 2024 to 3,370 in 2025. Its share of state residential approvals increased from 15.1% to 22.6%, the highest share among the states in the data shown.
Western Australia recorded its fourth consecutive annual increase in semi-detached and townhouse approvals, rising from 605 in 2022 to 918 in 2023, 1,284 in 2024 and 2,232 in 2025. Its share of state residential approvals increased from 3.7% in 2022 to 9.3% in 2025. Detached houses remained the largest category of new residential approvals in WA, but semi-detached and townhouse dwellings accounted for a larger share than in previous years.
Section 04 · Approved building value
Semi-detached building values reached $15.1 billion in 2025
The total approved building value for semi-detached, row, terrace and townhouse dwellings reached $15.1 billion in 2025, up 25.7% from $12.1 billion in 2024. This represented 14.8% of the $102.2 billion in total residential approved building value for the year.
Approved building value increased faster than the number of approvals in 2025. Total approved value rose 25.7%, while approvals rose 20.8%. The average approved building value per semi-detached or townhouse dwelling increased from $422,000 in 2024 to $439,000 in 2025, a rise of about 4%.
By comparison, the average approved building value for a detached house increased from $479,000 to $508,000 over the same period, a rise of about 6%.
The smaller increase in the semi-detached and townhouse average may partly reflect the state mix of approvals in 2025. South Australia and Western Australia both recorded approval increases of more than 73%, and both had below-average approved values per dwelling. This may have limited the increase in the national average compared with a scenario where more growth occurred in higher-value states such as NSW or Victoria.
- 2015 national average
- $222k
- Per approved dwelling
- 2021 national average
- $315k
- Per approved dwelling
- 2025 national average
- $439k
- Per approved dwelling
Approved values by state
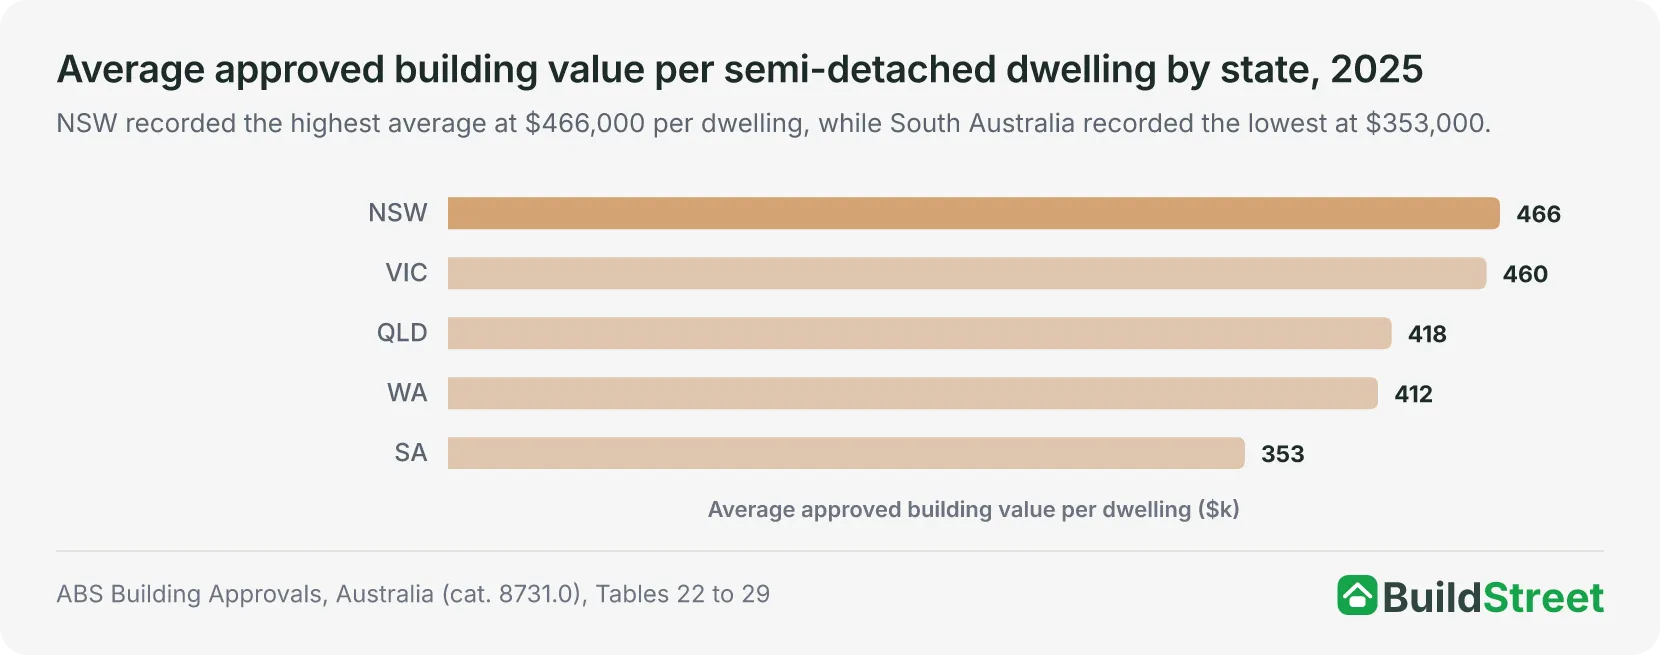
NSW accounted for $5.4 billion of the $15.1 billion total in 2025, or 36%. Victoria added $4.8 billion, or 32%. Together, the two states accounted for 68% of all approved semi-detached and townhouse building value nationally. This reflected their higher approval volumes and higher average approved values per dwelling compared with most other states.
Section 05 · Approved value vs actual cost
Approved building value vs actual construction cost
The average approved building value per semi-detached or townhouse dwelling rose 98% over the decade, from $222,000 in 2015 to $439,000 in 2025. This figure is the estimated value of building work declared at permit stage. It is not the final construction cost, total project cost or market value of the dwelling.
The declared figure may come from a preliminary builder’s estimate, an architect’s cost plan, a contract price or the applicant’s own estimate. These figures can differ from the final amount paid to complete the work.
Section 06 · Construction cost context
Approved building value for duplex-style dwellings
Based on 2025 permit data, the implied approved building value for a two-unit duplex in Australia is approximately $878,000, derived by doubling the average approved value of $439,000 per semi-detached dwelling.
This is a permit-stage building value only. It is not a final duplex construction cost or total project cost. It excludes land, demolition, professional fees, council contributions, finance costs and other project expenses.
State-level implied two-unit figures range from $706,000 in South Australia to $932,000 in NSW. These figures reflect differences in average approved building values across states, not final duplex construction costs. Total project costs vary by location, design, site conditions, approvals, materials and other project-specific factors, and cannot be reliably estimated from permit data alone.
Section 07 · Why approvals are growing
Why semi-detached, townhouse and duplex approvals are increasing
Semi-detached, row, terrace and townhouse approvals have grown by about 79% since 2000 and represented 17.6% of all new residential approvals in 2025, up from 13.5% in 2015.
Several factors may be supporting this shift, including planning policy changes, higher use of attached housing in established suburbs and smaller average household sizes. The approvals data shows the change in dwelling mix, but it does not prove the exact cause of that change.
Attached housing in established suburbs
Semi-detached dwellings, townhouses and duplexes can add more homes on existing residential land than a single detached house. This makes attached housing relevant in established suburbs where land is limited and housing demand is higher. The ABS approved-value data should not be used to measure land-cost savings. Approved building value reflects the estimated value of building work declared at permit stage, not the price of land or the total project cost.
Planning policy changes
State governments have introduced planning reforms that allow more semi-detached, townhouse and duplex-style dwellings in selected areas. NSW’s Low and Mid-Rise Housing Policy includes dual occupancies, terraces, townhouses and low-rise apartments in more locations near town centres and transport hubs. Victoria’s two-homes-on-a-lot policy provides a VicSmart pathway for eligible projects, with a statutory assessment timeframe of 10 business days. These policies may support more attached-housing approvals over time, although the ABS approvals data does not isolate the effect of individual planning reforms.
Smaller households
The average Australian household size fell from 2.6 people in 2016 to 2.5 people in the 2021 Census. Smaller households can increase demand for a wider range of dwelling types, including townhouses, duplexes and other attached homes. This does not mean household size alone caused the increase in approvals. It is one demographic factor that may help explain why attached dwellings form a larger share of new residential approvals.
NSW Low and Mid-Rise Housing Policy
NSW Planning’s Low and Mid-Rise Housing Policy aims to deliver around 112,000 new homes over five years, including dual occupancies, terraces, townhouses and apartments in more locations near town centres and train stations. The policy introduces complying development certificate pathways in eligible zones, which can reduce approval time compared with a full development application.
Victoria: two homes on a lot policy
Victoria’s two-homes-on-a-lot policy allows eligible projects to use a fast-track VicSmart pathway with a statutory timeframe of 10 business days. The policy covers building a second home, replacing one house with two new dwellings and subdividing a lot.
References
- ABS Building Approvals, Australia (latest release, Cat. 8731.0) · Australian Bureau of Statistics
- NSW Planning, Low and Mid-Rise Housing Policy · planning.nsw.gov.au
- Victorian Department of Transport and Planning, Faster approvals for two homes on a lot and subdivisions · planning.vic.gov.au
- ABS Snapshot of Australia, 2021 · Australian Bureau of Statistics
Methodology and data notes
National and state, and territory approval and value figures are from ABS Building Approvals, Australia (cat. 8731.0), Tables 20 to 29, original series. Calendar-year totals are calculated by summing monthly original-series values from January to December. This is a 2026 update using full-year 2025 data. More recent monthly ABS releases are available for 2026, but partial-year figures are not used for annual comparisons. The ABS category “semi-detached, row or terrace houses, townhouses” combines one-storey and two-or-more-storey dwellings. It includes duplexes, but it is broader than duplexes alone. The figures in this article are therefore not a pure count of duplex approvals. Average approved building values per dwelling are calculated by dividing total approved building value ($'000 series) by total approved dwelling units. These are derived indicators, not official ABS statistics. The analysis is limited to national, state and territory figures. No suburb-level, LGA-level or city-level claims are made.
