

Published 26 May 2026 · Updated 28 Sept 2026
Western Australia completed 22,516 homes in 2024–25. That was about 87% of the 25,800 homes a year needed to meet its 129,000-home National Housing Accord target by June 2029.
WA is projected to reach that target by December 2029, two quarters after the deadline.1 That puts it alongside Victoria as one of the strongest-performing states.
At state level, the forecast looks solid. But Perth tells a more pressured story. Greater Perth added 58,088 residents in 2024–25, the fastest growth rate of any capital city.2 At the same time, it approved only 335 new dwellings per 1,000 new residents, the lowest rate among the four largest capitals.
 Is Australia on track to build 1.2 million homes by June 2029?Australia has completed 307,635 homes in the first seven quarters of the National Housing Accord, leaving the country 112,365 homes behind the pace needed to reach 1.2 million by June 2029. Australia…
 The states with the fastest and slowest home build times in AustraliaBuilding a new home in Australia involves two key waiting periods: approval to commencement (the time from receiving planning approval to breaking ground), and commencement to completion (the time fro…
Section 01 · The housing target
WA's 129,000-home target: how much has been built?
WA completed 22,516 dwellings in 2024–25, the state's best annual result since 2016–17. That was equal to 87% of the annual pace needed to meet its National Housing Accord target.
WA is expected to reach its 129,000-home target by December 2029, two quarters after the June 2029 deadline. Among the states, only Victoria is forecast to finish as close to the deadline.
The National Housing Accord aims to deliver 1.2 million new homes across Australia between July 2024 and June 2029. WA's share is 129,000 homes, based on its population share when the Accord was agreed in 2022. That means the state needs to build about 25,800 homes a year.
As at the March quarter 2026, WA had built 29% of its target, or about 37,410 homes.1 That leaves around 91,590 homes still to be completed.
By June 2026, WA had also approved 38% of its target, or about 49,020 homes.1 That leaves around 79,980 homes not yet approved.
Current forecasts estimate WA will reach about 129,000 gross new homes by December 2029, two quarters after the Accord deadline.
WA Housing Accord progress
Cumulative progress against the target of 129,000 homes by June 2029, with completions to the March quarter 2026.
29%
- 2023-2418,067
- 2024-2522,516
— Target pace per year: 25,800
How WA compares to other states
WA has built 29% of its National Housing Accord target so far, the second-highest share among the larger states behind Victoria at 32%.1
The bigger difference is the expected completion date. WA and Victoria are both projected to reach their targets by December 2029, two quarters after the June 2029 deadline. NSW is projected to miss the deadline by nearly three years, while the Northern Territory is projected to miss it by more than five years.1
| State / Territory | Target (homes) | % built | % approved | Expected delivery |
|---|---|---|---|---|
| Western Australia | 129,000 | 29% | 38% | Dec 2029 |
| Victoria | 306,000 | 32% | 37% | Dec 2029 |
| Queensland | 246,000 | 24% | 35% | Mar 2031 |
| New South Wales | 376,000 | 21% | 27% | Mar 2032 |
| South Australia | 84,000 | 28% | 35% | Mar 2031 |
| Tasmania | 26,000 | 16% | 20% | Jun 2034 |
| Australia (total) | 1,200,000 | 26% | 33% | Dec 2030 |
Source · NHSAC Quarterly Report, August 2026. Target homes for each jurisdiction are NHSAC's published population-share allocations of the 1.2 million national target (State of the Housing System 2026, Table 4.1). "Built" and "approved" shares are NHSAC's cumulative percentages from the August 2026 report (completions to the March quarter 2026, approvals to June 2026). "Expected delivery" reflects NHSAC's modelled quarter when each jurisdiction's share is forecast to be met.
Section 02 · State comparison
Population growth vs new homes: Perth is under more pressure than WA overall
Greater Perth approved just 335 dwellings per 1,000 new residents in 2024–25. That was the lowest rate among Australia's four largest capitals, even though Perth had the fastest population growth of any capital city at 2.4%.2
At the state level, WA added 66,235 residents and completed 22,516 dwellings in 2024–25. That works out to 340 dwellings per 1,000 new residents, almost the same as Queensland at 346, but below Victoria at 459 and NSW at 425.
At the capital-city level, Greater Perth's 335 approvals per 1,000 new residents compares with 374 in Greater Brisbane, 444 in Greater Melbourne and 446 in Greater Sydney.
| Capital city | Population growth 2024–25 | Housing flow FY2024–25 (approvals) | Homes per 1,000 residents added | Residents added per home |
|---|---|---|---|---|
| Greater Perth | +58,088 | 19,462 | 335 | 2.98 |
| Greater Brisbane | +58,223 | 21,765 | 374 | 2.68 |
| Greater Melbourne | +105,030 | 46,590 | 444 | 2.25 |
| Greater Sydney | +75,230 | 33,569 | 446 | 2.24 |
Source · ABS Regional Population 2024–25; ABS Building Approvals (cat. 8731.0) Tables 10 and 26. Capital-city rows compare ABS Regional Population growth in 2024–25 with FY2024–25 original GCCSA dwelling approvals. Capitals use approvals because completions are not separately published at the GCCSA level.
Section 03 · Approvals
WA housing approvals remain below historical peaks
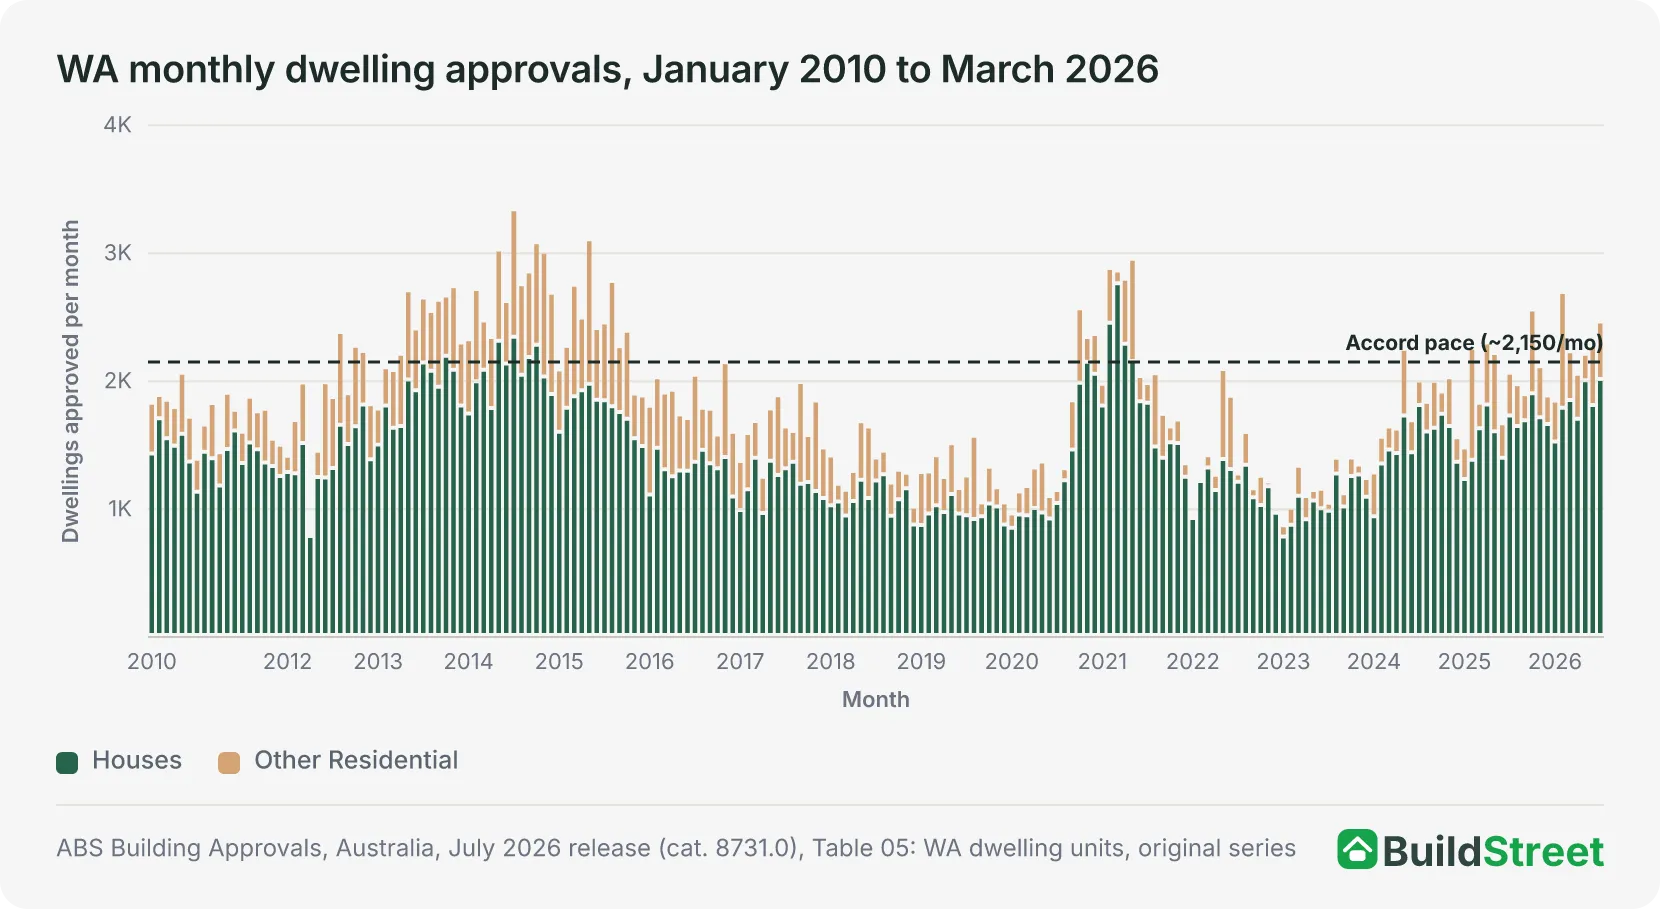
WA approved 25,653 dwellings in 2025–26, up 11.8% from 22,950 the previous year. In the 12 months to July 2026, WA approved 26,053 dwellings. That was equal to about 101% of the 25,800 homes a year needed to meet its Accord pace.
It was also the highest 12-month total since late 2021. However, approvals remain well below WA's modern peak of 33,088 dwellings in calendar 2014 during the mining boom. They have now edged past the HomeBuilder stimulus total of 25,843 in calendar 2021.
The current 12-month total is 21.3% below the 2014 peak. Monthly figures are still volatile. In July 2026, WA recorded 2,451 approvals, up 8.2% from the previous month.
Section 04 · What is actually being built
How many homes is WA completing each year?
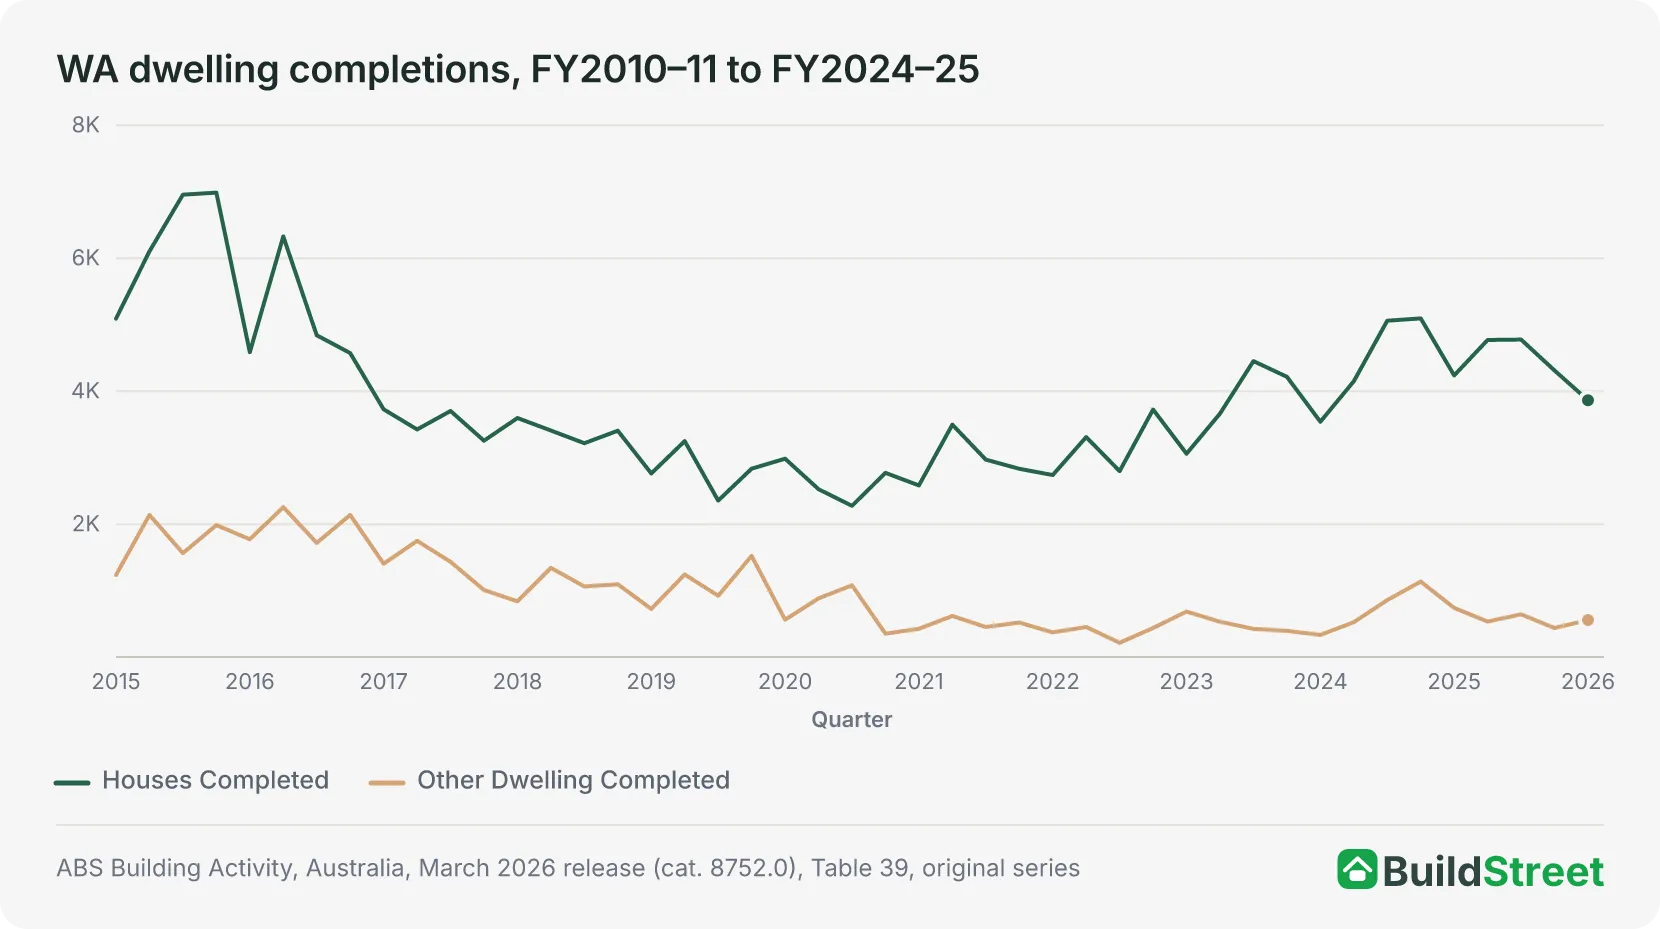
WA completed 22,516 dwellings in 2024–25, the highest annual result since 2016–17 and up 65% from the low point of 13,654 in 2020–21.
Approvals (22,950), commencements (22,533) and completions (22,516) were all within a few hundred dwellings of each other for the first time in years. This suggests much of the post-HomeBuilder backlog has cleared.
WA is still below the Accord benchmark of 25,800 completions a year. The 2024–25 result was 3,284 homes short of that pace. Completions have also eased since then: WA completed 19,963 homes in the four quarters to March 2026, including 4,441 in the March 2026 quarter, so the gap has widened rather than narrowed.
- Per day
- 62
- homes completed every day across WA
- Per week
- 433
- per week, including weekends
- Per month
- 1,876
- per month, versus 2,150 needed to match Accord pace
Section 05 · Construction pipeline
Perth land approvals are rising, but build times are slowing delivery
WA had 26,741 dwellings under construction at 31 March 2026, but only 4,441 were completed in that quarter. At that pace, it would take about 18 months to work through everything currently under construction. Build times appear to be a key bottleneck.
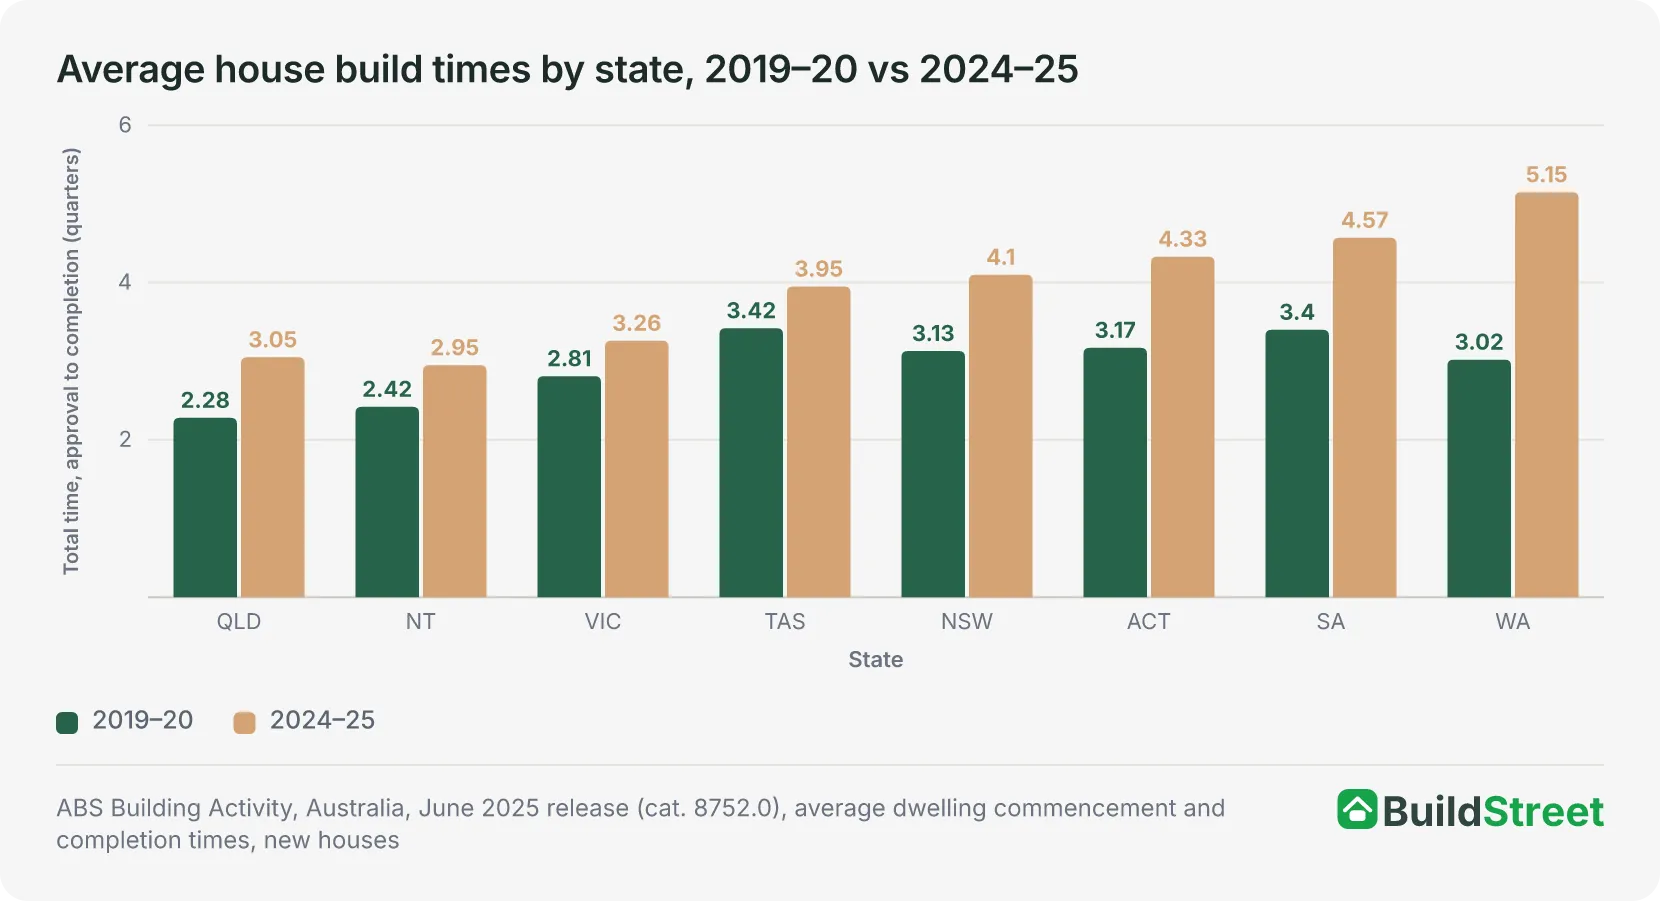
WA houses took an average of 5.15 quarters from approval to completion in 2024–25, the longest of any state or territory. While that improved from 5.95 quarters in 2023–24, it is still 70% longer than the 3.02 quarters recorded in 2019–20. For comparison, NSW recorded 4.10 quarters, South Australia 4.57, and the ACT 4.33. Victoria, Queensland and the NT all completed a house in roughly three quarters or less.
A further 3,936 dwellings had been approved but not yet started as at March 2026. Apartment and townhouse projects are moving through the pipeline more slowly, with many still under construction and relatively few reaching completion each quarter.
The land pipeline behind Perth's approvals
WA developers received conditional approval for 7,417 residential lots in the June 2026 quarter, up 25% on the previous quarter. The total conditional approval stock was largely unchanged at 59,954 lots.
Final lot approvals reached 4,417 in the same quarter, up 2% from March. About 91.5% of all final residential lot approvals were in the Perth metropolitan area.
The lot pipeline is growing, but mostly on Perth's outer fringe. New land releases in greenfield areas usually produce detached houses, so this concentration makes it harder to increase townhouse and apartment supply.
Section 06 · Housing mix
Detached houses dominate WA's new home market
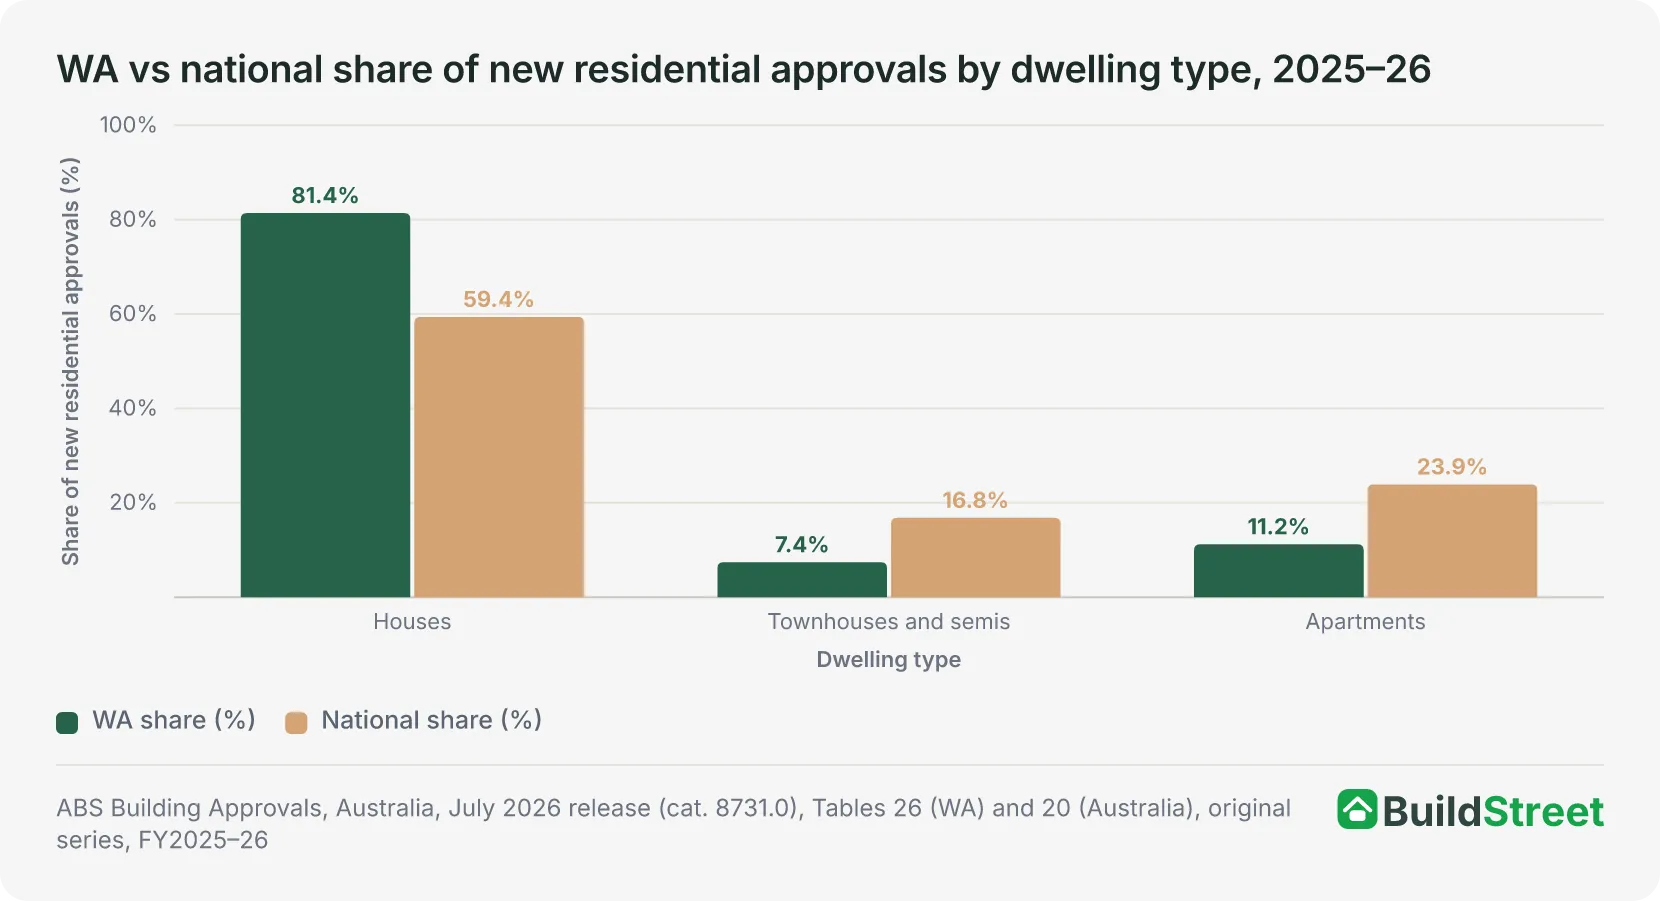
Detached houses made up 81.4% of WA's new residential approvals in 2025–26, compared with 59.4% nationally. Apartments accounted for just 11.2% of approvals, less than half the national share of 23.9%. Townhouses and semis were 7.4%, also less than half the national rate of 16.8%.
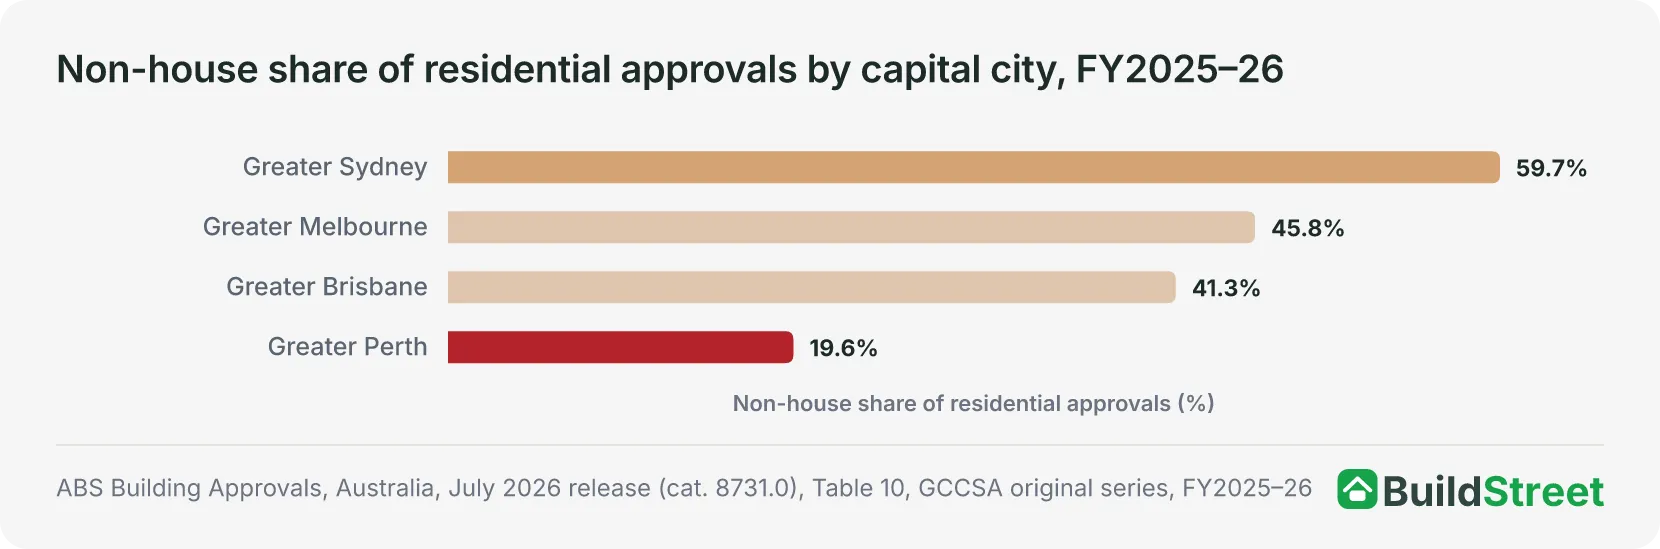
Within Greater Perth, the skew towards detached houses is even more pronounced. Apartments and townhouses made up just 19.6% of approvals in 2025–26, compared with 41.3% in Greater Brisbane, 45.8% in Greater Melbourne and 59.7% in Greater Sydney.
Where are Perth's new housing lots being approved?
Most new lot supply is concentrated in Perth's outer growth corridors. In the June 2026 quarter, Alkimos alone accounted for 266 of WA's 4,417 final residential lot approvals.
The top five metro suburbs, Alkimos, Madora Bay, Yanchep, Piara Waters and Baldivis, accounted for 1,054 lots combined. The top 10 suburbs accounted for 1,705 lots, or about 39% of all final lot approvals across WA.
In regional WA, approvals were concentrated mainly in the South West, led by Dalyellup and Donnybrook.
| # | Suburb | Final lot approvals |
|---|---|---|
| 1 | Alkimos | 266 |
| 2 | Madora Bay | 240 |
| 3 | Yanchep | 195 |
| 4 | Piara Waters | 180 |
| 5 | Baldivis | 173 |
| 6 | Eglinton | 154 |
| 7 | Hilbert | 145 |
| 8 | Mariginiup | 129 |
| 9 | Bullsbrook | 112 |
| 10 | Nedlands | 111 |
Source · WA Department of Planning, Lands and Heritage, State Lot Activity, June quarter 2026. Metro includes the Peel Region Scheme area.
Section 07 · Apartment & townhouse supply
Apartment and townhouse supply in Perth remains below the national average
Apartments and townhouses made up just 19.6% of Greater Perth's residential approvals in 2025–26. This was the lowest share of any major Australian capital. Greater Brisbane had the next lowest share at 41.3%, while Greater Melbourne recorded 45.8% and Greater Sydney 59.7%.
The gap is clearest in apartments. In WA, apartments accounted for 11.2% of new residential approvals in 2025–26, compared with the national share of 23.9%.
This suggests Perth's supply mix is still heavily weighted towards detached housing. It does not necessarily point to weak demand for apartments or townhouses. Greater Perth grew faster than any other capital in 2024–25, and demand is likely to be spread across different types of housing.
Why WA is struggling to build more townhouses and small-scale infill
Townhouses, walk-up flats and other small-scale infill projects made up just 7.4% of new residential approvals in WA in 2025–26, against 16.8% nationally. The most common barrier is cost and financing. At current construction costs, it is hard for apartment and townhouse projects to reach the level of pre-sales needed to secure a construction loan.
The WA Government's 2026–27 Budget included a $250 million Keystart Pre-sale Guarantee to help apartment projects meet those pre-sale requirements. The earlier Infrastructure Development Fund supported more than 10,000 homes across WA, including 5,400 apartments in Perth. Planning reforms around train station precincts are also aimed at encouraging more diverse housing within 800 metres of stations.
Annual approvals by dwelling type
Approvals are rising again, but both categories remain well below past highs. Apartment approvals increased from 601 in 2023 to 2,570 in 2025. Townhouse approvals more than doubled, rising from 918 to 2,238 over the same period.
However, both remain below their previous peaks. Apartment approvals reached 5,202 in 2014, while townhouse approvals reached 3,324 in 2010.
| Calendar year | Detached houses | Townhouses & semis | Apartments | Total new residential | House share | Apartment share |
|---|---|---|---|---|---|---|
| 2020 | 15,404 | 873 | 2,186 | 18,463 | 83.4% | 11.8% |
| 2021 | 22,134 | 1,029 | 2,640 | 25,803 | 85.8% | 10.2% |
| 2022 | 13,969 | 605 | 1,593 | 16,167 | 86.4% | 9.9% |
| 2023 | 12,464 | 918 | 601 | 13,983 | 89.1% | 4.3% |
| 2024 | 17,990 | 1,284 | 1,936 | 21,210 | 84.8% | 9.1% |
| 2025 | 19,211 | 2,238 | 2,570 | 24,019 | 80.0% | 10.7% |
| FY2025–26 | 20,839 | 1,883 | 2,874 | 25,596 | 81.4% | 11.2% |
Source · ABS Building Approvals, Australia, July 2026 release, Table 26.
Section 08 · Perth vs Regional WA
Perth vs Regional WA: where are most homes being built?
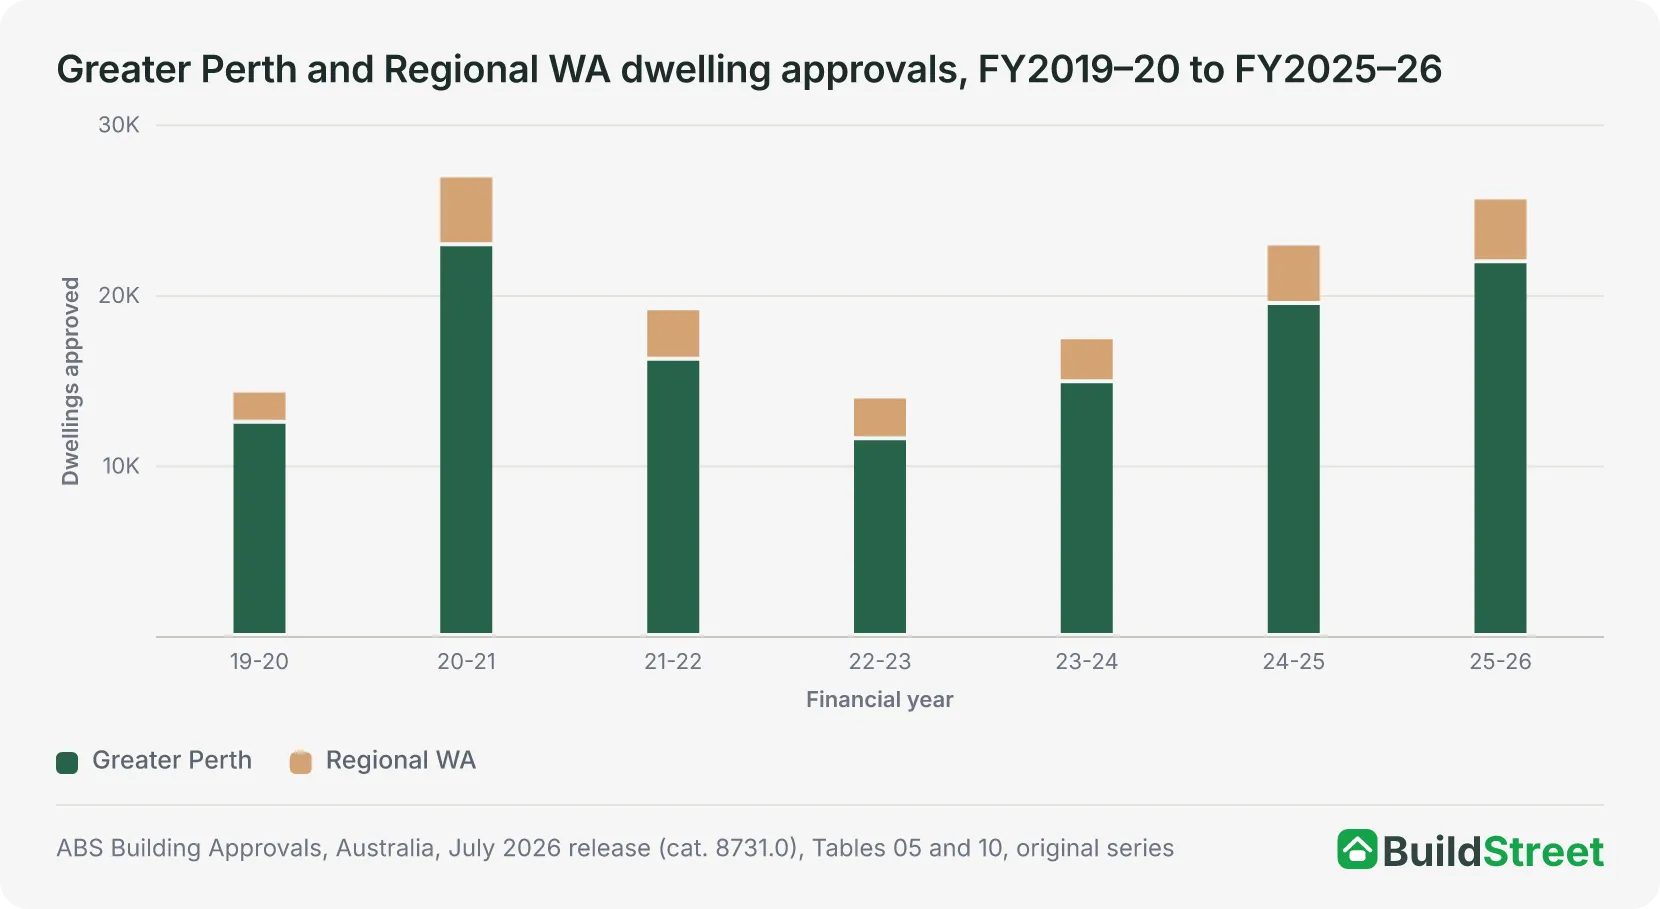
Greater Perth accounted for 87.7% of WA's population growth in 2024–25 and 84.8% of residential approvals. This is higher than its share of the state's total population, which was 80.6%.
Perth also accounted for 91.5% of all final residential lot approvals in WA in the June 2026 quarter.
Perth's share of WA approvals has stayed fairly steady over the past decade, sitting between 82% and 87% in both strong and weak market periods. With lot approvals now heavily focused in the metro area, Perth's share may rise slightly in the upcoming quarters.
Regional WA accounted for 15.2% of approvals, slightly higher than its 12.3% share of population growth. This was supported by lifestyle migration to the South West and steady demand around mining centres.
| Perth vs Regional WA shares, 2024–25 | |||
|---|---|---|---|
| Measure | Greater Perth | Rest of WA | WA total |
| Population (June 2025) | 80.6% (2,452,765) | 19.4% (591,617) | 3,044,382 |
| Population growth FY2024–25 | 87.7% (+58,088) | 12.3% (+8,147) | +66,235 |
| Residential approvals FY2024–25 | 84.8% (19,462) | 15.2% (3,488) | 22,950 |
| Final lot approvals Jun 2026 qtr | 91.5% (4,043) | 8.5% (374) | 4,417 |
Source · ABS Regional Population 2024–25; ABS Building Approvals March 2026; WA DPLH State Lot Activity June 2026.
What is slowing WA's housing supply?
WA's housing pipeline is concentrated in Perth, where about 85% of the state's housing approvals occur. The slowdown is not caused by one issue. The main pressures are labour shortages, financing constraints, land supply, slower completions and strong population growth.
Six factors stand out:
- Workforce capacity. WA's construction workforce reached a record 172,500 in February 2026, but build times have still lengthened to 5.15 quarters, up from 3.02 in 2019–20.
- Trade shortages. WA and Queensland have the hardest time finding available tradespeople of any state, with infrastructure and mining projects competing for the same workers.
- Apartment project financing. Perth apartment projects have struggled to reach the pre-sales needed to secure construction loans. The WA Government's 2026–27 Budget introduced a $250 million pre-sale guarantee specifically to address this.
- Greenfield concentration. Almost all new lots — 91.5% in the June 2026 quarter — were in the Perth metropolitan area, mostly in new land releases on the outer fringe. Most homes built on those lots are likely to be detached houses.
- Slow completion rates. 26,741 dwellings were under construction at the end of March 2026, but only 4,441 were completed in the March quarter. At that rate, it would take about 18 months to work through what is currently being built.
- Demand pressure. Greater Perth grew by 58,088 residents in 2024–25 (2.4%), the fastest of any capital city.2
In regional WA, the South West is drawing lifestyle migration faster than new lot supply can keep up. The South West made up 241 of the 374 regional lot approvals in the June 2026 quarter, led by Dalyellup (70) and Donnybrook (61). Most other regional localities recorded single-digit approvals over the same period.
Section 09 · The full picture
Will WA meet its Housing Accord target?
WA is projected to reach its 129,000-home target by December 2029, two quarters behind schedule. That is one of the strongest results among the states, alongside Victoria. Approvals are recovering, completions reached an eight-year high in 2024–25, and the backlog from earlier years is clearing.
However, the broader picture is still mixed:
- Greater Perth is growing faster than any other capital but approving fewer new homes per resident than Brisbane, Melbourne or Sydney.
- WA homes take longer to build than anywhere else in Australia.
- Perth's housing mix is the most detached-heavy of the four largest capital markets, with apartment and townhouse supply running at less than half the national share.
These issues are not expected to stop WA from meeting its Accord share. But they help explain why conditions remain tight for renters and buyers in Perth, even as the state-level numbers improve.
Population growth has been the main pressure on Perth supply
WA added 97,002 residents in 2022–23 and 87,211 in 2023–24. These were the two largest annual increases on record. In 2022–23, only 15,149 homes were completed. That worked out to 6.40 new residents for every home built.
By 2024–25, the ratio had improved to 2.94 as population growth slowed and completions increased. However, it was still above the 15-year average of around 2.7.
The population jump in the mid-2020s was driven by higher net overseas migration, more people moving from the eastern states, and steady natural population growth.
Show full tables
| Financial year | Approvals | Commencements | Completions | Completions as % of Accord pace |
|---|---|---|---|---|
| 2010–11 | 20,998 | 20,981 | 24,490 | 94.9% |
| 2011–12 | 19,275 | 17,861 | 19,915 | 77.2% |
| 2012–13 | 25,637 | 24,854 | 18,759 | 72.7% |
| 2013–14 | 30,895 | 29,638 | 25,206 | 97.7% |
| 2014–15 | 32,707 | 31,732 | 28,708 | 111.3% |
| 2015–16 | 24,650 | 25,513 | 32,556 | 126.2% |
| 2016–17 | 20,368 | 19,512 | 23,878 | 92.6% |
| 2017–18 | 18,377 | 18,394 | 18,689 | 72.4% |
| 2018–19 | 15,432 | 15,729 | 16,819 | 65.2% |
| 2019–20 | 14,344 | 13,601 | 14,649 | 56.8% |
| 2020–21 | 26,947 | 23,341 | 13,654 | 52.9% |
| 2021–22 | 19,166 | 21,090 | 13,696 | 53.1% |
| 2022–23 | 13,980 | 15,036 | 15,149 | 58.7% |
| 2023–24 | 17,465 | 15,102 | 18,067 | 70.0% |
| 2024–25 | 22,950 | 22,533 | 22,516 | 87.3% |
Source · Methodology: Financial-year totals. Approvals from ABS Building Approvals (cat. 8731.0) Table 05, original series. Commencements and completions from ABS Building Activity (cat. 8752.0) Tables 35 and 39, original series. Accord pace benchmark is 25,800 homes per year (129,000 ÷ 5). Shaded rows = local supply peaks (2014–15 mining boom; 2021 HomeBuilder stimulus).
References
- NHSAC Quarterly Report – August 2026 · nhsac.gov.au ↑ b c d e
- ABS: Regional Population, 2024–25 · Australian Bureau of Statistics ↑ b c
- ABS Building Approvals, Australia (latest release, Cat. 8731.0) · Australian Bureau of Statistics
- ABS, Building Activity, Australia (latest release, Cat. 8752.0) · Australian Bureau of Statistics
- ABS, National, state and territory population (latest release) · Australian Bureau of Statistics
- NHSAC State of the Housing System, 2025 · nhsac.gov.au
- Western Australian Government, 2026–27 State Budget · wa.gov.au
- WA Department of Planning, Lands and Heritage, State Lot Activity, June Quarter 2026 · wa.gov.au
- NHSAC State of the Housing System 2026 · nhsac.gov.au
