

Published 26 June 2026 · Updated 18 Sept 2026
Public housing had an overcrowding rate of 4.3% at June 2025, while state-owned and managed Indigenous housing (SOMIH) had a rate of 22.9% and community housing had a rate of 3.5%. Indigenous community housing had an overcrowding rate of 16.2% at June 2025, the most recent year reported for that programme.
SOMIH had the highest overcrowding rate among the main social housing programmes, at more than five times the public housing rate. Detailed AIHW data for June 2024 also showed that 47.0% of SOMIH households in very remote areas were overcrowded.
The latest detailed AIHW suitability counts show about 22,600 social housing dwellings were overcrowded at June 2024, while about 60,900 were underutilised. Underutilised dwellings are homes with at least two more bedrooms than the household requires.
Overcrowded and underutilised dwellings sit within the same system, but they cannot be treated as a simple one-for-one match. The homes are not always in the same locations, they are often different sizes, and the households in each group may have different accessibility, community and family needs.
 Public housing statistics in Australia: stock, waitlists and long-term trendsThe national public housing waitlist reached 189,536 households at 30 June 2025, up 12.5% in a single year and the highest level in the comparable series since 2014. At the same time, Australia’s publ…
 Social housing waitlist statistics in Australia: how many households are waiting?Australia's public housing waitlist reached 189,536 households at 30 June 2025, the highest level in the comparable series since 2014 and up 20,984 households, or 12.4%, from June 2024. Of those, 77,4…
Section 01 · Definition
What is overcrowding in social housing?
Overcrowding in social housing means a household is living in a home that does not have enough bedrooms for its assessed needs. Under the Canadian National Occupancy Standard (CNOS), a dwelling is classified as overcrowded when the household needs at least one more bedroom.
The latest detailed AIHW suitability data shows that about 22,600 social housing dwellings were overcrowded at June 2024, equal to 5.6% of social housing households with known suitability status. Newer programme-level data for June 2025 shows overcrowding rates of 4.3% for public housing, 22.9% for SOMIH and 3.5% for community housing.
Each household with a known suitability status is classified as one of three categories:
Overcrowded
The home has fewer bedrooms than the household requires.
Suitable or adequate
The home has the right number of bedrooms, or one spare bedroom.
Underutilised
The home has at least two more bedrooms than the household requires.
These classifications apply only to households with a known suitability status. A small proportion of households each year have an “unknown or not stated” status and are excluded from percentage calculations.
Why overcrowding matters
- Overcrowding affects privacy, sleep quality, and children's ability to study.
- Crowded conditions make it easier for respiratory and other infectious diseases to spread.
- In remote communities, overcrowding places additional pressure on plumbing, bathrooms, kitchens, and other infrastructure that may already be under strain.
Section 02 · Measurement
How social housing overcrowding is measured
Social housing overcrowding is measured using the Canadian National Occupancy Standard (CNOS). AIHW reported that 5.6% of social housing households were overcrowded at June 2024, while newer Productivity Commission data shows programme-level overcrowding rates at June 2025.
| Household member type | Bedrooms allocated under CNOS |
|---|---|
| Married or de facto couple | One shared bedroom |
| Single adult (18+) or single adult child | One bedroom each |
| Two children under 5 (any sex combination) | May share one bedroom |
| Two children aged 5 to 17 of the same sex | May share one bedroom |
| Two children 5–17 of different sexes, if one is under 10 | May share one bedroom |
| Any other child aged 5–17 | One bedroom each |
Source · AIHW, Housing assistance in Australia, suitability methodology notes.
Because the same standard is used across Australian social housing data, comparisons between programmes and jurisdictions are more consistent.
Section 03 · By programme
Overcrowding by housing programme
State-owned and managed Indigenous housing (SOMIH) has an overcrowding rate more than five times higher than public housing: 24.2% nationally at June 2024, compared with 4.7% for public housing and 3.7% for community housing.
Detailed counts and rates at 30 June 2024. Updated programme-level rates at 30 June 2025 are shown in the lede.
AIHW, Table SUITABILITY.1 (2025 release). Based on 12,154 of 17,579 ICH households with known status; incomplete — compare cautiously
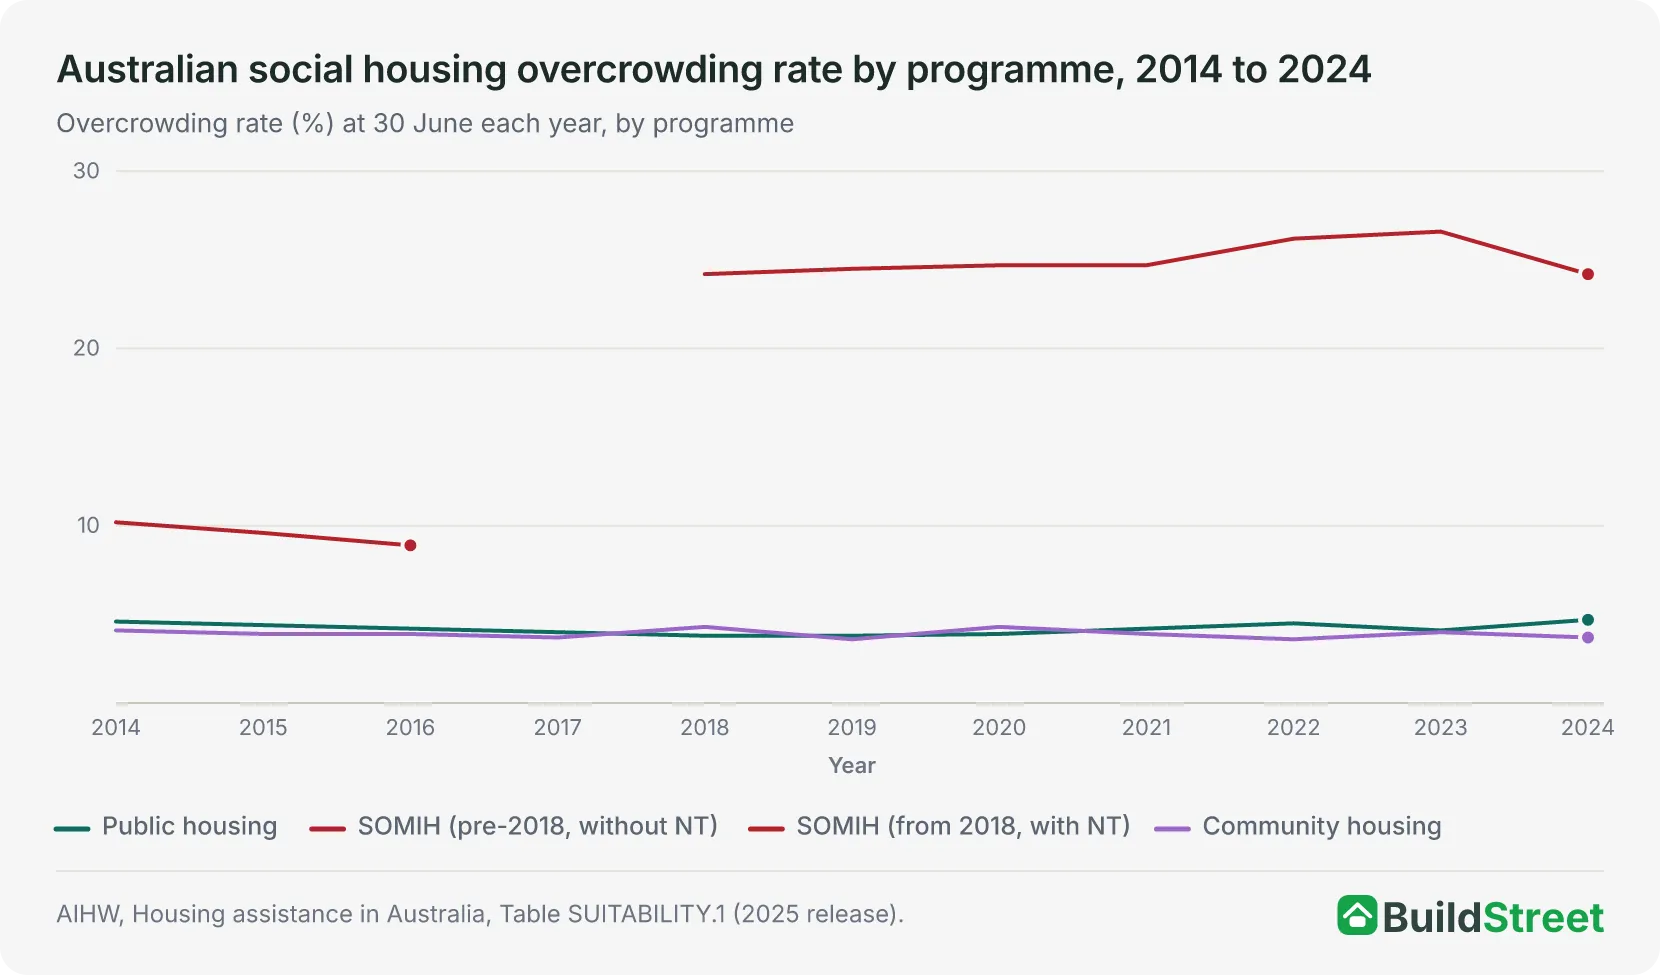
Public housing overcrowding followed a U-shaped pattern over the decade to 2024. It fell from 4.6% (14,509 households) in 2014 to 3.8% (10,918 households) in 2018 and 2019, then rose to 4.7% (13,242 households) by 2024. The 2024 figure was the highest in the comparable series since 2015, despite there being around 18,000 fewer public housing households overall than in 2015.
Community housing remained relatively stable between 3.6% and 4.3% over the same period. Its lower overcrowding rate may reflect differences in household profile, dwelling type, and location compared with public housing.
Section 04 · State comparison
Public housing overcrowding by state and territory
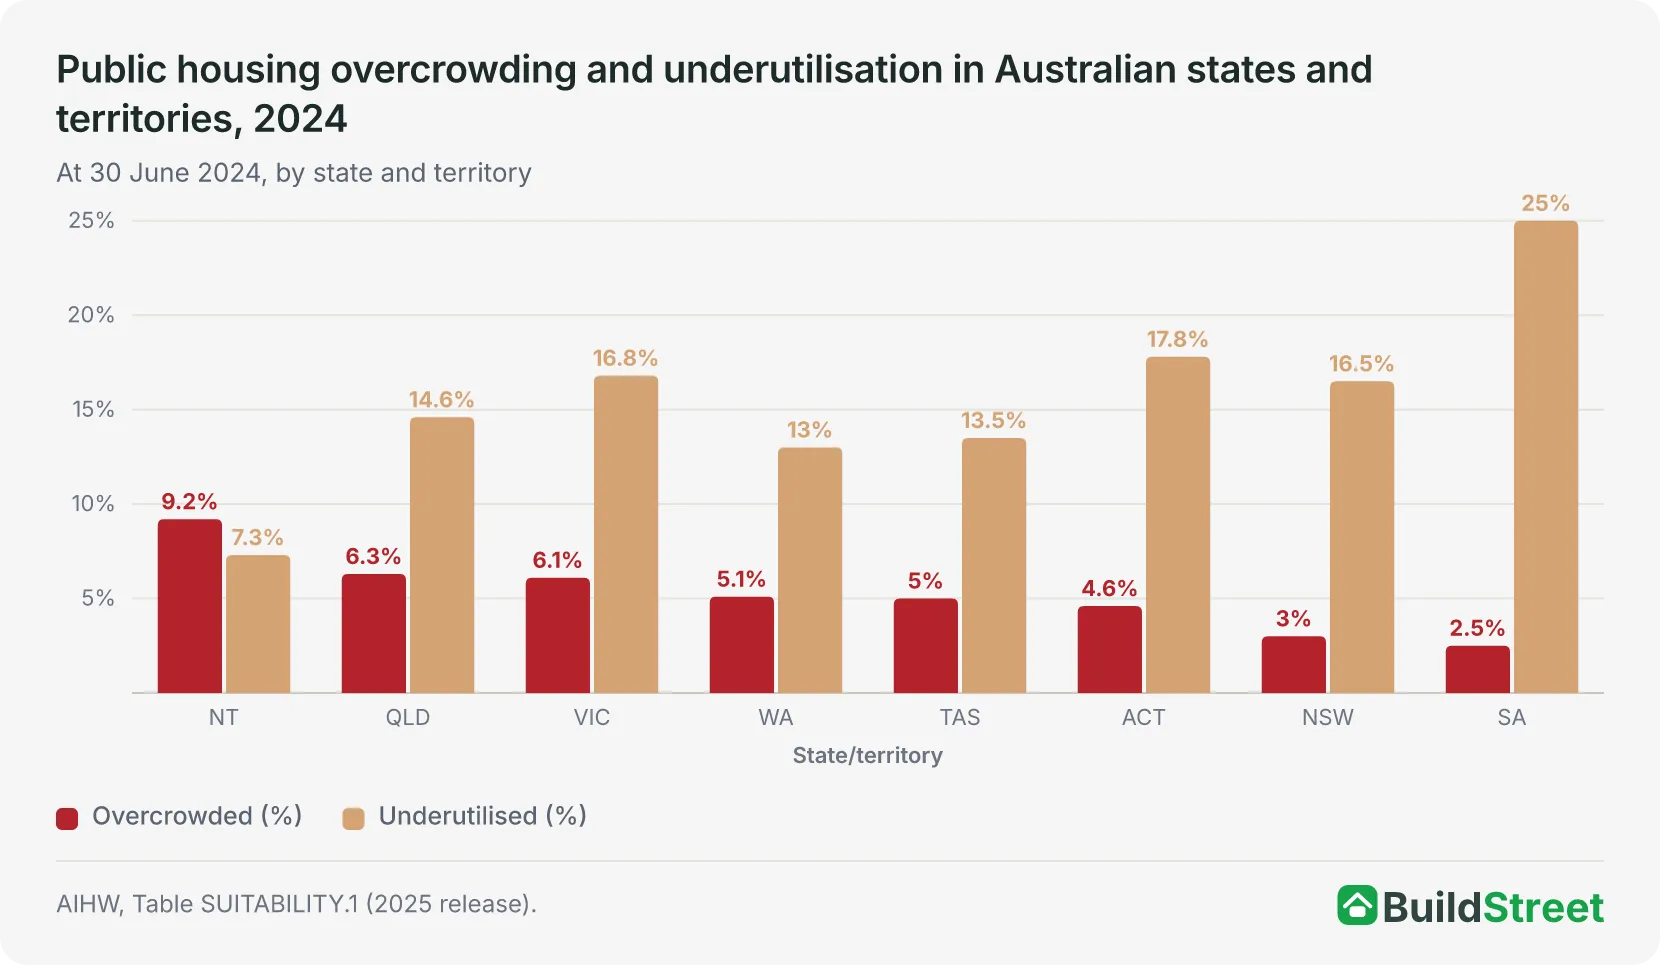
The Northern Territory has the highest public housing overcrowding rate at 9.2%, while South Australia has the lowest at 2.5%. Queensland and Victoria follow at 6.3% and 6.1% respectively. The national rate is 4.7%.
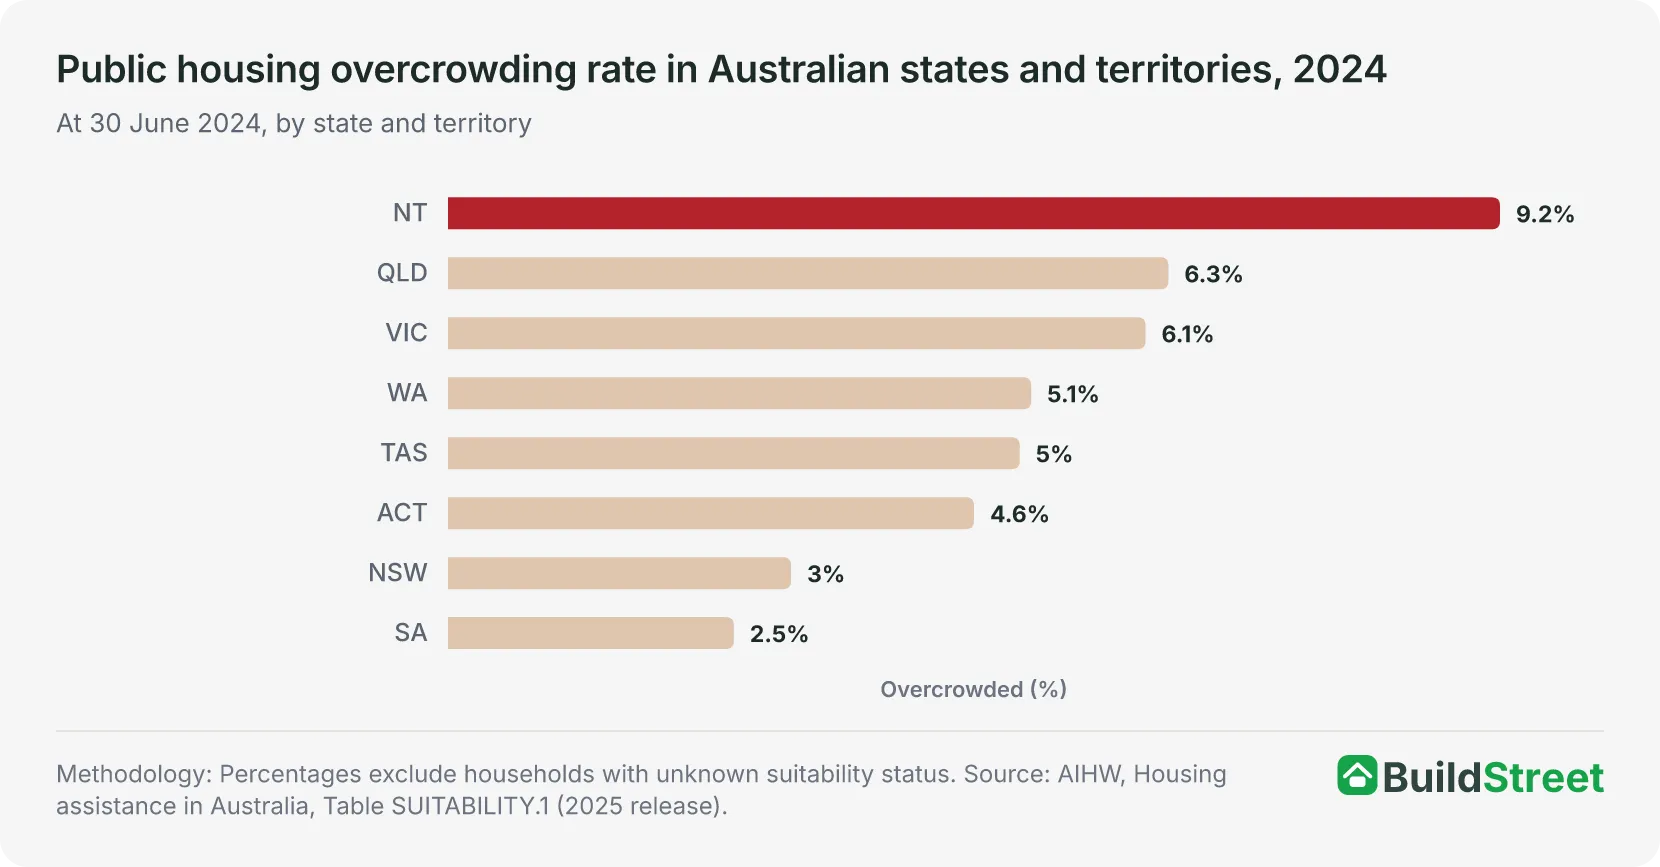
| State/territory | Overcrowded households | Overcrowded (%) | Underutilised (%) | Suitable (%) |
|---|---|---|---|---|
| Northern Territory | 406 | 9.2% | 7.3% | 83.4% |
| Queensland | 3,312 | 6.3% | 14.6% | 79.1% |
| Victoria | 3,724 | 6.1% | 16.8% | 77.1% |
| Western Australia | 1,661 | 5.1% | 13.0% | 81.8% |
| Tasmania | 239 | 5.0% | 13.5% | 81.4% |
| ACT | 445 | 4.6% | 17.8% | 77.7% |
| New South Wales | 2,711 | 3.0% | 16.5% | 80.5% |
| South Australia | 744 | 2.5% | 25.0% | 72.5% |
| Australia | 13,242 | 4.7% | 16.6% | 78.8% |
Source · AIHW, Table SUITABILITY.1 (2025 release).
Section 05 · SOMIH
Indigenous housing overcrowding by state and territory
State-owned and managed Indigenous housing (SOMIH) overcrowding is highest in the Northern Territory. The NT's 51.3% overcrowding rate is more than twice the national SOMIH average of 24.2% and more than ten times the public housing national average of 4.7%. The NT also recorded 2,554 of Australia's 3,551 overcrowded SOMIH households at June 2024.
Overcrowding rates range from 5.8% in Tasmania to 51.3% in the NT across the five SOMIH jurisdictions: New South Wales, Queensland, South Australia, Tasmania and the Northern Territory.
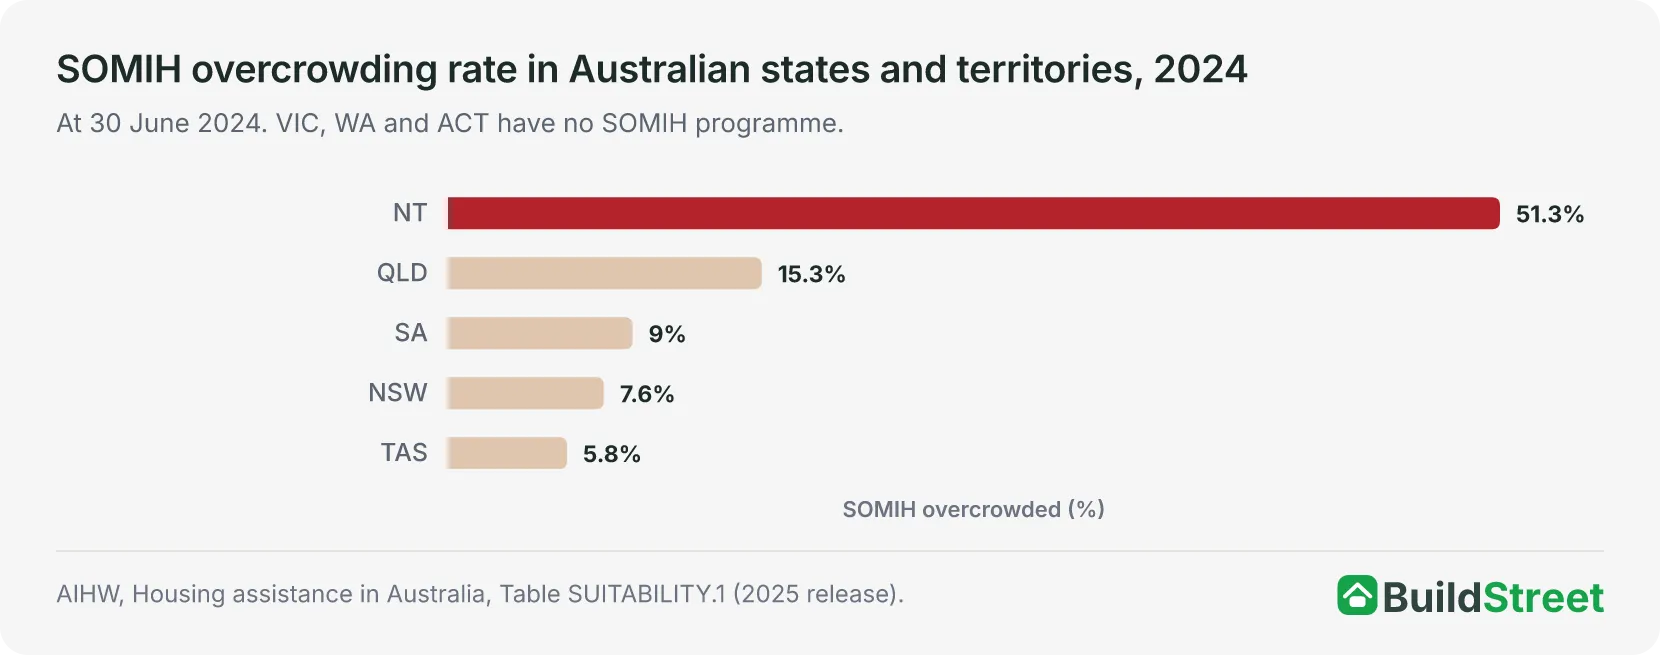
| State/territory | Overcrowded households | Overcrowded (%) | Underutilised (%) | Suitable (%) |
|---|---|---|---|---|
| Northern Territory | 2,554 | 51.3% | n.p. | n.p. |
| Queensland | 489 | 15.3% | 19.1% | 65.6% |
| South Australia | 114 | 9.0% | 31.9% | 59.1% |
| New South Wales | 385 | 7.6% | 27.0% | 65.4% |
| Tasmania | 9 | 5.8% | 23.2% | 71.0% |
| Australia | 3,551 | 24.2% | 24.9% | 50.8% |
Source · AIHW, Table SUITABILITY.1 (2025 release).
Indigenous housing overcrowding by remoteness area
SOMIH overcrowding climbs with remoteness, from 7.7% in major cities to 47.0% in very remote areas. Public housing shows the same gradient but at a much lower scale: 4.3% in major cities rising to 9.8% in very remote areas. In very remote areas, the SOMIH rate is nearly five times the public housing rate.
Remote housing stock may also be harder to modify or replace because of location, building age and construction costs.
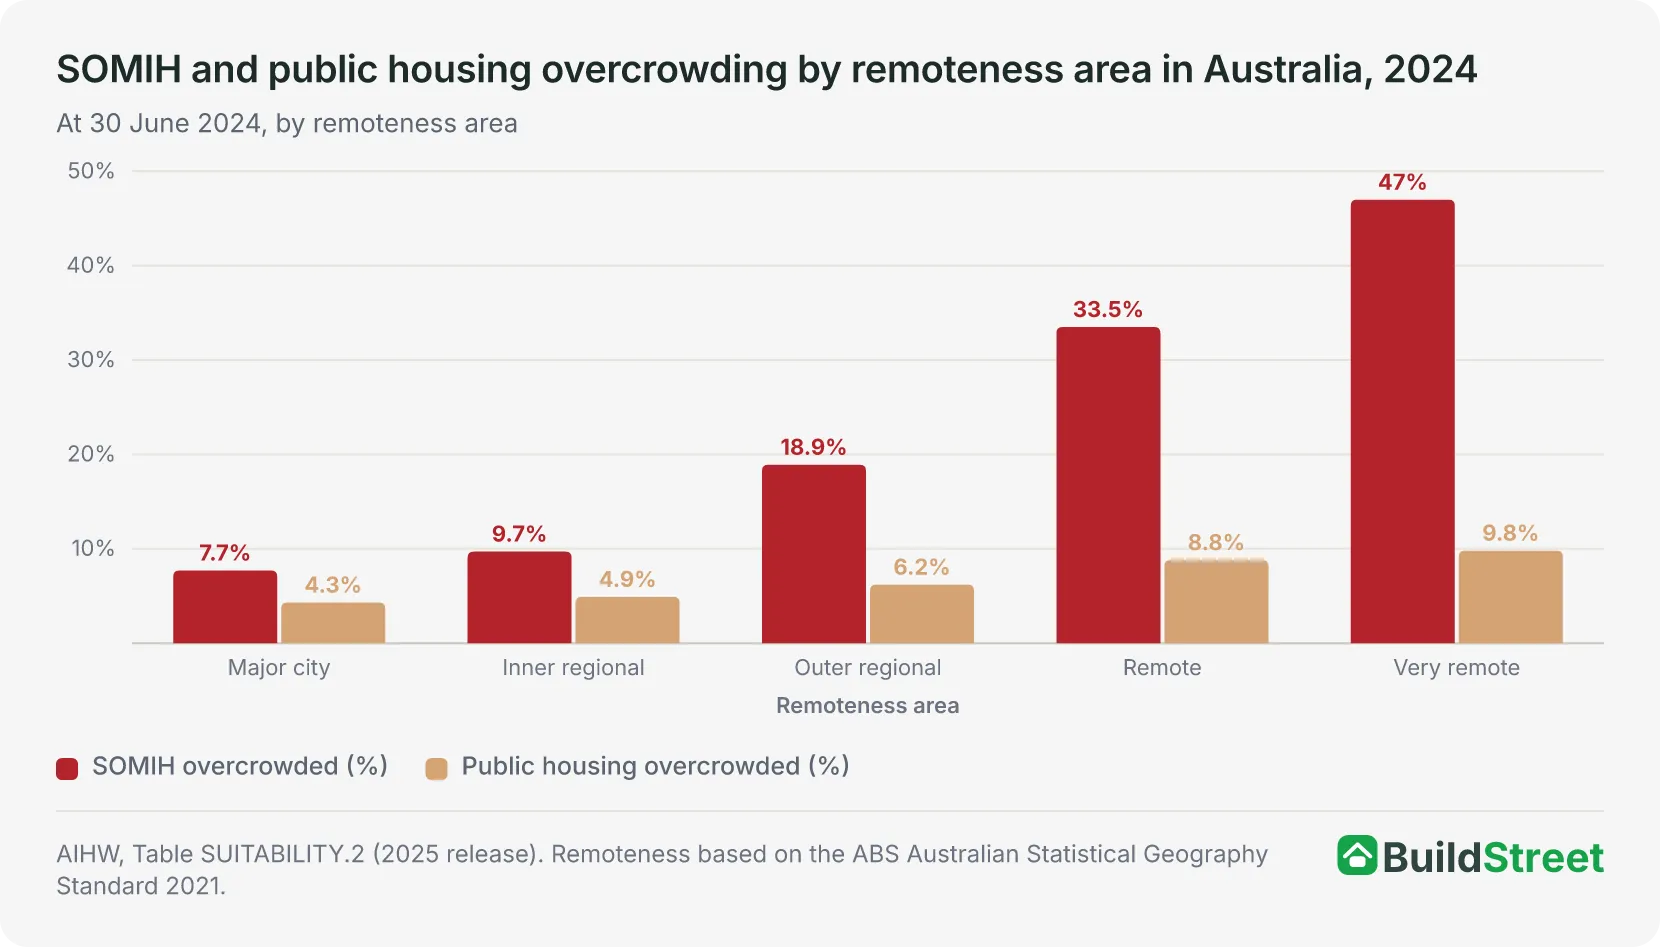
| Remoteness area | SOMIH overcrowded (no.) | SOMIH total | SOMIH rate (%) | PH rate (%) |
|---|---|---|---|---|
| Major city | 357 | 4,605 | 7.7% | 4.3% |
| Inner regional | 160 | 1,651 | 9.7% | 4.9% |
| Outer regional | 457 | 2,410 | 18.9% | 6.2% |
| Remote | 597 | 1,780 | 33.5% | 8.8% |
| Very remote | 1,981 | 4,213 | 47.0% | 9.8% |
| National total | 3,551 | 14,659 | 24.2% | 4.7% |
Source · AIHW, Table SUITABILITY.2 (2025 release). SOMIH and PH rates are calculated using known-status households as denominator.
Indigenous housing overcrowding and underutilisation by remoteness area
In very remote areas, 47.0% of SOMIH households are overcrowded, while 18.8% are in dwellings with two or more bedrooms more than the household requires. This shows that overcrowding and underutilisation can appear in the same broad remoteness category, although the two measures use different denominators and cannot be directly added together.
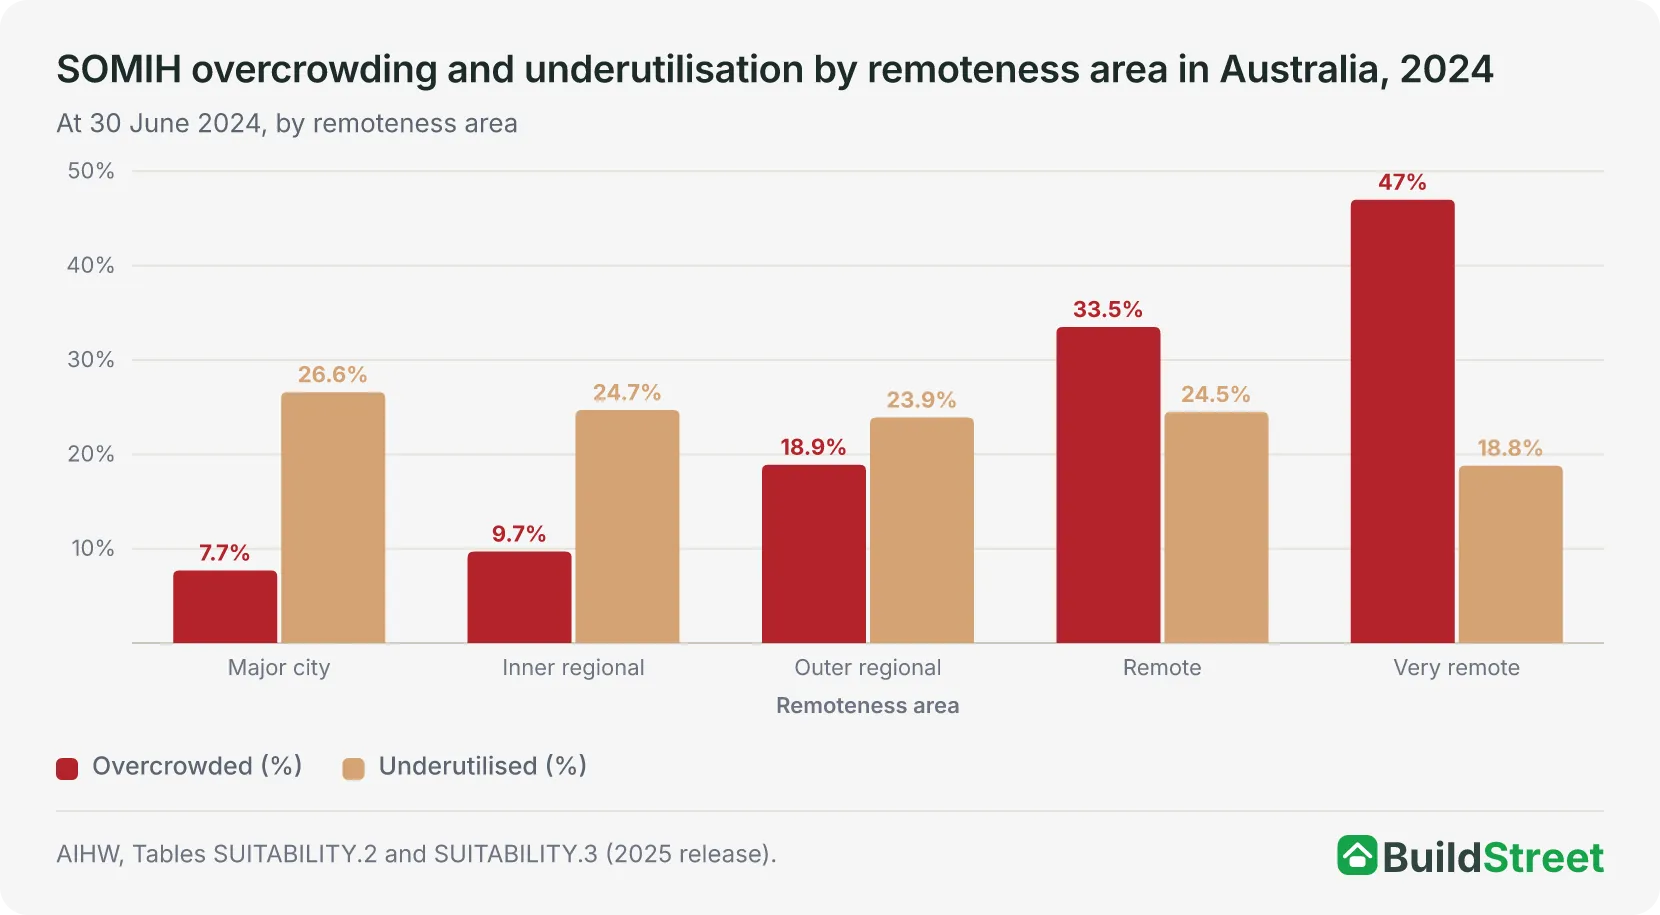
Section 06 · Who is affected
Who lives in overcrowded social housing?
Low-income households make up most overcrowded public housing households. At June 2024, 83.9% of overcrowded public housing households were classified as low income, rising to 97.7% for SOMIH. The main tenant in overcrowded public housing was most commonly aged 35 to 44. Group and mixed composition households accounted for 55.0% of overcrowded public housing.
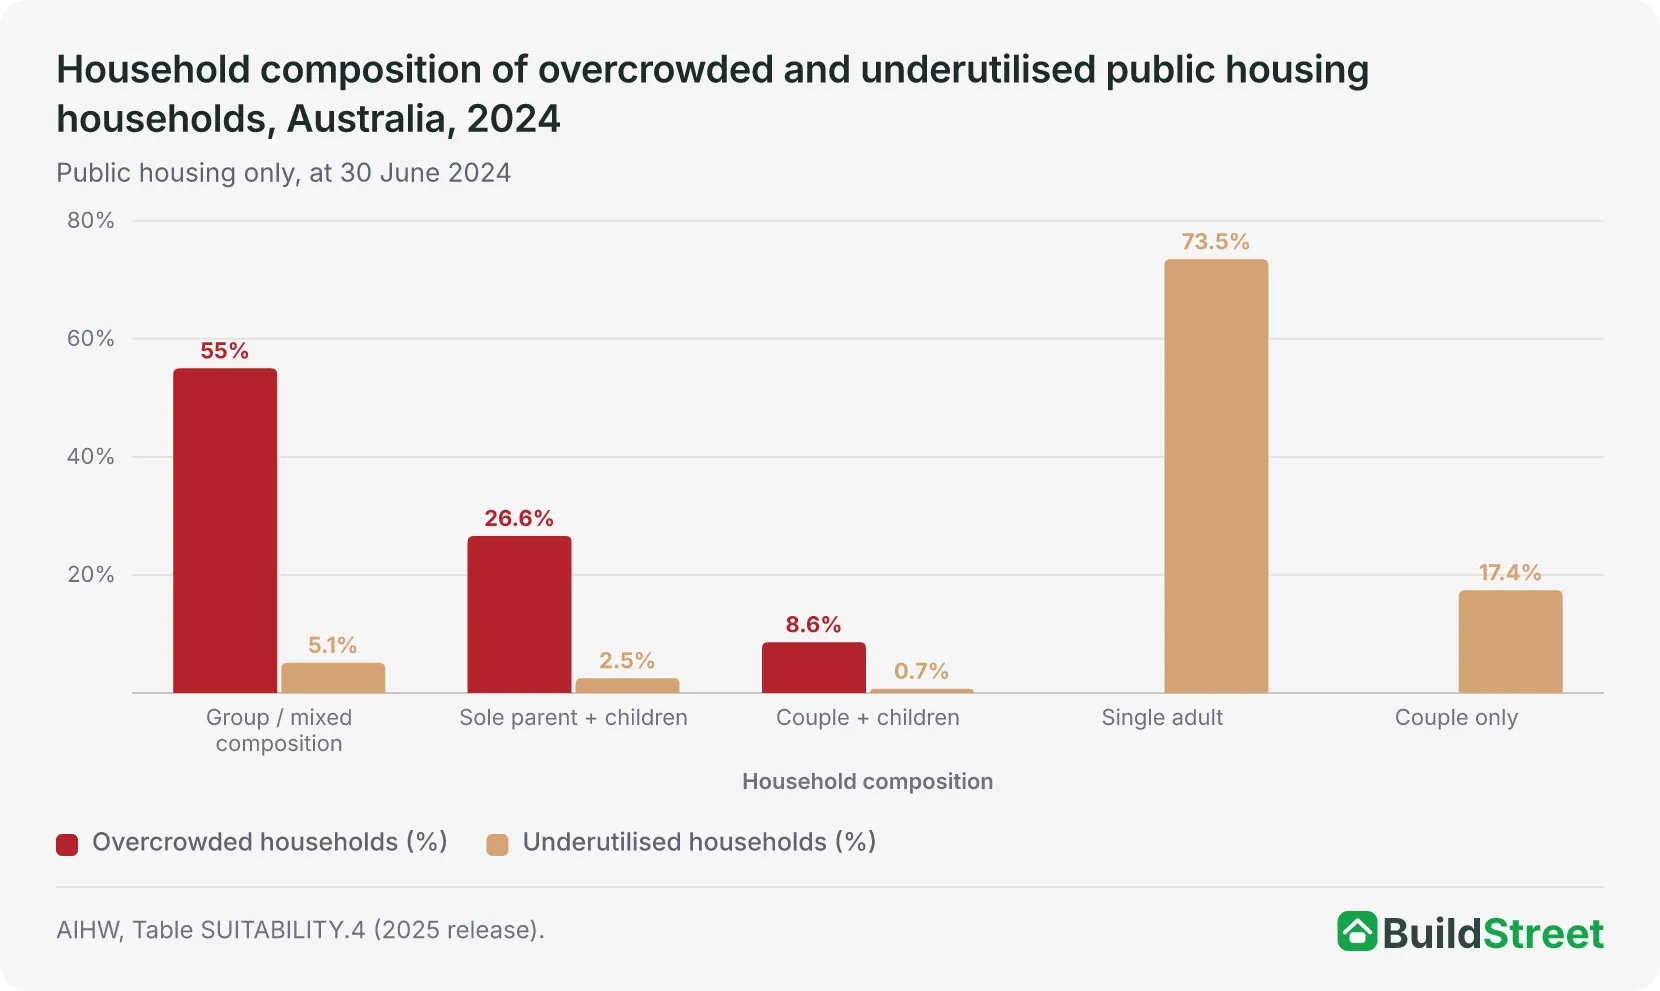
Overcrowded public housing households are predominantly multi-person and family groups:
- 55.0% are group and mixed composition (multi-generational households, extended family groups, and unrelated people sharing)
- 26.6% are sole-parent families with dependent children
- 8.6% are couples with dependent children
Among underutilised public housing households, single adults account for 73.5%, followed by couples without children at 17.4%. These households are more likely to have older main tenants than overcrowded households, which affects how underutilisation figures should be interpreted.
AIHW, Table SUITABILITY.4 (2025 release). All percentages are national figures for the stated programme.
SOMIH overcrowded households show a more pronounced group-household pattern. Group and mixed composition households account for 77.8% of overcrowded SOMIH households. This aligns with the broader data limitations noted for Indigenous housing, where household structures may differ from standard occupancy assumptions. JobSeeker is the main income source for 18.8% of overcrowded SOMIH households, compared with 6.3% in public housing.
Among underutilised public housing households, 40.6% include at least one person with disability and 29.1% of main tenants are aged 55 to 64. This means underutilisation should be read as a statistical measure of bedroom mismatch, not as a complete measure of whether a dwelling is suitable for the household.
Section 07 · The matching argument
Why underutilised public housing does not automatically solve overcrowding
Public housing had 13,242 overcrowded households and 47,134 underutilised households at June 2024, a ratio of 3.6 to 1. However, these figures do not mean overcrowding can be resolved through simple reallocation. Location, dwelling size, accessibility needs and the profile of existing tenants all affect whether a household can be matched to a different home.
Overcrowded and underutilised Australian public housing households at 30 June 2024
Overcrowded (too small)
- 13,242
Public housing households in dwellings with fewer bedrooms than their assessed requirement.
Underutilised (too large)
- 47,134
Public housing households in dwellings with two or more bedrooms above their assessed requirement.
Why public housing bedroom mix matters
Only 7.2% of all public housing dwellings have four or more bedrooms, yet more than half of overcrowded public housing households fall into household types that typically require that size.
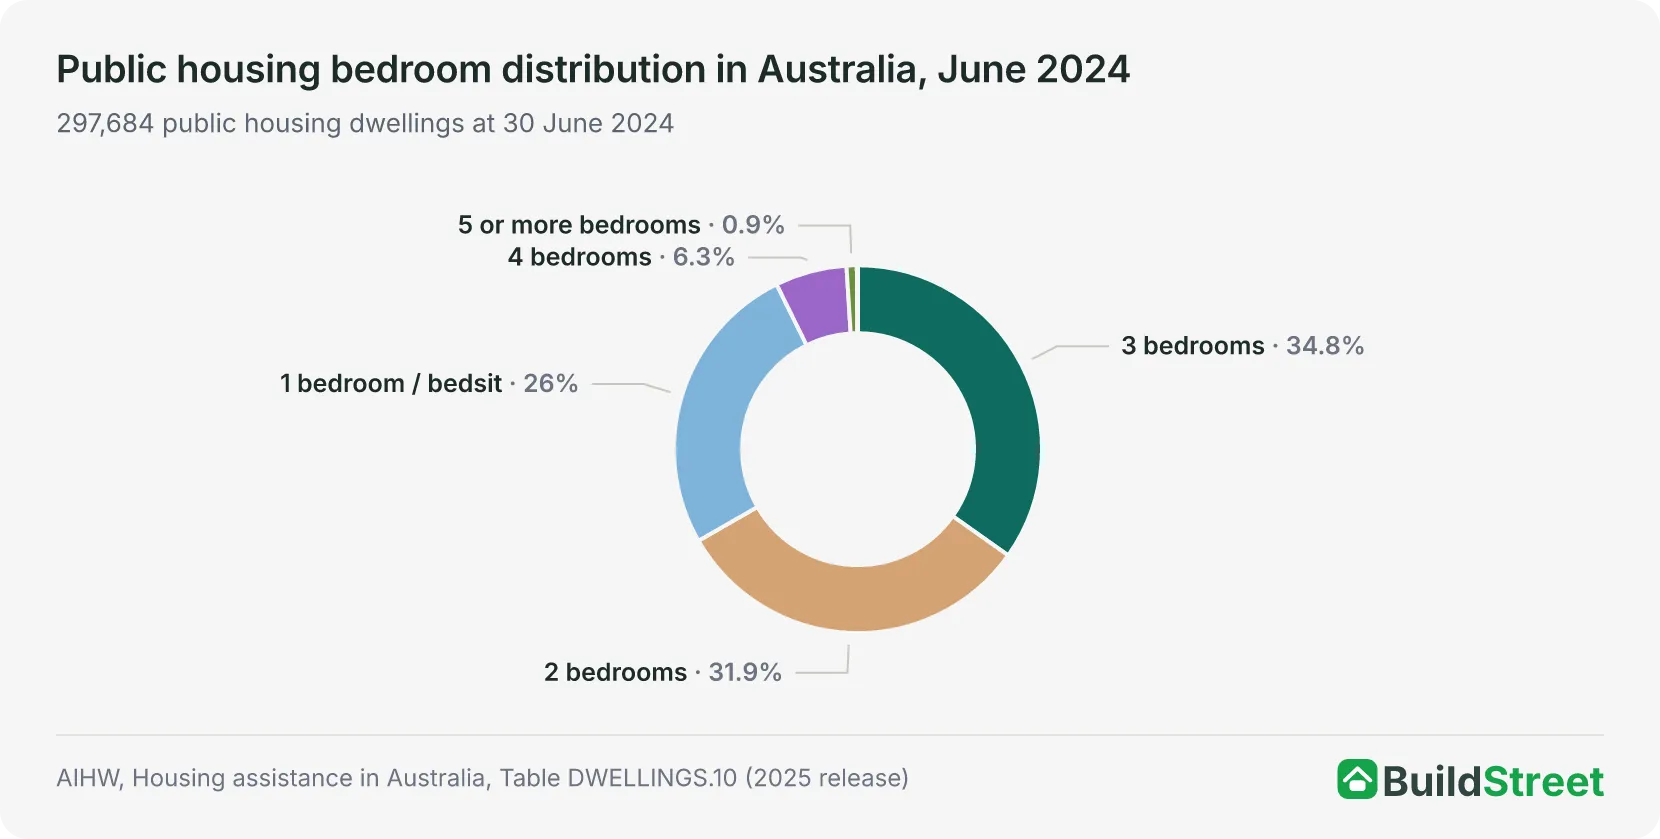
Three-bedroom dwellings are the largest category at 34.8% of the stock (103,735 dwellings). Four-bedroom dwellings make up 6.3% (18,860) and five-or-more-bedroom dwellings account for 0.9% (2,613). Combined, homes with four or more bedrooms represent only 7.2% of all public housing, around 21,500 dwellings nationally.
Among overcrowded public housing households, 55.0% were in the “group and mixed composition” category. Sole-parent families with dependent children accounted for 26.6%, while couples with dependent children accounted for 8.6%. These household types can increase demand for larger dwellings, depending on household size and composition.
Overall public housing occupancy was 96.7% at June 2025, indicating that little public housing stock was vacant. High occupancy also means that a dwelling can be occupied while still being unsuitable for the household living in it.
Three barriers to matching overcrowded and underutilised households
Geographical mismatch. Overcrowding and underutilisation are not evenly distributed across states and territories. South Australia had the highest public housing underutilisation rate nationally at 25.0%, but one of the lowest overcrowding rates at 2.5%. The Northern Territory had the highest overcrowding rate at 9.2% and the lowest underutilisation rate at 7.3%. This means spare-bedroom capacity in one jurisdiction may not align with overcrowding pressure in another.
The profile of underutilised households. Of the 47,134 underutilised public housing households nationally, 44.0% had a main tenant aged 65 or over, and a further 29.1% had a main tenant aged 55 to 64. More than 40% included at least one person with disability. These figures show that underutilisation often occurs in households with older main tenants or disability needs, which may affect whether a smaller dwelling is suitable.
Availability of smaller dwellings. Relocation would also require smaller properties to be available in the same area. In many communities, the stock skews heavily toward larger family homes built decades ago. The one- and two-bedroom homes required by older single adults may not exist in sufficient numbers to enable meaningful matching without new construction. Around 57.9% of all public housing dwellings are one- or two-bedroom, but the available smaller homes may already be substantially occupied.
Section 08 · Data caveats
Data caveats for social housing overcrowding statistics
Several caveats apply to the suitability data. The most important are incomplete Indigenous community housing data, the SOMIH structural break from 2017–18, and stock transfers or reporting changes that affect year-on-year comparisons.
Unknown suitability is excluded from all rates.
Overcrowding and underutilisation percentages are calculated using only households with a known suitability status as the base. Households where bedroom requirements were not recorded are excluded. Rates therefore reflect only the assessed population.
ICH suitability data is substantially incomplete.
For Indigenous community housing, underutilised and suitable/adequate counts are unavailable in any state or territory. The 16% overcrowding rate for ICH is based on 12,154 households with assessed status out of 17,579 total, with NT data absent. Because of these gaps, ICH should be compared cautiously with the other social housing programmes.
The SOMIH series has a structural break from 2017–18.
Northern Territory SOMIH data was first included in national reporting from 2017–18. The apparent jump in the national SOMIH overcrowding rate from approximately 9% to 24% reflects this change in data coverage, not a sudden increase in overcrowding. Pre-2018 and post-2018 SOMIH rates are not directly comparable.
State and year-on-year comparisons may be affected by transfers and reporting changes.
Large stock transfers between programmes, changes in collection systems, and reclassifications can affect single-year comparisons. The 2023–24 NSW public housing to SOMIH transfer, and Victoria's 2024 public housing rate increase from 3.8% to 6.1%, are both cases where data quality caveats apply before drawing trend conclusions.
SOMIH underutilisation and overcrowding rates by remoteness use different base populations.
Overcrowding rates by remoteness (Table SUITABILITY.2) include NT in the denominator. Underutilisation rates by remoteness (Table SUITABILITY.3) exclude NT, because NT underutilised and suitable counts are not published. The two series measure slightly different populations and cannot be directly added together.
Underutilisation does not necessarily mean a home is unsuitable for the household.
A dwelling classified as underutilised under CNOS may still be entirely appropriate for the household living there. Many underutilised households include people with disability, older adults with mobility needs, or households with legitimate reasons for needing extra space. The classification identifies a statistical mismatch, not a failing of the individual household.
Section 09 · Frequently asked questions
Frequently asked questions about social housing overcrowding
The questions below explain how social housing overcrowding is measured, which programmes and places have the highest rates, and why underutilised dwellings cannot be treated as a simple solution to overcrowding.
Why is SOMIH overcrowding so much higher in remote areas?
SOMIH overcrowding rises with remoteness, from 7.7% in major cities to 47.0% in very remote areas. Remote Indigenous housing data should be read alongside the limitations of CNOS, which may not fully reflect extended-family living arrangements or household structures in some communities. Some remote housing stock may also be harder to modify or replace because of location, building age and construction costs.
Why can't underutilised dwellings solve overcrowding?
Overcrowded and underutilised dwellings exist within the same housing system, but they do not necessarily match by location, dwelling size, accessibility or household need. At June 2024, public housing had 13,242 overcrowded households and 47,134 underutilised households. Those figures show a statistical mismatch, not a pool of homes that can be immediately reallocated. The main barriers are location, household profile and stock mix. Underutilisation may be higher in one jurisdiction while overcrowding is higher in another. Some underutilised households also include older main tenants or people with disability, and a smaller dwelling may not meet the household's needs.
