

Published 24 June 2026
Australia had 450,607 social housing dwellings at 30 June 2025, spanning all four programme types: public housing, community housing, state-owned and managed Indigenous housing (SOMIH) and Indigenous community housing (ICH).
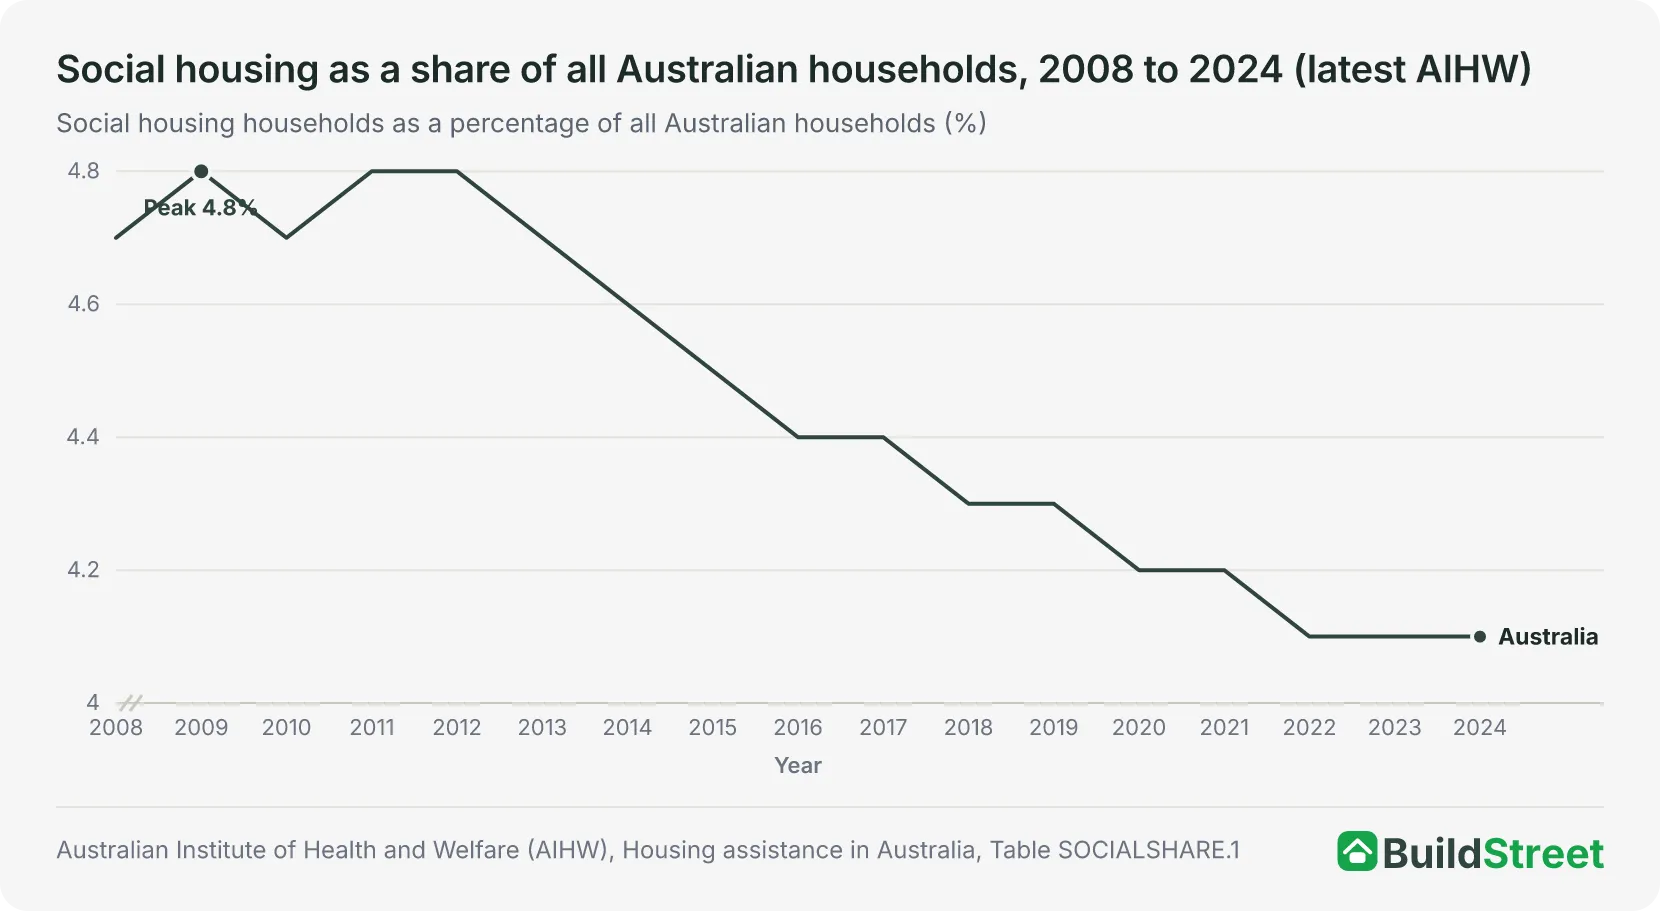
The social housing share was 4.1% of all Australian households in 2024, the latest year for which national data is available, down from 4.7% in 2008. By 30 June 2025, the public housing waitlist had increased to 189,536 households.
Governments have responded with new supply programmes, including the $10 billion Housing Australia Future Fund (HAFF) and National Housing Accord Facility (NHAF), which target 40,000 social and affordable homes over five years. Rounds 1 and 2 had contracted 18,650 homes, and Round 3 was opened to support the remaining 21,350 homes.
 Emerging home types in Australia: modular, prefab, duplexes and the changing dwelling mixDetached houses still make up most of Australia's homes, but their share has slipped over two decades. In 2021, 72.3% of occupied private dwellings were separate houses, down from 75.3% in 2001.
 Build-to-rent statistics in Australia 2026Australia's build-to-rent sector is expanding quickly, with market-source estimates counting 12,000 operational apartments as at October 2025 and 4,660 units delivered in 2024 alone. The national pipe…
Section 01 · Definitions
What is social housing in Australia?
Social housing is subsidised rental accommodation for people on very low incomes or people with high housing need. Rent is usually set as a proportion of household income rather than full market rent. Four programme types make up the system, and together they accounted for 4.1% of all Australian households in 2024, the most recent year for which AIHW social-share data is available.
| Programme | Who manages it | Who it is for |
|---|---|---|
| Public housing | State and territory housing authorities | Very low income households; people with high housing need |
| Community housing | Not-for-profit community housing providers (CHPs) | Low to moderate income households; specialist needs groups |
| SOMIH | State and territory housing authorities | Aboriginal and Torres Strait Islander households |
| Indigenous community housing | Indigenous community housing organisations | Aboriginal and Torres Strait Islander households |
What is the difference between social housing and affordable housing?
Social housing rent
- 25–30%
Social housing rent is commonly set at around 25% to 30% of household income, depending on the programme and jurisdiction. It is generally for people with the highest housing need, including people experiencing homelessness, family or domestic violence, disability, or very low income. Eligibility is based on income, household circumstances and housing need.
Affordable housing rent
- Around 80%
Affordable housing rent is often set below market rent, commonly around 80% of local market rates, depending on the programme. It is generally aimed at low- to moderate-income households that may not qualify for social housing but cannot afford suitable market rental housing. Programmes such as HAFF and NHAF fund both social and affordable homes.
Section 02 · National stock
How much social housing does Australia have?
Australia had 450,607 social housing dwellings at 30 June 2025, across public housing, community housing, SOMIH and Indigenous community housing.
The largest programme was public housing, with 296,541 dwellings. Community housing accounted for 118,425 dwellings, SOMIH for 17,163 and Indigenous community housing for 18,478.
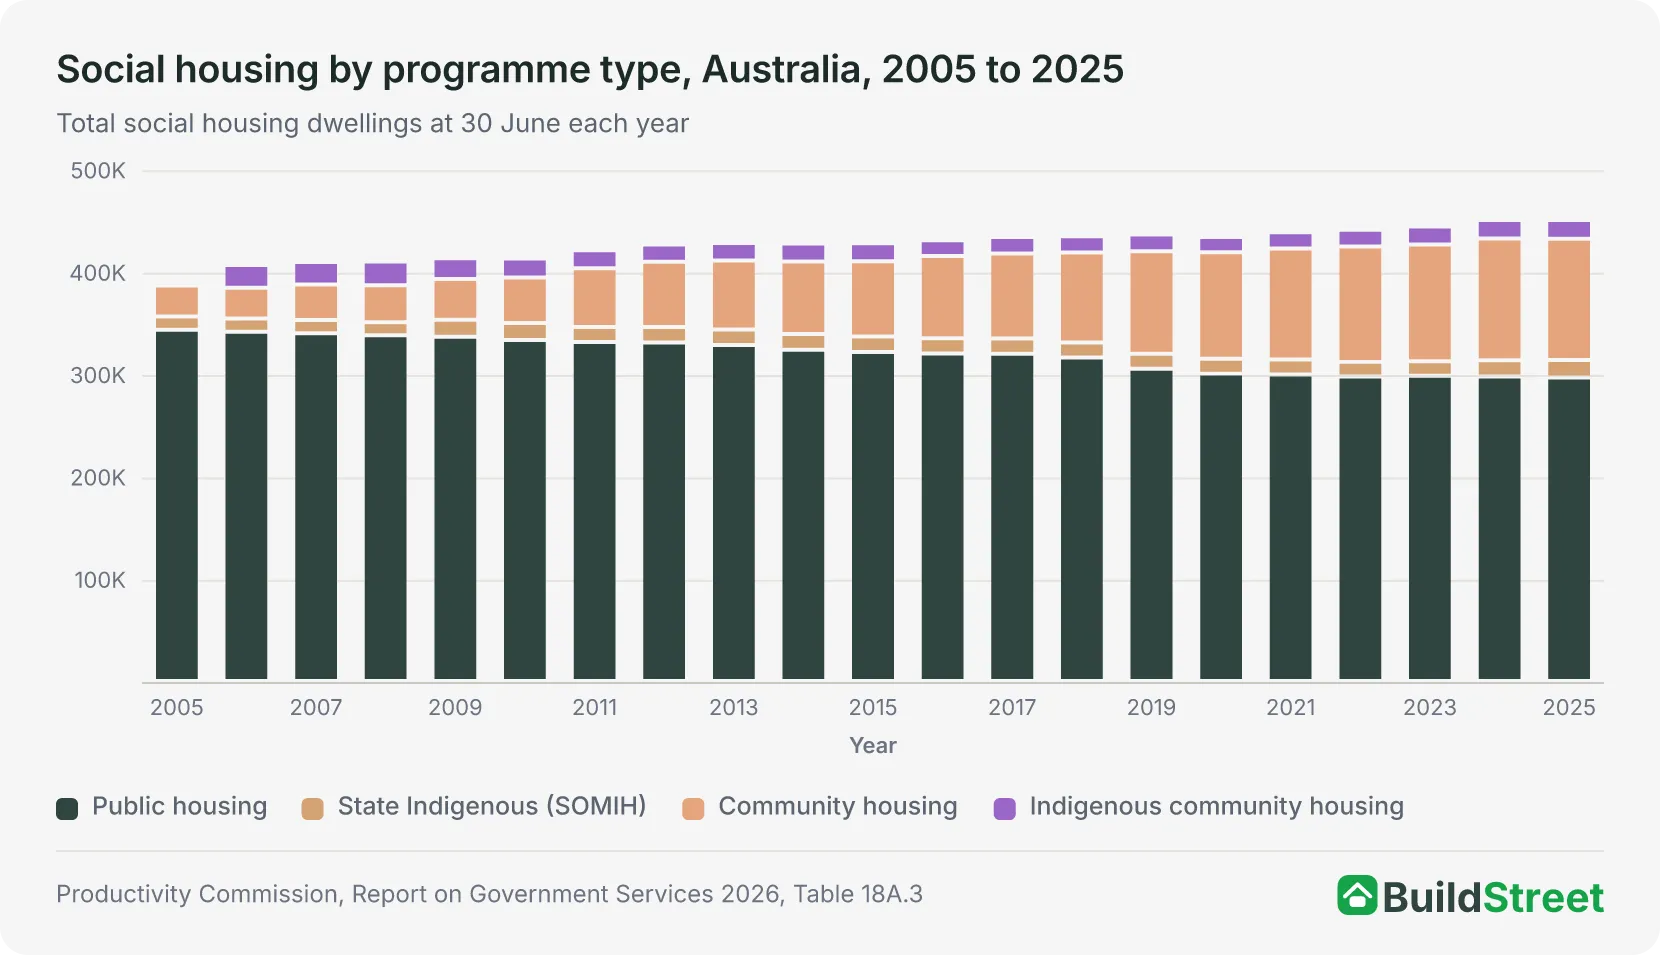
Between 2008 and 2024, social housing stock increased by about 40,000 dwellings. Most of that growth came from community housing, while public housing declined from its 2005 peak of more than 343,000 dwellings.
Section 03 · Annual additions
How many social and affordable homes are built each year in Australia?
Net social housing stock grew by roughly 2,800 dwellings per year between 2019 and 2024. Australia does not publish a single annual count of all social and affordable housing completions across programmes, so net stock change is the best available national proxy.
The HAFF and NHAF programmes are designed to increase delivery from this historical pace. If the full 40,000-home five-year target is met, that would work out to roughly 8,000 additions per year. Rounds 1 and 2 had contracted 18,650 homes toward that target.
Section 04 · Long-term trend
Australia's social housing share has fallen since 2008
Social housing has not kept pace with growth in Australian households. Although the number of social housing dwellings increased between 2008 and 2024, total households grew much faster. As a result, social housing made up a smaller share of all households in 2024 than it did in 2008. Between 2008 and 2024, Australia added more than 2.3 million households while social housing dwellings grew by about 40,000. The national social housing share fell from 4.7% to 4.1%.
The fall was widespread, affecting most states and territories:
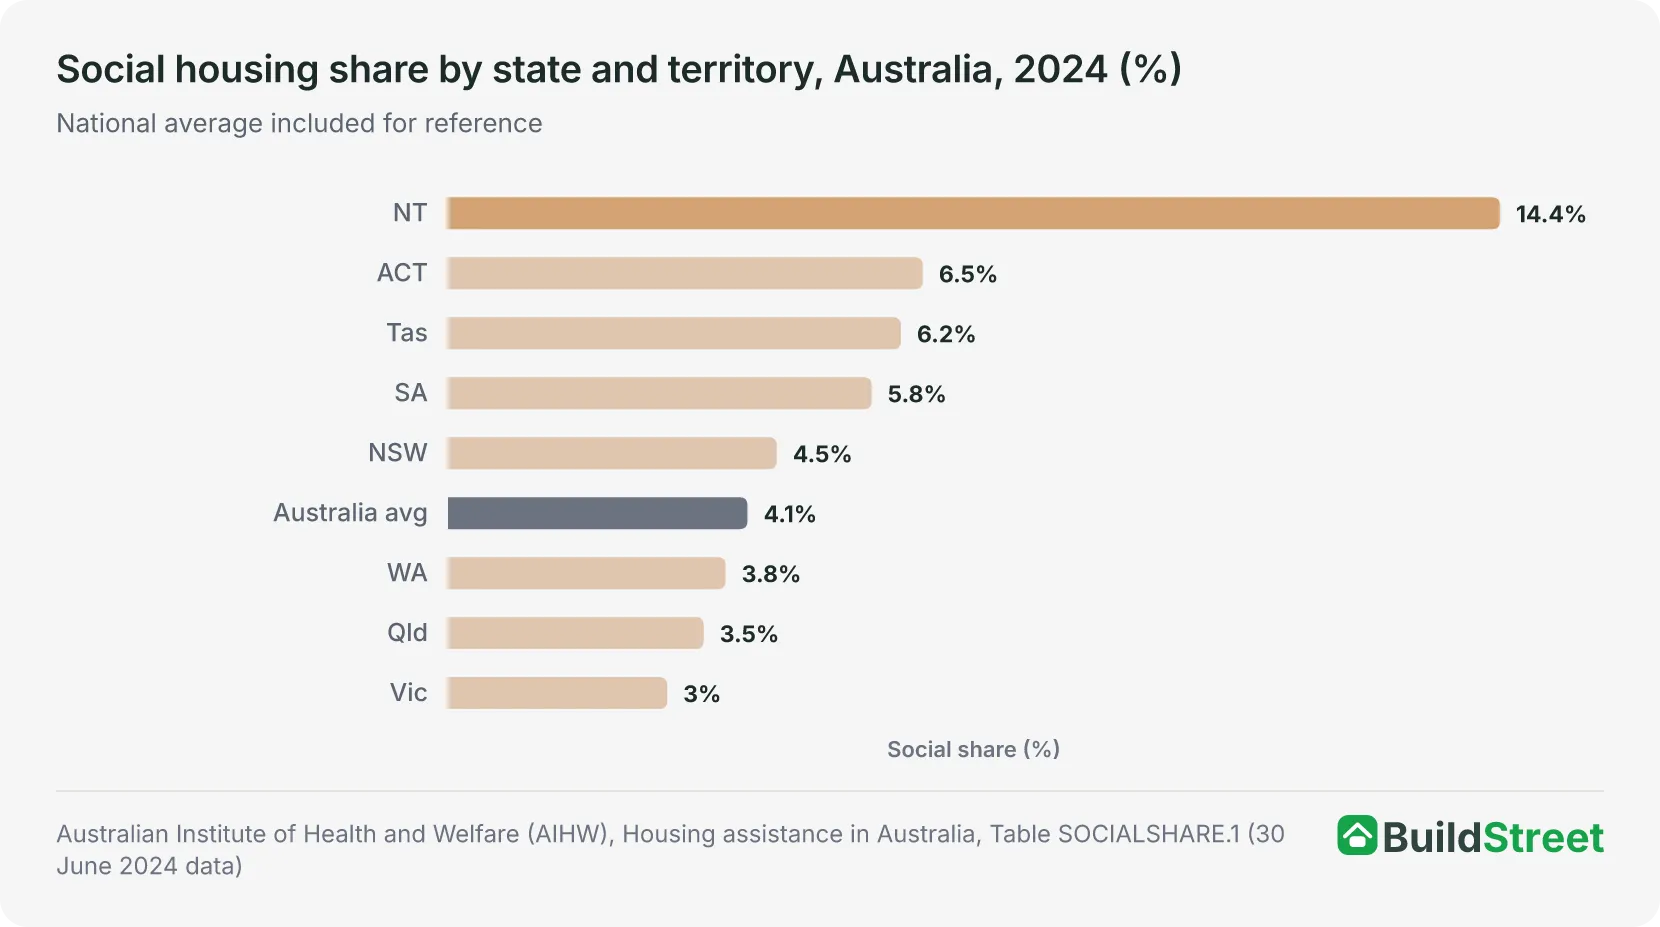
- ACT: 8.6% to 6.5% (down 2.1 percentage points, the steepest fall).
- South Australia: 7.4% to 5.8% (down 1.6 percentage points)
- NSW: 5.3% to 4.5% · WA: 4.3% to 3.8% · Victoria: 3.4% to 3.0%
- Tasmania was broadly stable, moving from 6.1% to 6.2%
- NT: AIHW notes that Northern Territory data are affected by stock transfers, meaning 2024 data are most comparable with 2018 rather than earlier years. The NT social housing share was 14.6% in 2018 and 14.4% in 2024, so the apparent rise from 7.6% in 2008 should not be read as a like-for-like increase in housing provision.
Section 05 · Government programmes
Major social and affordable housing programmes in Australia
State and territory governments spent $10.8 billion on social housing in 2024–25, made up of $5.9 billion in operational costs and $4.9 billion in capital works. Since 2023, the Commonwealth has also committed several major supply programmes, each at a different stage of delivery.
Progress toward the 40,000-home five-year target, using Housing Australia Rounds 1 and 2 contract data and the Round 3 announcement. Source: Housing Australia, HAFF/NHAF Rounds 1 and 2 contract update, 3 July 2025; HAFF Round 3 call for submissions, 30 January 2026.
- Total18,650
- Completed against five-year target889
— Five-year target: 40,000
Source · Housing Australia — Opening today: call for submissions, HAFF Round 3 to support 21,350 homes (30 January 2026) · from www.housingaustralia.gov.au
Social Housing Accelerator
$2 billion — One-off Commonwealth payment announced in 2023. The programme is now expected to deliver 4,251 new social homes, exceeding the original target of about 4,000.
National Agreement on Social Housing and Homelessness
$9.3 billion — Five-year Commonwealth/state agreement from 2024. Around $1.8 billion per year for operations and homelessness services. The agreement mainly funds social housing operations and homelessness services, rather than a separate new-build target.
National Housing Accord
1.2 million homes — Five-year total housing target (mid-2024 to mid-2029). The NHSAC estimated that around 938,000 homes would be completed by June 2029, leaving a projected shortfall of about 262,000 homes against the target.
NT Remote Housing Agreement
$4 billion — 10-year Commonwealth/NT agreement. Targeting up to 2,700 new homes in Aboriginal communities and upgrades to existing housing, to reduce overcrowding in remote areas.
Section 06 · Estimated shortfall
How much more social housing does Australia need?
The 189,536-household public housing waitlist at 30 June 2025 includes only registered applicants. Broader research estimates suggest the wider social and affordable housing gap is larger, although the main estimates measure different forms of need and are not directly comparable.
AHURI shortfall estimate (2023)
- 435,000
Shortfall for the lowest-income quintile. Extends to over 600,000 when including the next-lowest quintile.
UNSW City Futures / CHIA: unmet need (2021)
- 640,000+
Unmet need at the 2021 Census: homelessness, overcrowding, or severe rental stress. Projected to exceed 940,000 households by 2041.
AHURI cumulative need 2016 to 2036
- 727,300
Cumulative 2016–2036 need. Manifest unmet need: 46,600; evident need: 386,800; plus projected demand through 2036.
None of these figures should be treated as an official government target. The 435,000 estimate covers only the lowest-income quintile; the 640,000+ figure draws on a broader range of households from the 2021 Census; and the 727,300 figure is a cumulative 20-year projection, not a current point-in-time shortfall.
At the historical pace of about 2,800 net social housing additions per year, each estimate would imply a multi-decade delivery gap unless net additions increased substantially.
How well does public housing stock match household need?
The waitlist shows unmet demand from outside the system. But even within existing social housing, dwelling size and household need do not always align.
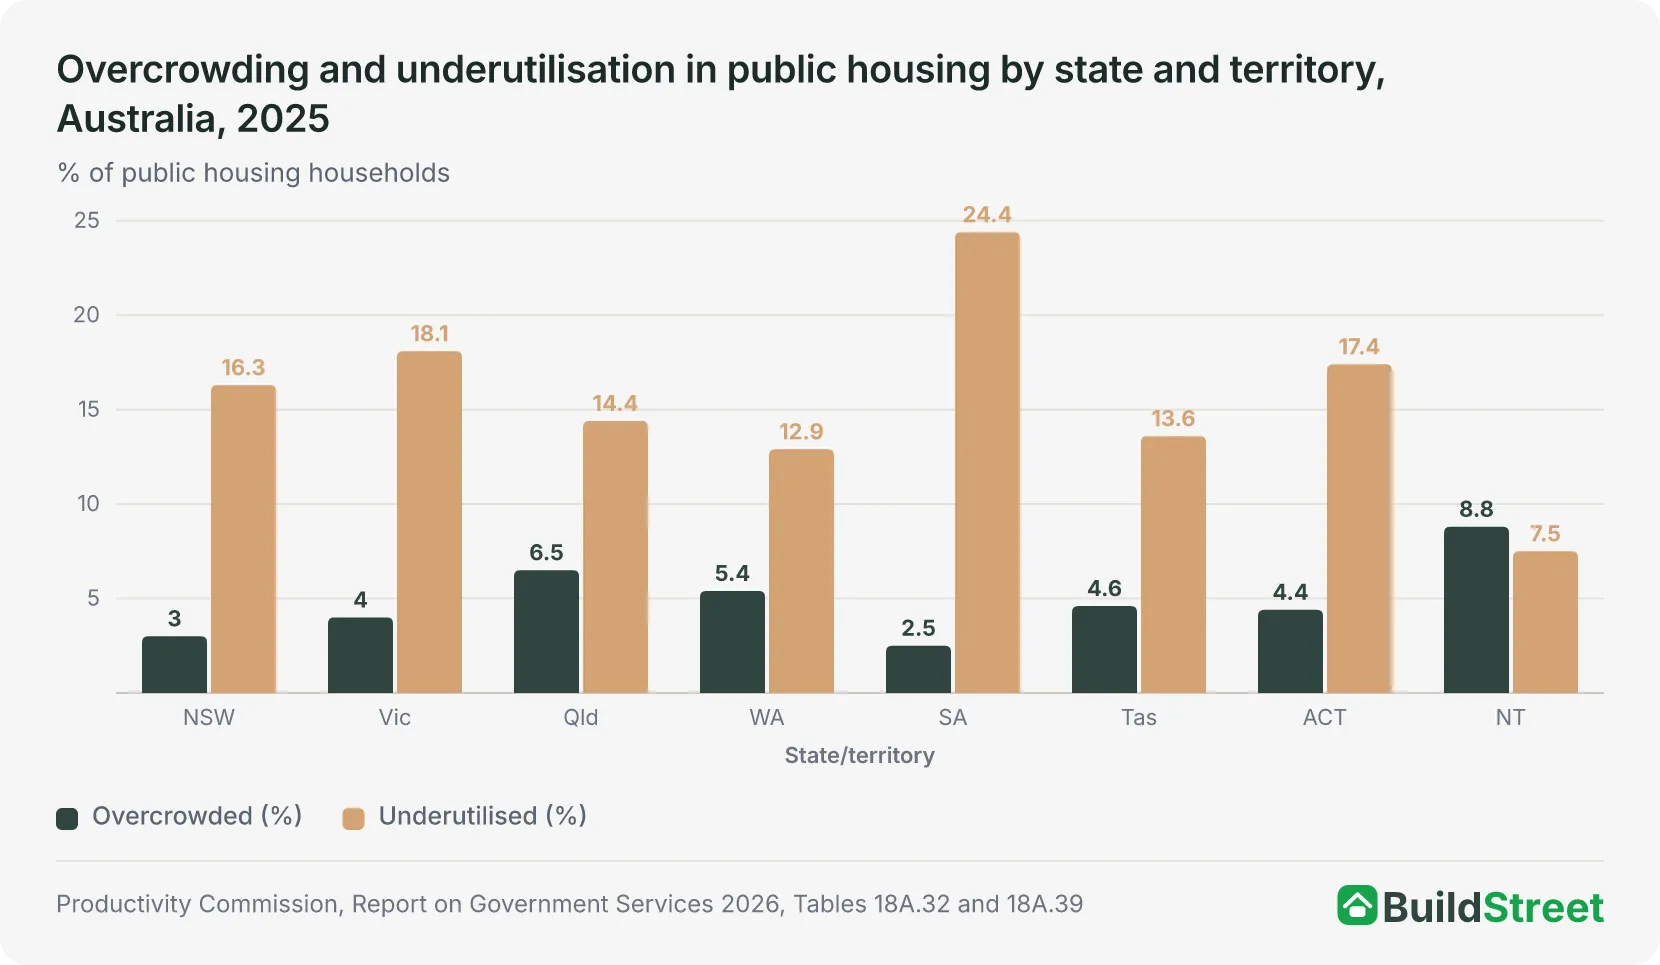
Nationally, 4.3% of public housing households, or about 12,300 households, were overcrowded at 30 June 2025. A larger share, 16.7%, or about 47,600 households, were living in dwellings larger than they required. This means the underutilised public housing pool was about 3.9 times the size of the overcrowded pool.
- South Australia has the highest underutilisation rate: 24.4%
- The Northern Territory has the highest overcrowding rate: 8.8%
Underutilisation typically reflects long-term tenants who remain in family-sized homes after their household has shrunk. Relocating established tenants to smaller dwellings requires suitable alternative properties nearby and may affect established community connections.
Section 07 · Demand and waiting
How many households are waiting for public housing in Australia?
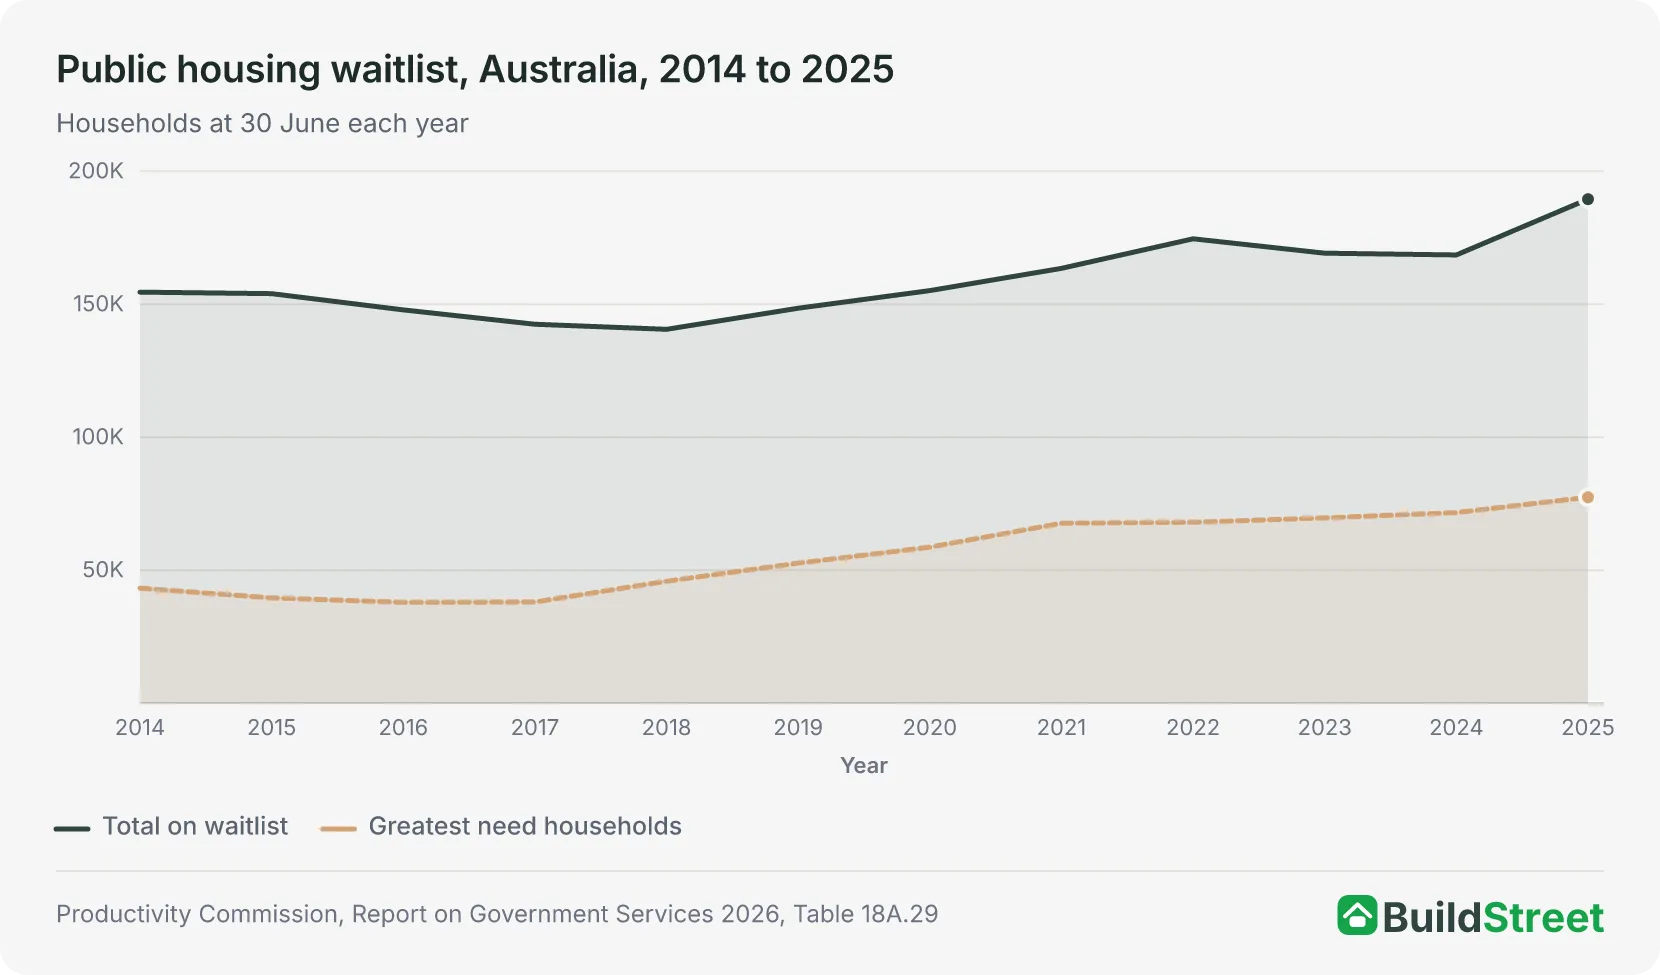
The public housing waitlist has grown since 2018, when it stood at 140,578 households. By 2025 it had reached 189,536, an increase of about 49,000 households over seven years. The largest growth was in the greatest-need category, which rose from 45,828 in 2018 to 77,425 in 2025, an increase of nearly 69%.
Victoria has the largest count of greatest-need households on the waitlist at 24,803, even though it has one of the lower social housing shares in the country. Queensland follows closely at 24,024, then NSW at 9,906. Differences between states partly reflect how each jurisdiction defines and classifies greatest need. From 2024–25, the national greatest-need standard was amended, making the figures for that year not directly comparable with prior years for some jurisdictions.
In 2024–25, 16,016 households were newly allocated to public housing nationally, with 13,471 households, or 84.1%, classified as greatest need. As a simple scale comparison, the current waitlist is about 12 times the number of public housing allocations made in 2024–25. This is not a forecast of waiting time, because new applications, exits, eligibility rules and priority systems change over time.
Section 08 · State comparison
How do Australian states and territories compare on social housing?
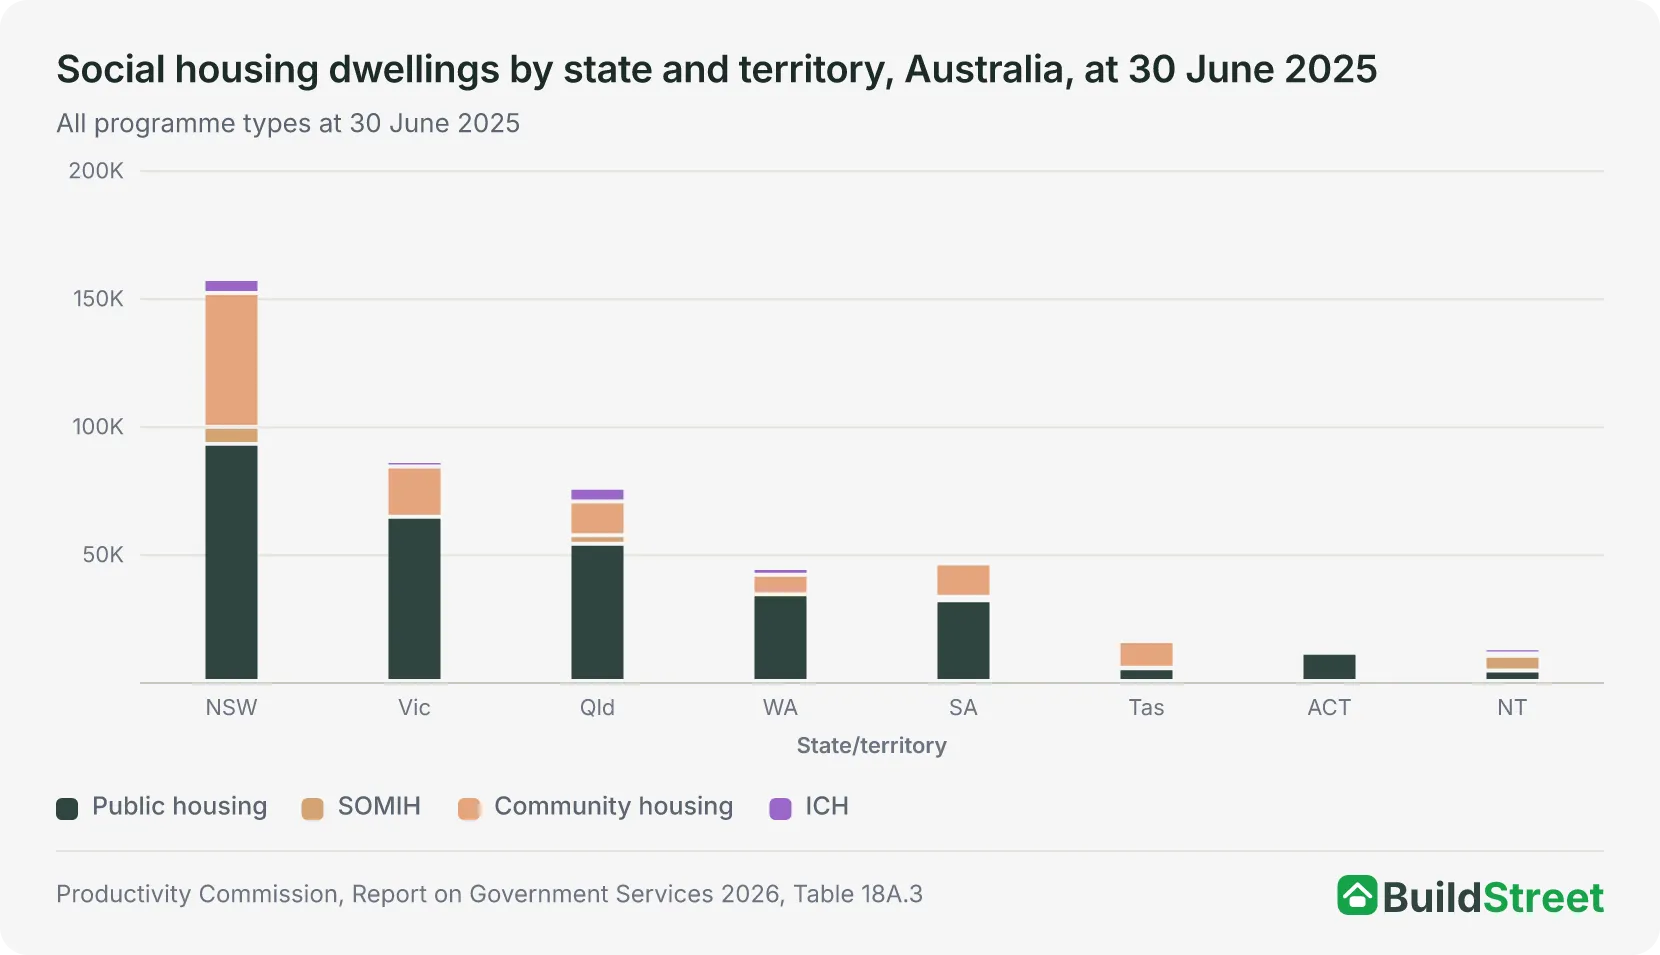
NSW had the most social housing by volume, with 157,171 dwellings at 30 June 2025, but the Northern Territory had the highest share at 14.4% of all households, based on the latest AIHW data for 2024. Victoria had the lowest share at 3.0%, followed by Queensland at 3.5%. State totals in the table below reflect all four programme types at 30 June 2025.
Composition also varies. About 66% of Tasmania's social housing stock was community-managed, the highest proportion of any state or territory. The ACT and NT relied most heavily on government-owned stock. The NT's high share reflects Indigenous housing programmes concentrated in remote communities.
| State and territory comparison: stock, demand and share | ||||||||
|---|---|---|---|---|---|---|---|---|
| State / territory | Public housing | Community housing | Indigenous (SOMIH+ICH) | Total dwellings | Social share | 2008 share | Public housing waitlist | Greatest need |
| New South Wales | 92,709 | 52,439 | 12,023 | 157,171 | 4.5% | 5.3% | 59,077 | 9,906 |
| Victoria | 64,277 | 19,625 | 2,146 | 86,048 | 3.0% | 3.4% | 56,230 | 24,803 |
| Queensland | 53,727 | 13,158 | 8,697 | 75,582 | 3.5% | 3.7% | 24,112 | 24,024 |
| Western Australia | 33,940 | 7,611 | 2,687 | 44,238 | 3.8% | 4.3% | 22,409 | 7,382 |
| South Australia | 31,611 | 13,010 | 2,057 | 46,678 | 5.8% | 7.4% | 13,687 | 3,021 |
| Tasmania | 5,051 | 10,430 | 258 | 15,739 | 6.2% | 6.1% | 5,152 | 4,124 |
| ACT | 11,097 | 1,246 | – | 12,343 | 6.5% | 8.6% | 3,402 | 1,925 |
| Northern Territory | 4,129 | 906 | 7,773 | 12,808 | 14.4% | 7.6% | 5,467 | 2,240 |
| Australia total | 296,541 | 118,425 | 35,641 | 450,607 | 4.1% | 4.7% | 189,536 | 77,425 |
Source · Productivity Commission, Report on Government Services 2026, Tables 18A.3 and 18A.29 (all stock programme types and waitlist at 30 June 2025); AIHW, Housing assistance in Australia 2025, Table SOCIALSHARE.1 (social share at 30 June 2024, latest available). Public housing waitlist excludes transfer applicants. Greatest-need definition changed in 2024–25; waitlist figures for that year are not directly comparable with prior years for NSW, Vic and WA.
Section 09 · Delivery model
Community housing providers now manage more than a quarter of Australia's social housing
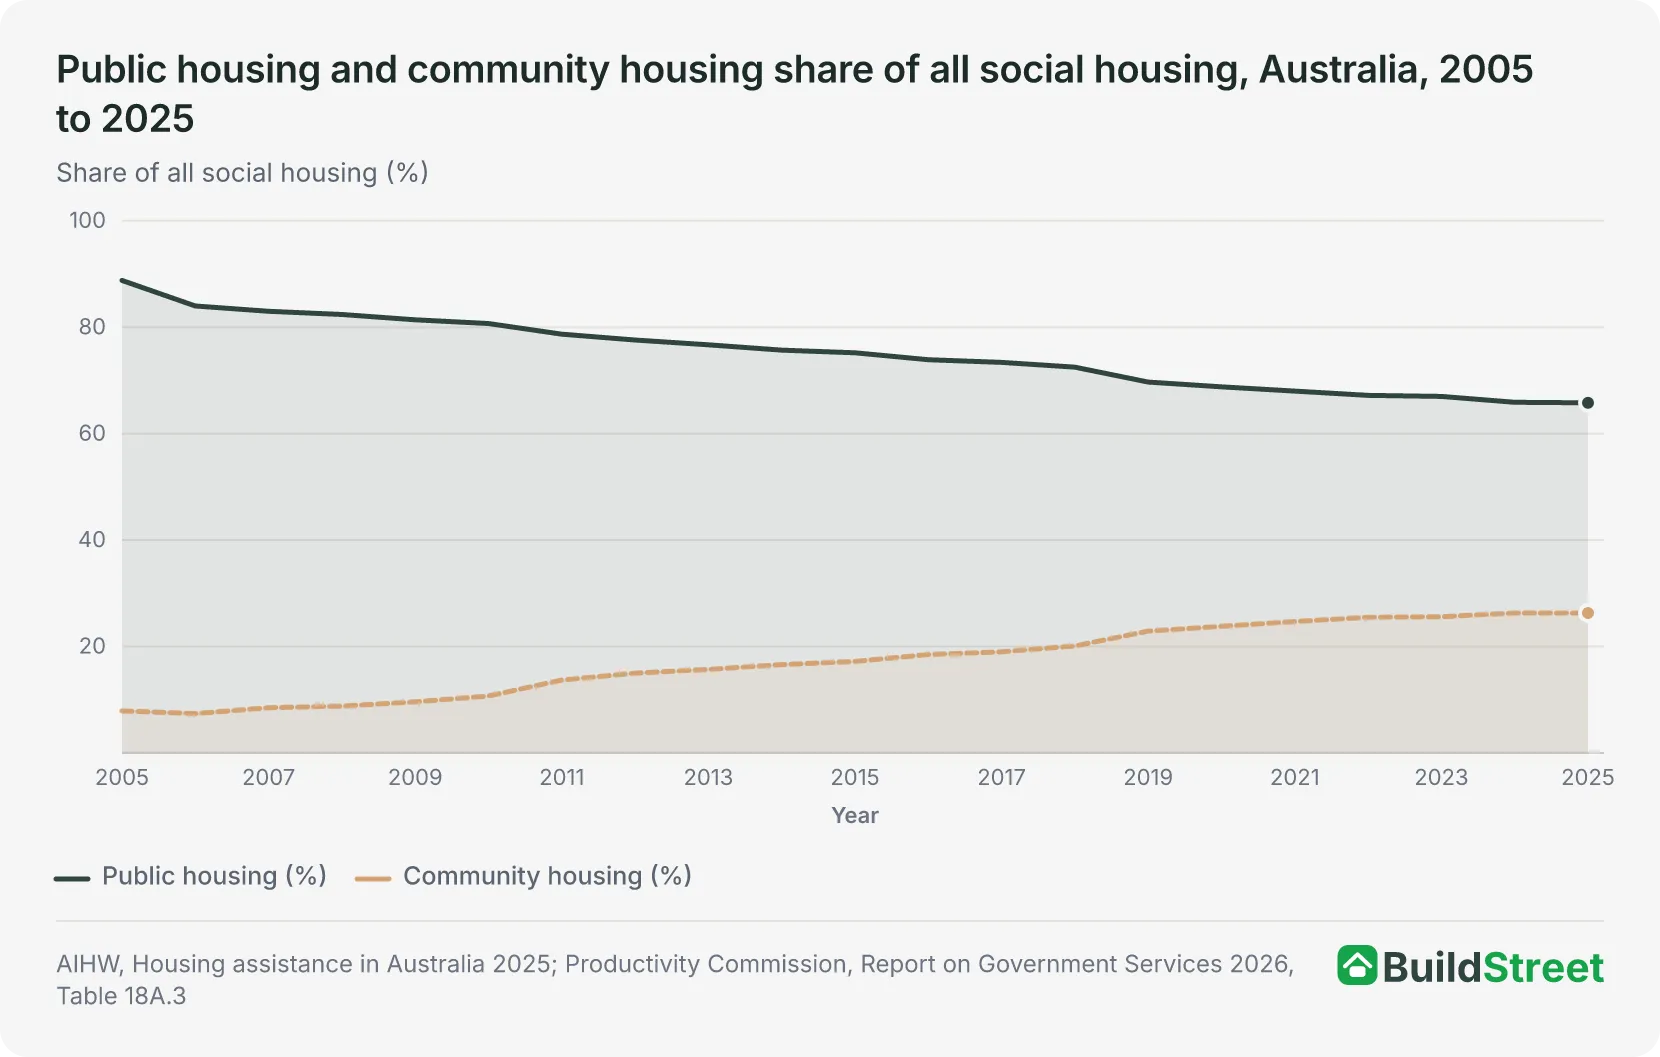
Community housing providers (CHPs) managed 26.3% of all social housing at 30 June 2025, up from 7.9% in 2005. Over the same period, public housing's share of the system fell from 88.8% to 65.8%.
CHPs can access Commonwealth Rent Assistance through eligible tenants, a revenue stream not available to direct government landlords, and can draw on private funding more flexibly. Most HAFF and NHAF funding is channelled through CHPs, so the sector's share may grow as those programmes deliver.
NSW had the largest community housing portfolio nationally, with 52,439 tenancy units, followed by Victoria, with 19,625, and South Australia, with 13,010. Tasmania had the highest community housing share of any state or territory at about 66% of its total social housing stock. The ACT and NT relied most heavily on government-owned stock.
Section 10
Frequently asked questions
References
- Productivity Commission, Report on Government Services 2026 — Part G Section 18 Housing data tables (June 2026 release) · pc.gov.au
- Australian Institute of Health and Welfare (AIHW), Housing assistance in Australia 2025 · aihw.gov.au
- Housing Australia — Funding under the Housing Australia Future Fund Facility and National Housing Accord Facility · housingaustralia.gov.au
- Housing Australia — Contracts signed to support 18,650 social and affordable homes under the Housing Australia Future Fund (Rounds 1 and 2 contract update, 3 July 2025) · housingaustralia.gov.au
- Housing Australia — Opening today: call for submissions, HAFF Round 3 to support 21,350 homes (30 January 2026) · housingaustralia.gov.au
- Treasury — Social Housing Accelerator progress reporting · treasury.gov.au
- NHSAC State of the Housing System 2026 · nhsac.gov.au
- OECD Affordable Housing Database — HM1.1 Housing stock and construction (April 2024) · oecd.org
- Australian Housing and Urban Research Institute (AHURI) — Final Report 452, Australia's multi-provider social housing system: contest or growth (2026) · ahuri.edu.au
- Australian Housing and Urban Research Institute (AHURI) — Final Report 306, Social housing as infrastructure (2018) · Australian Housing and Urban Research Institute (AHURI)
- UNSW City Futures Research Centre / CHIA — Quantifying Australia's unmet housing need: a national snapshot · unsw.edu.au
