

Published 18 May 2026 · Updated 22 Sept 2026
Melbourne approved more new homes than any other capital city in 2025–26, recording 42,788 dwelling approvals. That was 20.9% higher than Sydney, which ranked second with 35,404 approvals despite being one of Australia's fastest-growing cities.
Across Australia, dwelling approvals rose 9.4% to 205,569, the highest financial-year total since 2020–21 and a second straight year of growth. Brisbane recorded the fastest growth of the five largest capitals, and Queensland's major markets led the country on momentum, with Brisbane City ranking as the top council nationally.
 Where is residential land still available in Australia?Australia has large volumes of land zoned for housing across every state, but much of it is not yet ready to build on. In New South Wales, for example, 59% of zoned residential land in the Sydney Mega…
 Why is Australia falling short of its housing target?Australia is behind the pace needed to meet its 1.2 million-home target. By the March 2026 quarter, 308,000 homes had been completed, equal to about 26% of the National Housing Accord goal. To reach t…
Section 01 · City overview
Melbourne leads Australian cities for new home approvals
Capital city approvals show where Australia's new housing pipeline is strongest.
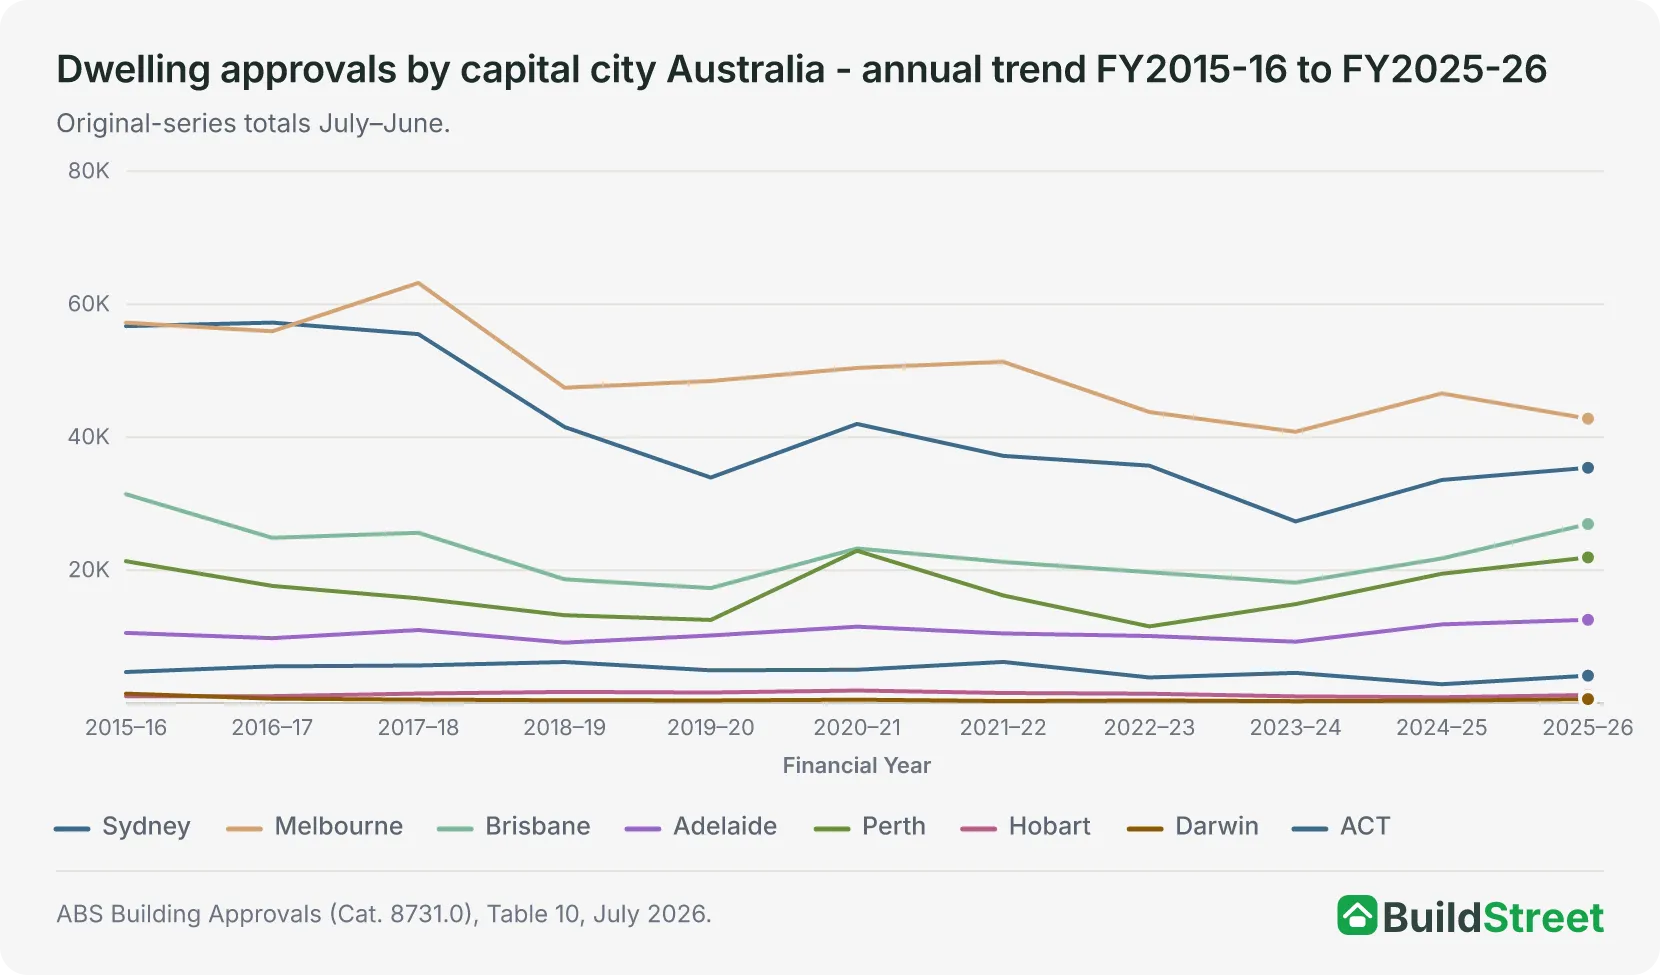
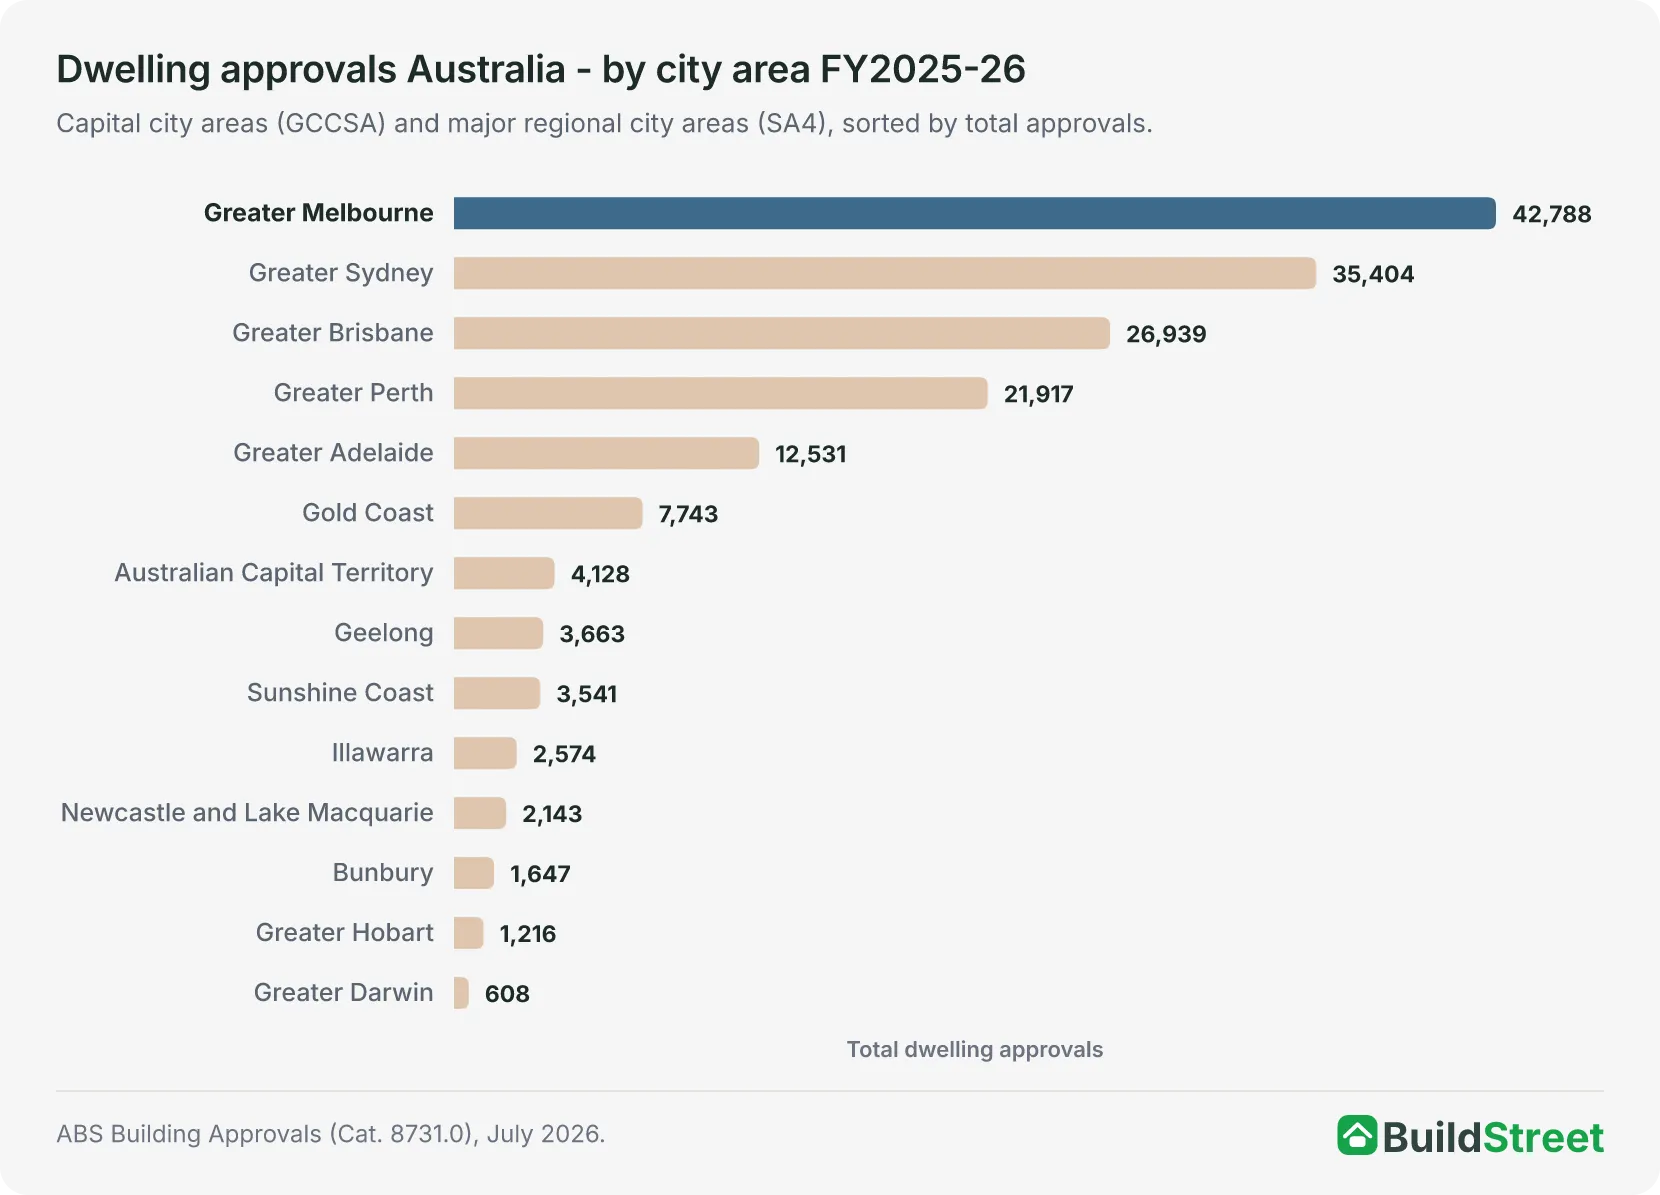
Melbourne has recorded the highest number of dwelling approvals among Australian capital cities for nine consecutive years. In 2025–26, Greater Melbourne approved 42,788 dwellings, which was 7,384 more than Greater Sydney, even though Melbourne's approvals fell 8.2% and Sydney's rose 5.5%. That gap was still larger than the combined annual approvals of the ACT, Greater Hobart and Greater Darwin.
Melbourne's lead over Sydney has narrowed
Melbourne approved 7,384 more dwellings than Sydney in 2025–26, down from a gap of 13,021 a year earlier. In 2015–16, the gap between Melbourne and Sydney was almost zero. Sydney now records 6.3 approvals per 1,000 residents, the lowest of any major capital, compared with Melbourne's 7.9 approvals per 1,000 residents.
Perth approvals are recovering from a sharp fall
Perth's approvals fell 49.6% from 2020–21 to 2022–23, a steeper correction than any other major capital. The recovery to 21,917 in 2025–26 represents an 89.9% rebound from the trough over three years. July 2026, the first month of 2026–27, brought 2,056 approvals, 17.9% above July 2025.
Section 02 · City rankings
Top Australian cities for new home approvals
The four largest capital cities, Melbourne, Sydney, Brisbane and Perth, together account for 61.8% of all national approvals. Melbourne has been the clear leader since 2017–18.
Among regional areas, the Gold Coast ranks highest at 7,743 approvals, ahead of the ACT, Geelong and the Sunshine Coast in volume.
Bunbury's presence in the top twelve reflects the pace of Perth's extended growth corridor into southwest WA, where 93.1% of approvals are detached houses.
| City area | Type | Total approvals FY25-26 | Houses | Non-house | House % | FY24-25 total | Change |
|---|---|---|---|---|---|---|---|
| Greater Melbourne | GCCSA | 42,788 | 23,175 | 19,613 | 54.2% | 46,590 | −8.2% |
| Greater Sydney | GCCSA | 35,404 | 14,263 | 21,141 | 40.3% | 33,569 | +5.5% |
| Greater Brisbane | GCCSA | 26,939 | 15,819 | 11,120 | 58.7% | 21,765 | +23.8% |
| Greater Perth | GCCSA | 21,917 | 17,628 | 4,289 | 80.4% | 19,462 | +12.6% |
| Greater Adelaide | GCCSA | 12,531 | 7,854 | 4,677 | 62.7% | 11,845 | +5.8% |
| Gold Coast | SA4 | 7,743 | 1,289 | 6,454 | 16.6% | 4,175 | +85.5% |
| Australian Capital Territory | GCCSA | 4,128 | 808 | 3,320 | 19.6% | 2,840 | +45.4% |
| Geelong | SA4 | 3,663 | 3,083 | 580 | 84.2% | 2,902 | +26.2% |
| Sunshine Coast | SA4 | 3,541 | 2,026 | 1,515 | 57.2% | 3,502 | +1.1% |
| Illawarra | SA4 | 2,574 | 923 | 1,651 | 35.9% | 2,278 | +13.0% |
| Newcastle and Lake Macquarie | SA4 | 2,143 | 1,137 | 1,006 | 53.1% | 2,076 | +3.2% |
| Bunbury | SA4 | 1,647 | 1,534 | 113 | 93.1% | 1,881 | −12.4% |
| Greater Hobart | GCCSA | 1,216 | 1,012 | 204 | 83.2% | 885 | +37.4% |
| Greater Darwin | GCCSA | 608 | 439 | 169 | 72.2% | 364 | +67.0% |
Source · ABS Building Approvals (Cat. 8731.0), July 2026. Methodology: GCCSA totals summed from monthly original-series approvals (Table 10), July to June. SA4 totals from the ABS SA2 data cubes: FY2025–26 from the July 2026 release; FY2024–25 as first published in the June 2025 release.
Section 03 · Monthly trends
Which capital city is approving the most new homes?
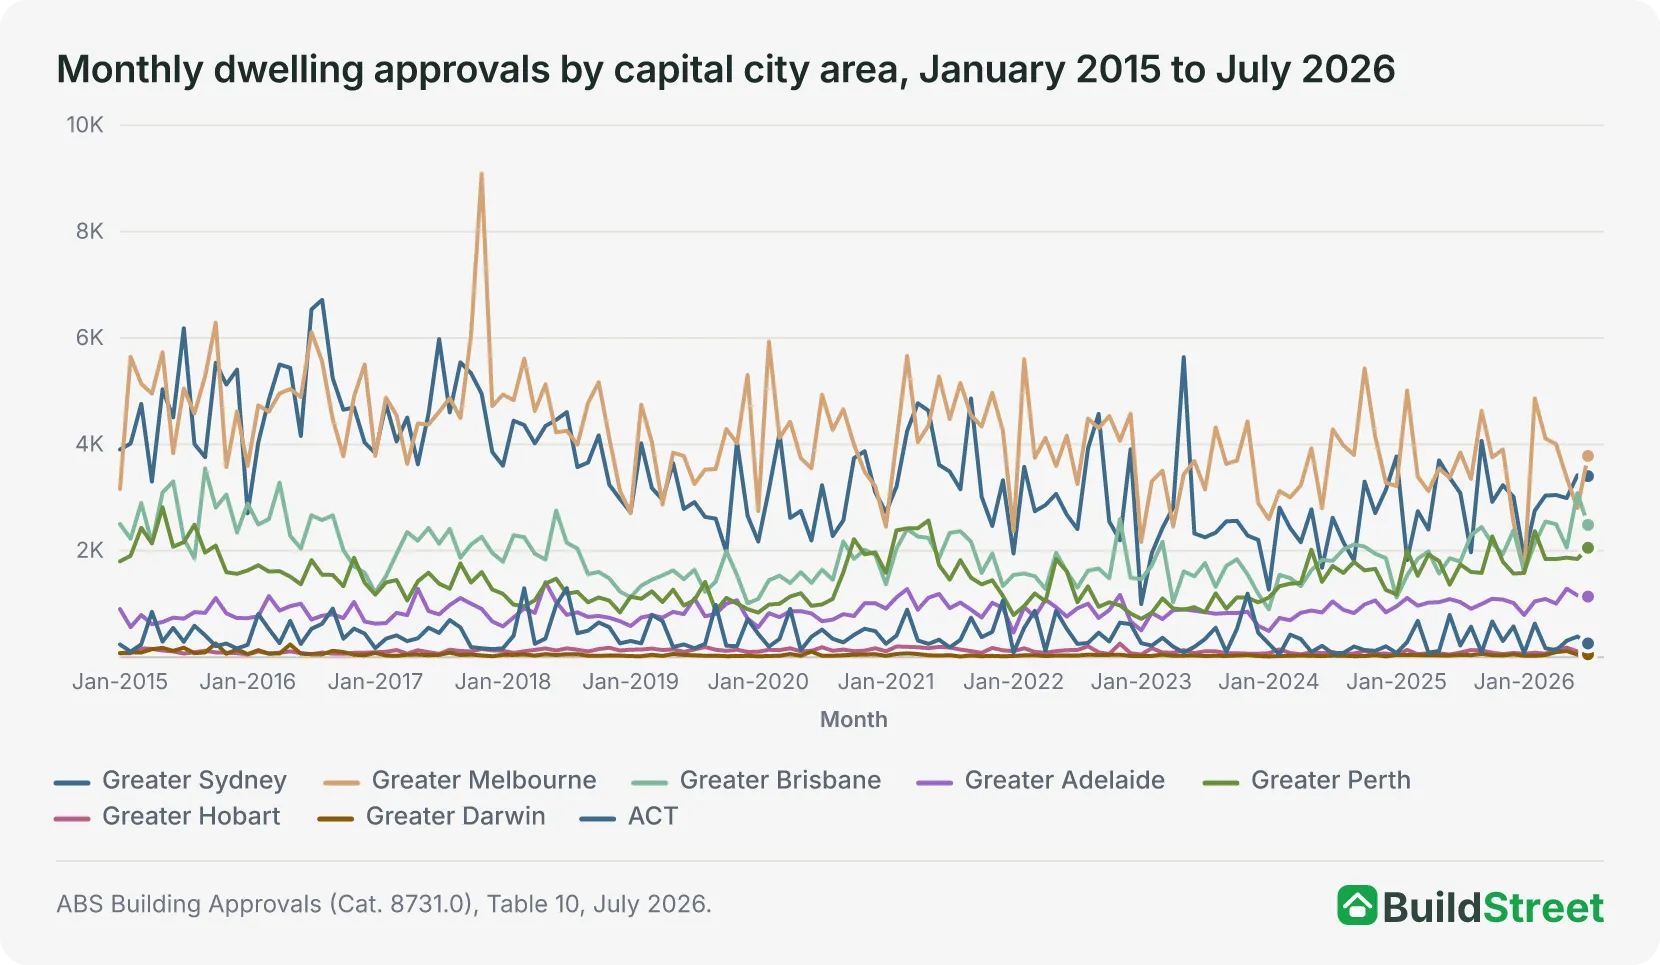
Perth's monthly recovery stands out in the data. Its approvals rose from monthly lows of between 700 and 900 in early 2023 to above 1,500 per month in every month of 2025–26, peaking at 2,368 in February 20261. Queensland's monthly run-rate in the second half of 2025 reached its strongest sustained levels in recent years, due to strong activity across Brisbane City, the Gold Coast, Sunshine Coast, Logan and Moreton Bay.
Seasonal cycles are consistent across every capital. December and January regularly record lower approvals as building activity winds down, while spring months often bring a surge in house consents.
Sydney's monthly approvals, which briefly fell below 1,000 in January 20231, recovered strongly in 2024 and remain above their 2019–23 average. Melbourne shows increased volatility, with a sharp February 2026 reading of 4,865 following a soft January of 1,609, and a weak June 2026 of 2,803 rounding out a financial year in which its approvals fell 8.2%.
Section 04 · Regional cities
Gold Coast, Sunshine Coast, Geelong: the regional cities driving approvals
The Gold Coast is the standout performer. In 2025–26 it recorded 7,743 approvals, up 85% on the 4,175 it approved in 2024–25.
That total ranks it sixth among all city areas, above the ACT, Greater Hobart and Greater Darwin in absolute volume.
Geelong and the Sunshine Coast are the next busiest regional areas, with 3,663 and 3,541 approvals, respectively. At the other end of the spectrum, Bunbury's 1,647 approvals are almost entirely detached houses, making it the most house-intensive major city area in the country.
The Gold Coast also has the most apartment-heavy pipeline of any regional city. At 83.4% non-house approvals, it is far more apartment-intensive than Brisbane itself, driven by high-density development along the coastal corridor.
Section 05 · Detached houses
Where are the most separate houses being built?
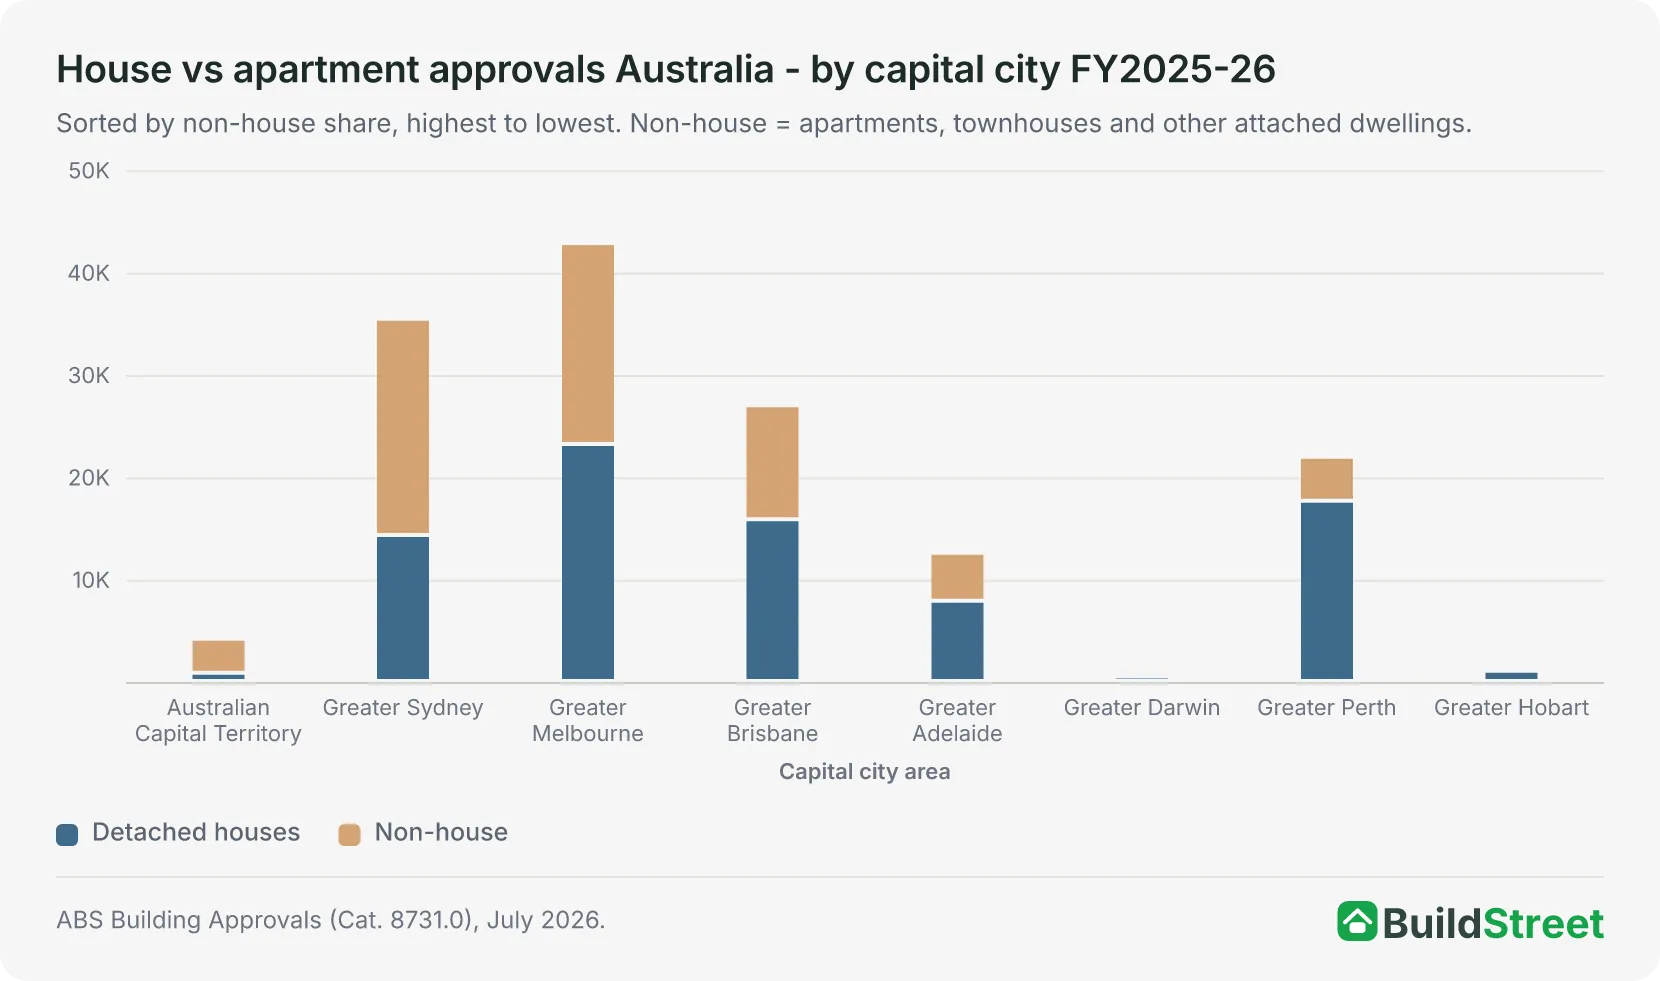
Perth approved more houses than Sydney in 2025–26. Despite being Australia's second-largest market overall, Greater Sydney recorded only 14,263 house approvals, fewer than both Perth (17,628) and Brisbane (15,819). Greater Melbourne led the field with 23,175.
House approvals are concentrated in outer-urban growth corridors.
| Capital city area | House approvals FY2025–26 | Houses share | Key growth corridors |
|---|---|---|---|
| Greater Melbourne | 23,175 | 54.2% | Wyndham, Melton, Hume, Mitchell |
| Greater Perth | 17,628 | 80.4% | Wanneroo, Swan, Rockingham, Armadale |
| Greater Brisbane | 15,819 | 58.7% | Ipswich, Logan, Moreton Bay north |
| Greater Sydney | 14,263 | 40.3% | South West, Outer South West, Hills |
| Greater Adelaide | 7,854 | 62.7% | Playford, Onkaparinga, Gawler |
| Greater Hobart | 1,012 | 83.2% | Brighton, Sorell, Derwent Valley |
| Australian Capital Territory | 808 | 19.6% | Molonglo, Gungahlin, Denman Prospect |
| Greater Darwin | 439 | 72.2% | Palmerston south |
Source · ABS Building Approvals (Cat. 8731.0), July 2026. House sub-totals from ABS GCCSA original series (Table 10). Houses share = house approvals divided by total approvals.
At the LGA level, the councils with the highest house approvals are almost all in outer-urban growth corridors. Moreton Bay (QLD) approved 4,601 houses, followed by Melton (VIC, 3,906) and Wyndham (VIC, 3,384). Queensland's outer ring also includes Logan (3,685 houses) and Ipswich (2,674). In WA, Wanneroo approved 3,794 houses, 94.4% of its 4,017 total, with the Alkimos-Eglinton corridor alone contributing 1,593 dwellings. SA's Playford LGA (1,986 houses) accounts for 19.1% of all SA house approvals, driven by the Munno Para West-Angle Vale corridor, which added 1,286 dwellings in 2025–26.
Section 06 · Apartment supply
The cities and suburbs leading apartment approvals
Melbourne and Sydney together account for 63.2% of all non-house approvals across Australia's eight capital cities. Greater Sydney leads in volume with 21,141 non-house dwellings in 2025–26, 59.7% of its total. Greater Melbourne's 19,613 is second, a 45.8% share of its total after a 13% fall in its non-house approvals.
The ACT is the most apartment-intensive market by share at 80.4% non-house, reflecting its urban consolidation planning framework. Tasmania is at the opposite end: houses account for 83.2% of Greater Hobart approvals and 91.7% of all Tasmania approvals.
Melbourne City LGA is the most extreme example, approving just 8 houses against 3,958 non-house dwellings in 2025–26. Yarra and Parramatta tell a similar story, with non-house shares of 98% and 88%.
Section 07 · Population vs supply
Where population growth and housing supply are out of step
Sydney approves the fewest homes per resident of any major capital.
Despite recording population growth of 1.35%2, Greater Sydney approved just 6.3 dwellings per 1,000 residents in 2025–26, well below Brisbane's 9.5, Perth's 8.9, Adelaide's 8.4 and Melbourne's 7.9.
| Capital city area | FY2025–26 approvals | Per 1,000 residents | Population growth 2024–25 |
|---|---|---|---|
| Greater Brisbane | 26,939 | 9.5 | +2.10% |
| Greater Perth | 21,917 | 8.9 | +2.43% |
| Australian Capital Territory | 4,128 | 8.5 | +1.30% |
| Greater Adelaide | 12,531 | 8.4 | +1.27% |
| Greater Melbourne | 42,788 | 7.9 | +1.97% |
| Greater Sydney | 35,404 | 6.3 | +1.35% |
| Greater Hobart | 1,216 | 4.8 | +0.21% |
| Greater Darwin | 608 | 3.8 | +1.74% |
Source · ABS Building Approvals (Cat. 8731.0), July 2026; ABS Regional Population, 2024–25. Approvals per 1,000 residents = FY2025–26 GCCSA approvals divided by the estimated resident population at 30 June 2025 (the latest published) × 1,000. Population growth from ABS Regional Population, 2024–25.
Darwin has the third-highest population growth rate among the eight capitals at 1.74%, yet the lowest approvals per 1,000 residents at 3.8. Logistics cost premiums, limited builder competition, and lower land values consistently suppress new construction relative to demand. This helps explain why both jurisdictions consistently underbuild relative to their population size and growth rate.
Hobart's population growth is the weakest of any capital at just 0.21%2, and its low per-capita approval rate reflects genuinely weaker demand rather than a supply-demand mismatch.
Section 08 · State comparison
Which states are building the most homes?
Victoria approved more homes than any other state in 2025–26 at 55,798, but it was the only state or territory to go backwards, down 1.5% on a revised 56,657 in 2024–25.
Among the states, Queensland led on growth at 26.9%, followed by the Northern Territory (20.5%), Tasmania (16.8%) and Western Australia (11.8%), while the ACT rebounded 45.4% from a weak 2024–25. New South Wales and Queensland rounded out the top three by volume at 52,426 and 48,738, respectively.
| State / territory | FY2023–24 | FY2024–25 | FY2025–26 | Change FY2025–26 |
|---|---|---|---|---|
| Victoria | 51,921 | 56,657 | 55,798 | −1.5% |
| New South Wales | 43,018 | 49,507 | 52,426 | +5.9% |
| Queensland | 32,995 | 38,420 | 48,738 | +26.9% |
| Western Australia | 17,465 | 22,950 | 25,653 | +11.8% |
| South Australia | 11,295 | 14,526 | 15,244 | +4.9% |
| ACT | 4,549 | 2,840 | 4,128 | +45.4% |
| Tasmania | 2,569 | 2,341 | 2,735 | +16.8% |
| Northern Territory | 437 | 703 | 847 | +20.5% |
| Australia | 164,249 | 187,944 | 205,569 | +9.4% |
Source · ABS Building Approvals (Cat. 8731.0), July 2026. Methodology: Financial-year totals are the sum of monthly state original-series approvals (Table 09). FY2024–25 figures reflect ABS revisions since first publication.
Section 09 · LGA rankings
Brisbane City leads Australia's councils on housing approvals
Brisbane City Local Government Area (LGA) is the highest-approving council in Australia. Its 9,255 approvals in 2025–26 represent 19.0% of Queensland's entire state output from a single council, more than Tasmania (2,735) and the Northern Territory (847) combined. Its mix included 6,433 non-house dwellings and 2,822 detached houses.
The top 15 councils nationally account for roughly 33% of all approvals across the country's 537 LGAs. Melton (4,563) and Wyndham (4,049) are primarily greenfield house markets, with Wyndham's Tarneit, Truganina and Wyndham Vale corridors among the fastest-developing areas in the country. Melbourne City itself (3,966) is nearly all apartments: just 8 houses in 2025–26.
| Rank | LGA | State | Total dwelling approvals |
|---|---|---|---|
| 1 | Brisbane | Queensland | 9,255 |
| 2 | Gold Coast | Queensland | 7,616 |
| 3 | Moreton Bay | Queensland | 6,636 |
| 4 | Logan | Queensland | 5,017 |
| 5 | Melton | Victoria | 4,563 |
| 6 | Wyndham | Victoria | 4,049 |
| 7 | Wanneroo | Western Australia | 4,017 |
| 8 | Melbourne | Victoria | 3,966 |
| 9 | Ipswich | Queensland | 3,522 |
| 10 | Casey | Victoria | 3,517 |
| 11 | Sunshine Coast | Queensland | 3,297 |
| 12 | Greater Geelong | Victoria | 3,212 |
| 13 | Hume | Victoria | 3,060 |
| 14 | Whittlesea | Victoria | 2,791 |
| 15 | The Hills | New South Wales | 2,696 |
Source · ABS Building Approvals (Cat. 8731.0), LGA data cubes, FY2025–26.
In WA, Wanneroo's 3,794 house approvals include 1,593 dwellings in the Alkimos-Eglinton corridor alone. In SA, Playford's Munno Para West-Angle Vale corridor contributed 1,286 of the LGA's 2,241 total.
In NSW, The Hills Shire and Parramatta tied as the state's top councils at 2,696 approvals each, from opposite ends of the supply spectrum. Roughly half of The Hills' approvals are greenfield houses. Parramatta is 88.2% non-house, driven by high-rise projects in the Parramatta CBD and the Carlingford renewal corridor (428 non-house approvals)
Section 10 · Key drivers
The reasons why some cities are building more homes than others
Brisbane's approval rate of 9.5 per 1,000 residents, compared with Sydney's 6.3, is one of the sharpest contrasts in the data. Five factors explain most of the variation between cities, and they interact differently in each market.
Land supply and greenfield release programmes
Cities with active land release programmes, including outer Melbourne, Perth's northern and southeastern corridors and SEQ's outer ring, consistently produce higher approval volumes. Sydney's lower approvals per 1,000 residents may reflect a mix of land constraints, planning settings, rezoning timelines and project feasibility issues. The exact mix of causes is debated.
Population growth and migration patterns
Perth's approval surge from 2023–24 tracks a major migration wave tied to the resources sector. Brisbane and the Gold Coast have sustained strong interstate migration from Sydney and Melbourne. Darwin and Hobart have low per-capita approval rates that correspond with weaker population growth, though Darwin's case is also heavily influenced by construction costs.
Multi-unit project feasibility
Apartment and townhouse approvals depend on pre-sales to secure construction finance, which in turn depends on market confidence and pricing. In markets where values have risen strongly, such as Perth, Brisbane and the Gold Coast, feasibility has improved and non-house approvals have grown. In Melbourne, higher land tax on investment properties and state government policy changes appear to have reduced investor appetite.
Freight and logistics cost penalties
Tasmania and the Northern Territory face structural cost disadvantages. Materials shipped across Bass Strait or from southern ports add significantly to every build, suppressing new construction relative to demand. This helps explain why both jurisdictions consistently underbuild relative to their population size and growth rate.
Planning approval speed and local implementation
State planning reforms have accelerated some development application processing, but council-level implementation remains uneven. Queensland's current approval momentum suggests its pipeline is moving faster than several other states, though approval speed can vary significantly by council and project type.
Section 11 · Buyers & renters
What the approval data means for buyers and renters
Australia's national approval rate of roughly 205,000 dwellings per year still falls short of the National Housing Accord target of approximately 240,000 per year3.
The gap points to continuing supply pressure in most major markets, with NSW and Victoria needing to close the shortfall significantly to meet the 2029 milestone.
Approvals lead construction by roughly 12 to 18 months for houses and longer for multi-unit projects. The current approval pattern points to where new supply will be concentrated over the next two years.
For buyers considering building
The strongest active pipelines, including Perth's northern corridor, outer Melbourne's Wyndham and Melton precincts, southeast Queensland's outer ring and Adelaide's Playford corridor, suggest trade availability and land supply are likely to be better than in constrained markets. Queensland's approval pace, if sustained, will add significant stock to the SEQ market by late 2026 and into 2027.
For renters
Relief from new supply is most likely to arrive first in high-approval markets. Sydney's low per-capita approvals, ongoing build-time pressures for multi-unit projects and a slow recovery from the 2023–24 trough suggest rental supply improvement will lag other capitals. Victoria's 2025–26 decline is worth watching. If it persists into 2026–27, it could delay the pipeline recovery that was expected to follow the 2024–25 approval rebound.
The National Housing Accord target tracker covers the full shortfall in detail. For context on how long approved homes actually take to build, see building times by state.
References
- ABS Building Approvals, Australia, July 2026 — Table 10 (dwelling units approved, by Greater Capital City Statistical Area, original) · Australian Bureau of Statistics ↑ b
- ABS: Regional Population, 2024–25 · Australian Bureau of Statistics ↑ b
- NHSAC Quarterly Report, March 2026 · nhsac.gov.au ↑
- ABS Building Approvals, Australia (latest release, Cat. 8731.0) · Australian Bureau of Statistics
- Australian Statistical Geography Standard (ASGS), Edition 3 · Australian Bureau of Statistics
- National Housing Accord · treasury.gov.au
