

Published 1 July 2026 · Updated 29 Sept 2026
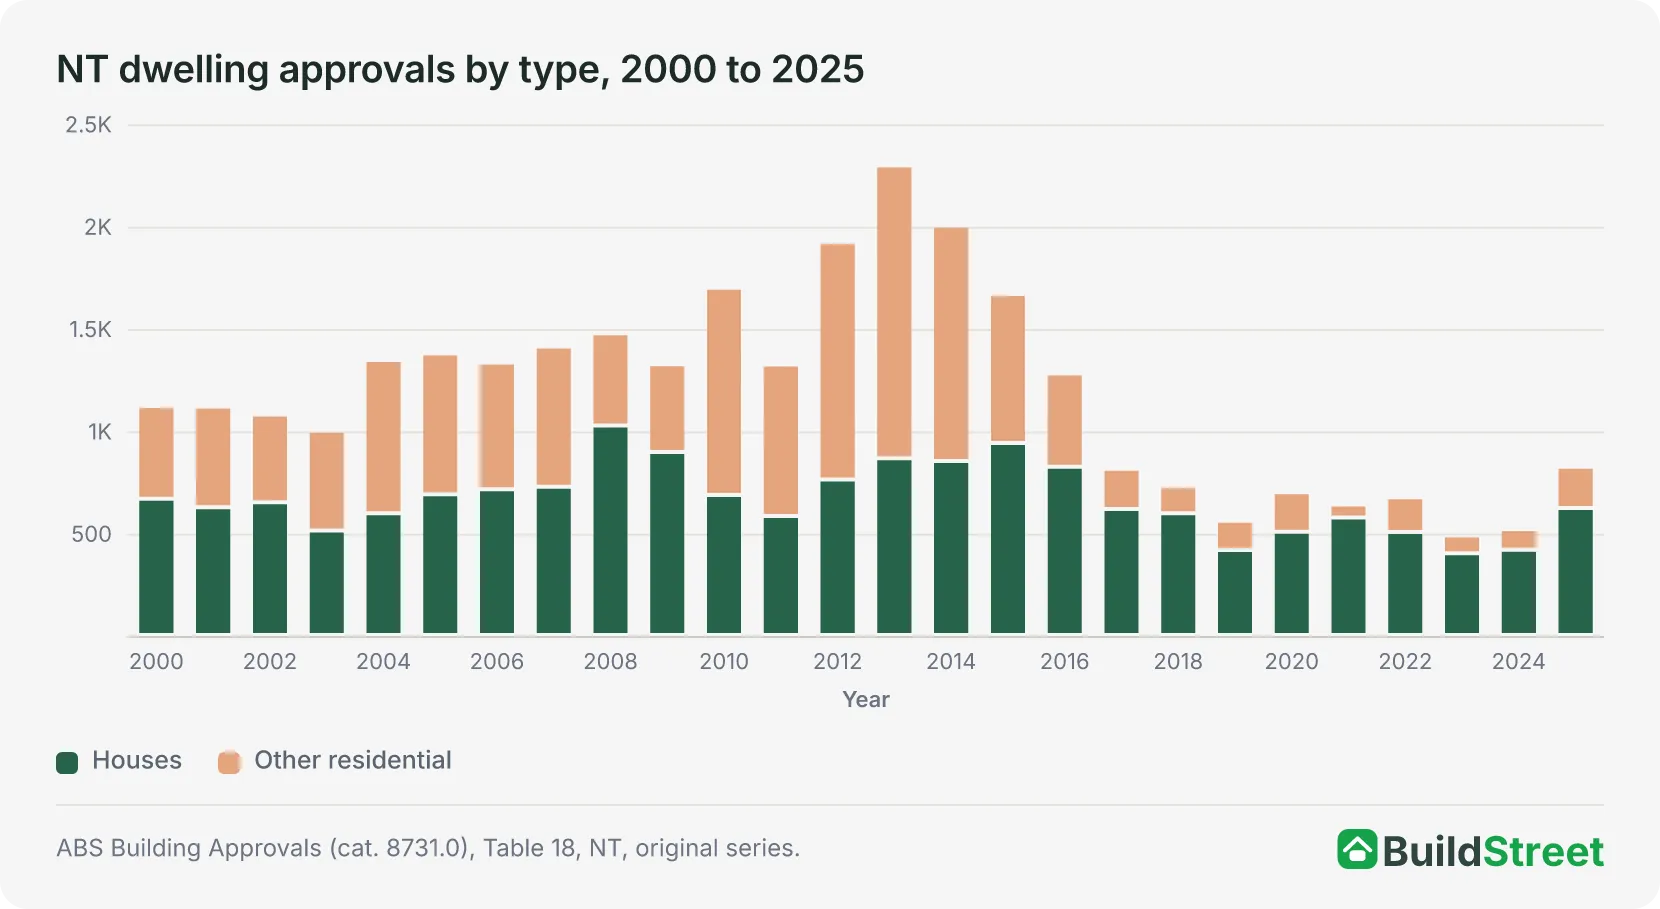
Northern Territory dwelling approvals reached 823 in 2025, up 59% from 518 in 2024 and 69% above the 2023 low of 4861. Despite the recovery in approvals, dwelling completions remained weak. The NT completed 521 dwellings in 2024–25, down 78% from the 2014–15 peak of 2,3852.
Darwin accounts for most residential building activity in the Territory, but NT housing supply data is affected by factors that are less prominent in larger states. These include remote community housing programmes, a relatively high public sector share of housing approvals, and population growth that combines overseas migration gains with net losses to other states.
 Is Australia on track to build 1.2 million homes by June 2029?Australia has completed 307,635 homes in the first seven quarters of the National Housing Accord, leaving the country 112,365 homes behind the pace needed to reach 1.2 million by June 2029. Australia…
 Can Victoria meet its housing target? Approvals, completions and supply gapsVictoria completed 56,383 dwellings in 2024–25, the lowest annual total in a decade and about 4,800 below the 61,200 a year needed to meet its Housing Accord share. Since the Accord began in July 2024…
Government housing accounts for a large share of NT approvals
Public sector projects made up about 35% of NT house approvals in FY2024–25, well above the 10% to 25% range recorded in most earlier years. This reflects the Territory's use of government-funded housing programmes, particularly in remote communities. The share rose from 2023 before easing to 23% in FY2025–26.
The 2008 spike was government-driven, but the 2010 to 2013 boom was mostly private
December 2008 recorded 436 new residential dwelling approvals in a single month, with most coming from the public sector. The monthly spike reflected Commonwealth remote housing investment. The strong years that followed, from 2010 to 2013, were driven mainly by private sector construction, with the public sector making up 5% to 22% of annual approvals.
Section 01 · What is being built
What types of homes are being approved in the NT?
NT dwelling approvals reached 823 in 2025, up 59% from 518 the year before and the strongest annual total since 2016. That recovery is real, but approvals are still 64% below the 2013 peak of 2,294, a year that reflected major Commonwealth investment in remote and urban housing.
Houses make up the clear majority of what gets built. In 2025–26, 72.4% of new residential dwelling approvals were for detached houses, with 610 houses out of 843 dwellings in the ABS dwelling-type breakdown. Townhouses and semi-detached dwellings accounted for 24.4%, while apartments accounted for 3.2%.
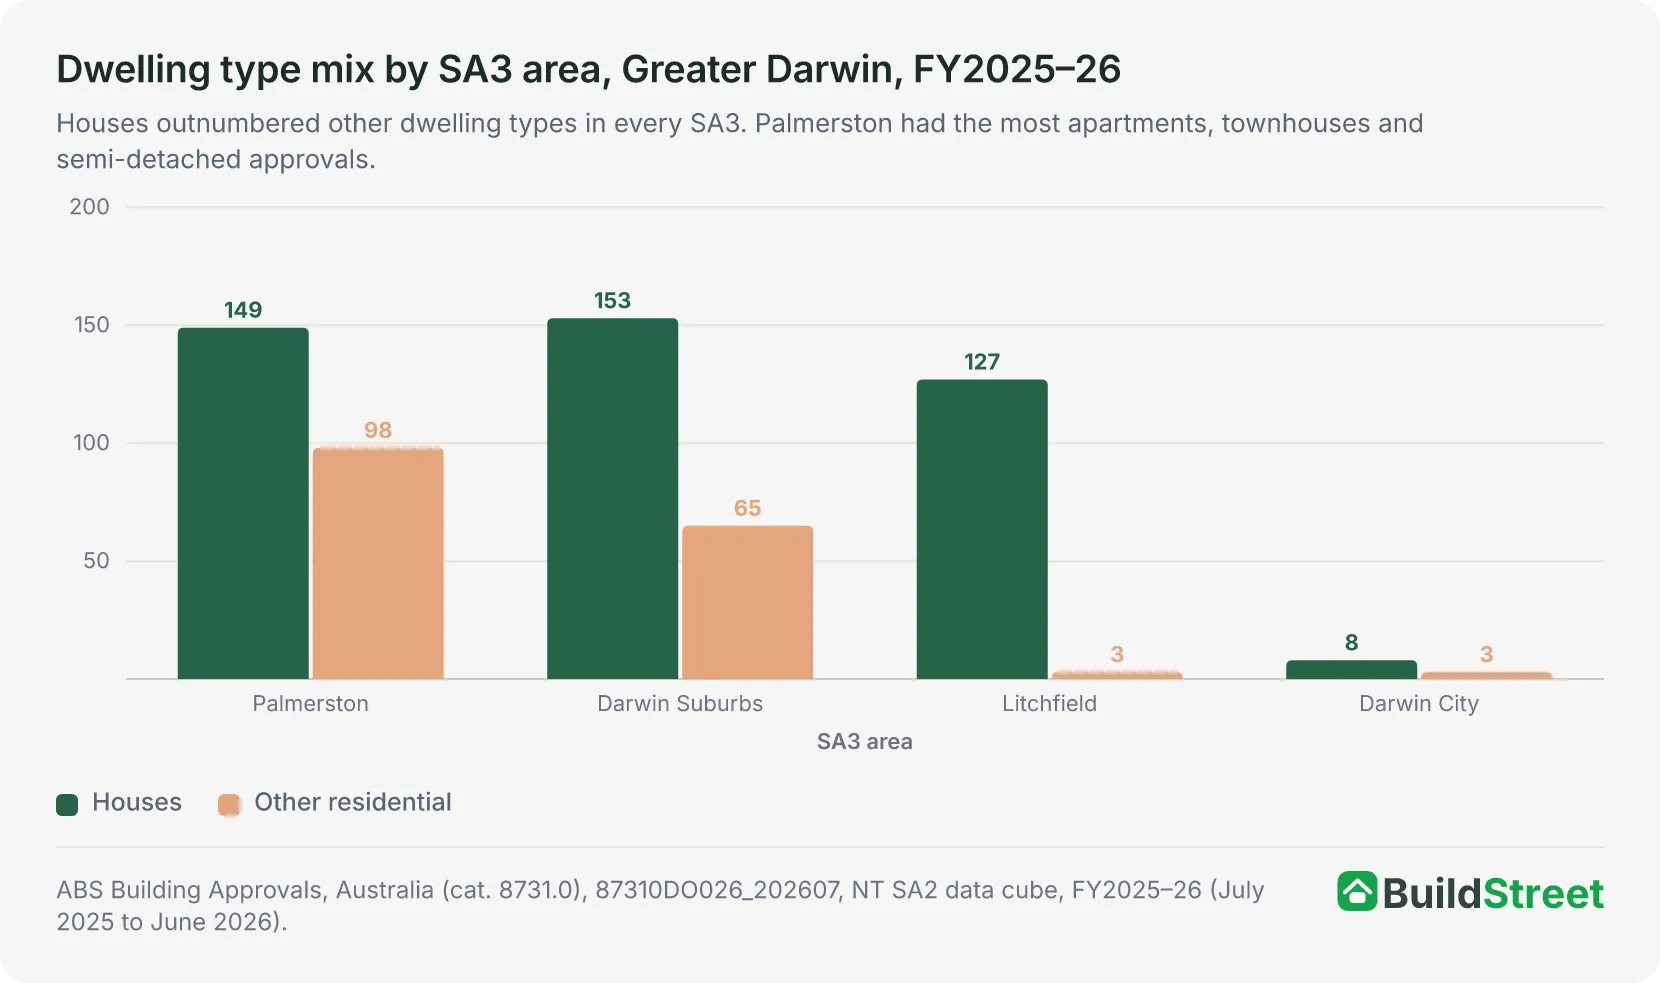
Higher-density activity was concentrated in Palmerston and Berrimah: Palmerston South had 69 apartment, townhouse and semi-detached approvals, Berrimah 47 and Rosebery–Bellamack 20. Darwin City recorded just 3 in 2025–26, as did Litchfield, all in Humpty Doo.
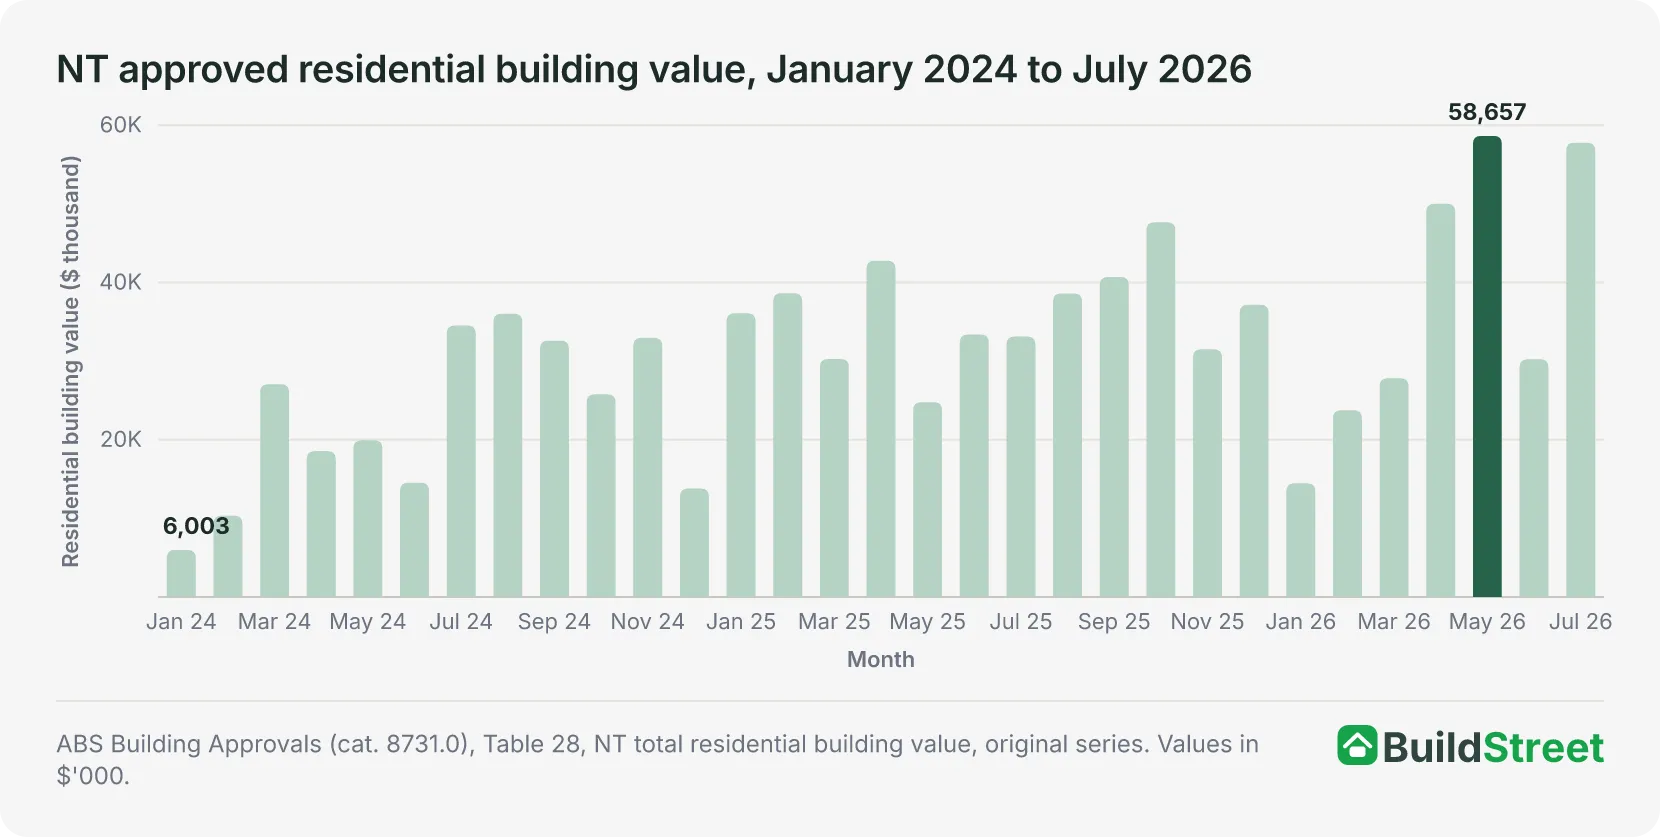
Approved residential values totalled $381.8 million for 2024–25 and $433.8 million for 2025–26. May 2026 alone recorded $58.7 million, the highest monthly figure since March 2021, and coincided with 120 total dwelling approvals, the strongest monthly count since March 2021. Together, these figures show that the approval pipeline strengthened through the first half of 2026.
NT new residential approvals by dwelling type, FY2025–26
- Houses72.4%
- Townhouses24.4%
- Apartments3.2%
— Total new residential approvals: 100%
Section 02 · Housing targets
NT housing targets: how far behind is the Territory?
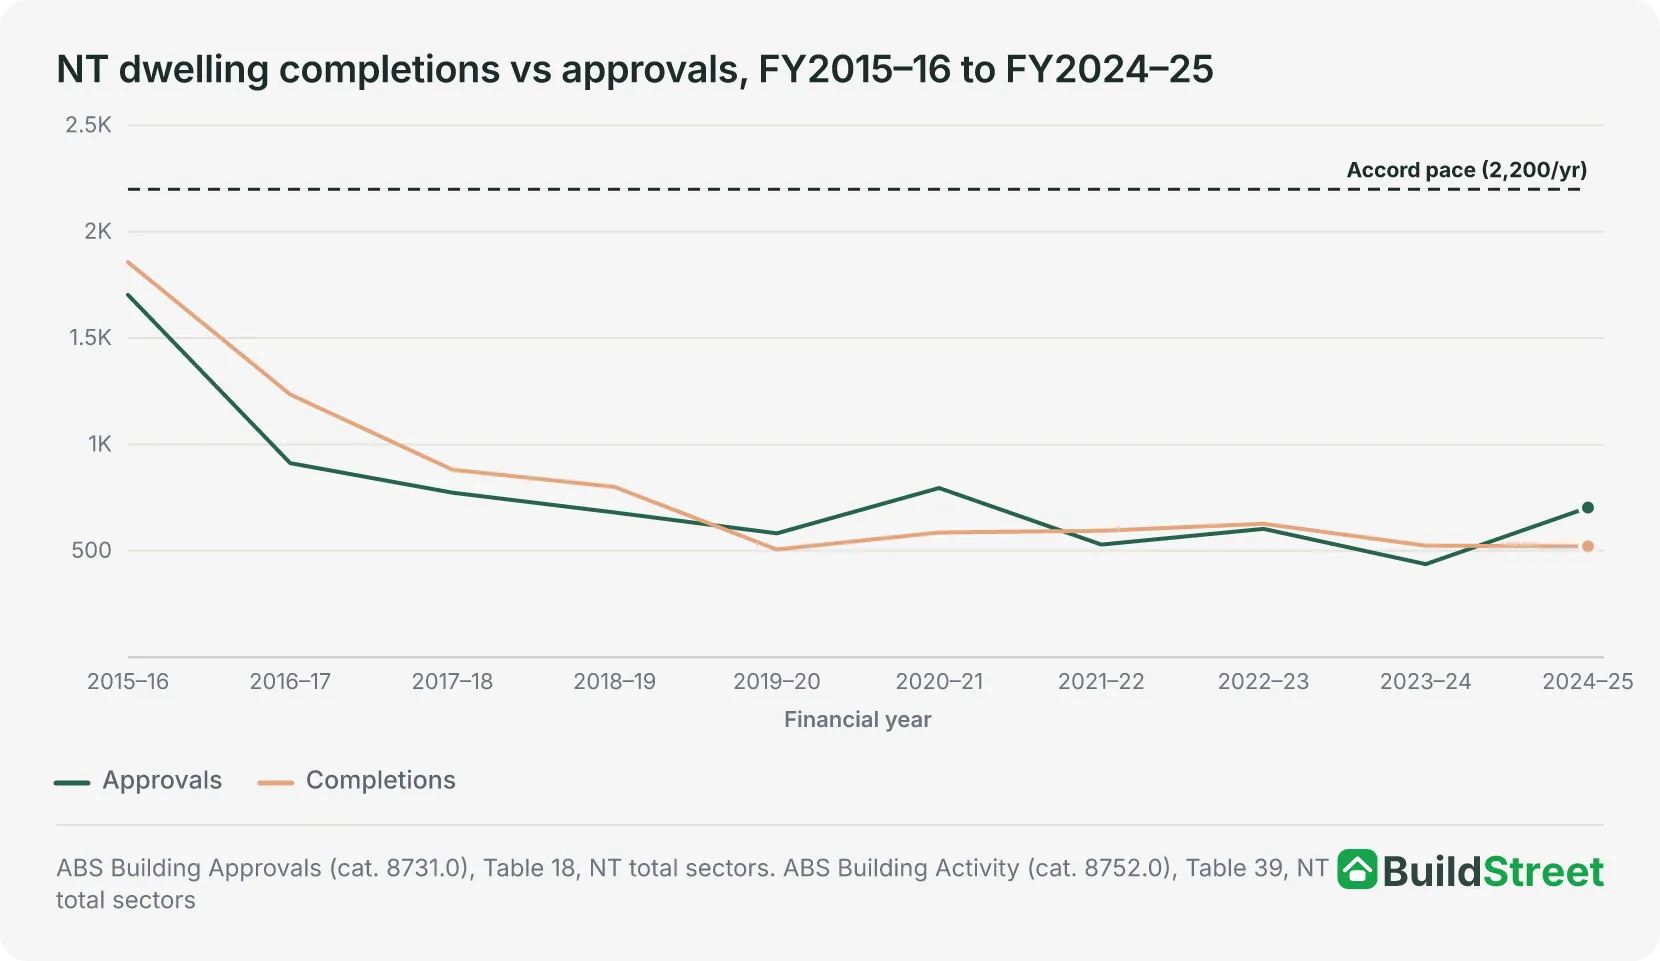
The NT completed 521 dwellings in 2024–25, equal to roughly 24% of the 2,200 homes per year required to meet its National Housing Accord share of 11,000 homes by June 20293. NT dwelling approvals reached 703 in 2024–25, but approvals do not always convert to completions within the same period.
On the current NHSAC outlook, the NT is expected to deliver around 4,000 homes across the five Accord years, equal to about 34% of its target3. It is not projected to meet its share before 2034, which is the latest estimated completion date of any state or territory in the outlook.
The Territory's small housing market makes annual figures more volatile than in larger states. In a small market, large public housing projects can have a noticeable effect on annual approval totals. The 2025 approvals recovery included a larger public sector component than most recent years, but that share may vary from year to year.
NT Housing Accord progress
Annual dwelling approvals against the 2,200 homes a year needed to meet the NT's Accord share of 11,000 homes by June 2029.
- 2024–25703
— Target pace per year: 2,200
Section 03 · Approvals vs completions
The gap between NT approvals and completions
NT dwelling completions fell from 1,857 in 2015–16 to 521 in 2024–25, a drop of 72% over nine years. Over the same period, annual dwelling approvals also declined, although they recovered from 437 in 2023–24 to 703 in 2024–25. That left a one-year gap of 182 dwellings between approvals and completions in 2024–25.
The gap partly reflects the time between approval and completion. Labour availability, supply chains and the remoteness of some NT projects can affect delivery timelines. This means annual approvals and completions do not always move together, even when both measures refer to the same housing market.
Recent approval figures show an increase in the pipeline. Approvals over the 18 months to December 2025 reached 1,134, and the full 2025–26 total came to 847 approvals, the highest financial-year total since 2016–171.
- Completed in FY2014–15
- 2,385
- Peak in records from FY2014–15 to FY2024–25
- Completed in FY2024–25
- 521
- Second-lowest in the same period, after FY2019–20 (506)
- Change from peak
- −78%
- Decline in dwelling completions from the FY2014–15 peak to FY2024–25
Show table · Full NT housing activity table, FY2014–15 to FY2024–25 — approvals, commencements and completions.
| Financial year | Approvals | Approved res. value | Commencements | Houses completed | Other res. completed | Other building work | Total completions |
|---|---|---|---|---|---|---|---|
| 2014–15 ★ Peak | 1,814 | $557.3m | 2,003 | 882 | 1,482 | 20 | 2,385 |
| 2015–16 | 1,703 | $539.3m | 1,539 | 936 | 852 | 70 | 1,857 |
| 2016–17 | 912 | $307.8m | 1,074 | 760 | 456 | 20 | 1,235 |
| 2017–18 | 773 | $264.3m | 864 | 710 | 154 | 17 | 881 |
| 2018–19 | 680 | $243.9m | 650 | 542 | 242 | 16 | 800 |
| 2019–20 | 582 | $210.9m | 524 | 393 | 95 | 19 | 506 |
| 2020–21 | 795 | $304.2m | 909 | 454 | 108 | 21 | 586 |
| 2021–22 | 529 | $194.7m | 496 | 490 | 88 | 16 | 594 |
| 2022–23 | 603 | $271.9m | 604 | 432 | 126 | 68 | 627 |
| 2023–24 | 437 | $218.5m | 466 | 454 | 63 | 7 | 524 |
| 2024–25 | 703 | $381.8m | 620 | 445 | 75 | 1 | 521 |
Source · ABS Building Approvals; ABS Building Activity.
Section 04 · Where housing is being built
Where is new housing being built in Darwin?
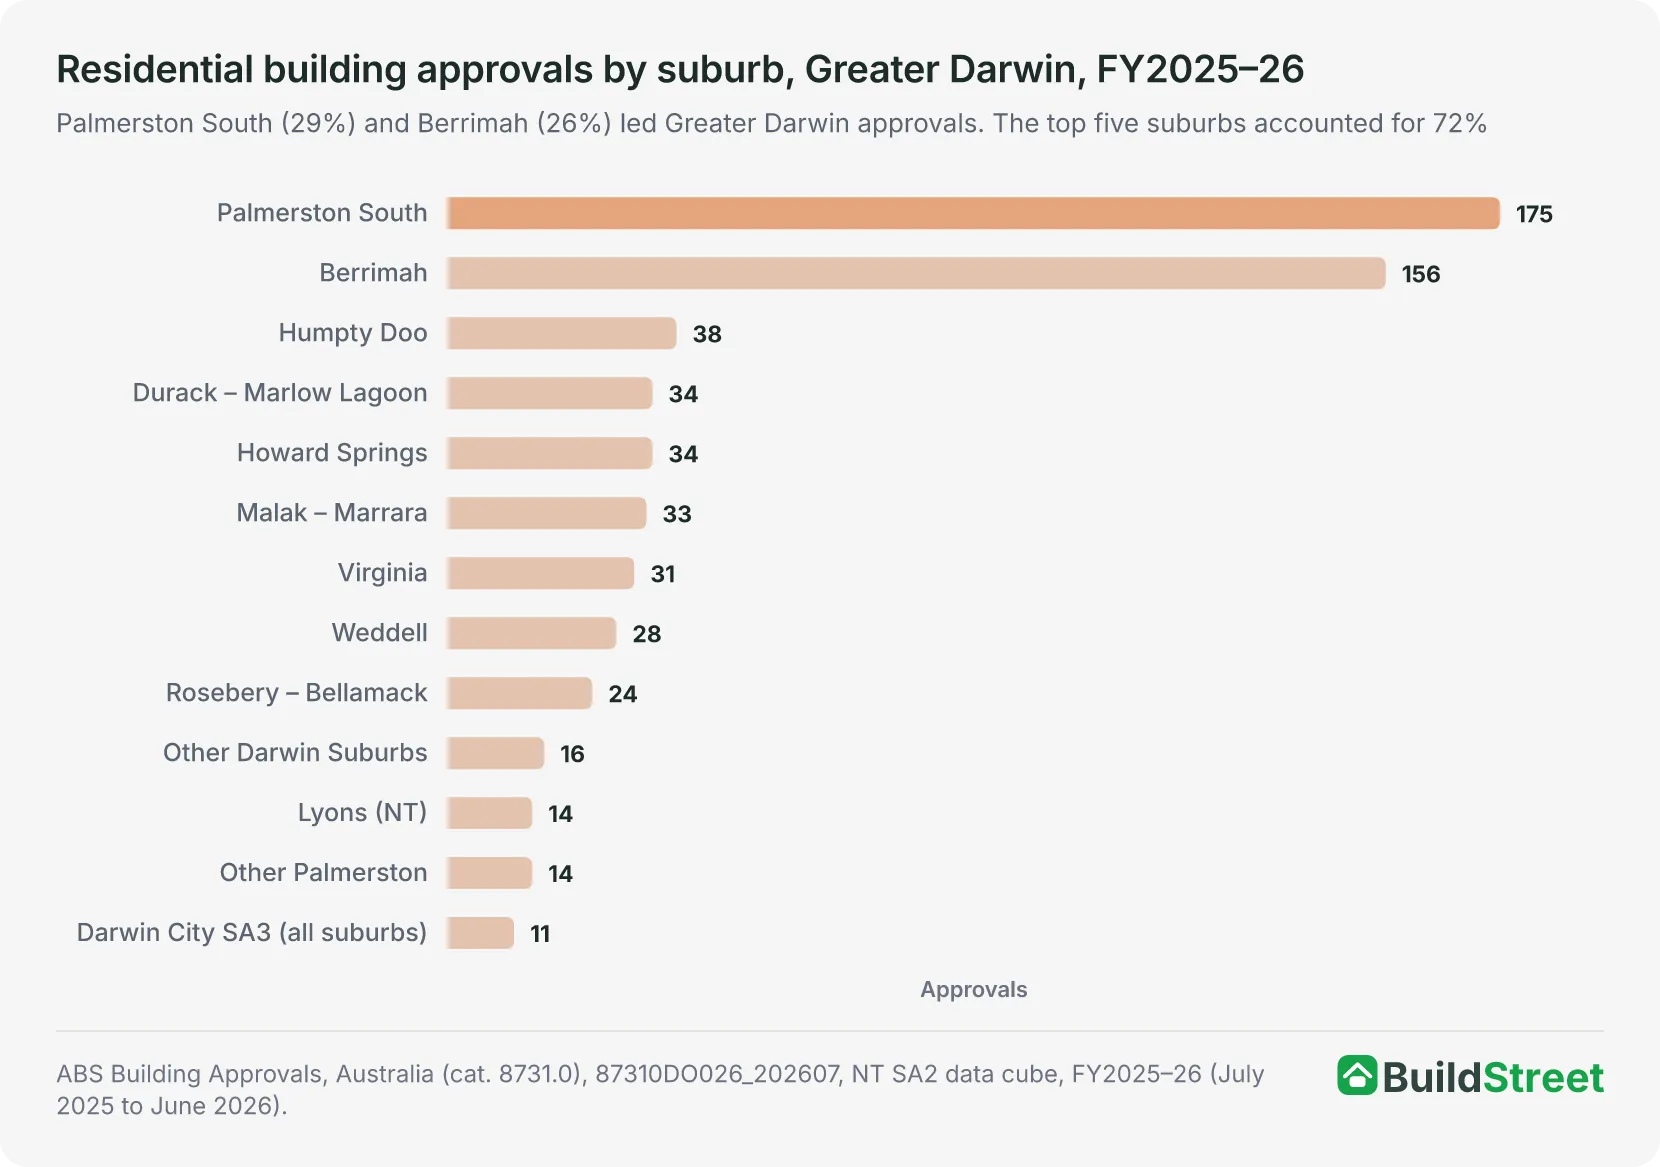
Greater Darwin accounted for 72% of all NT dwelling approvals in 2025–26, with 608 of 847. Construction activity is concentrated in two areas: Palmerston's southern growth corridor and a handful of outer Darwin suburbs undergoing subdivision or medium-density infill.
Palmerston recorded 247 approvals, representing 41% of the Greater Darwin total. Palmerston South alone drove 175 of those (29% of all Greater Darwin approvals), with an approved residential value of $82.2 million, second only to Berrimah's $83.2 million. The suburb added 344 residents in 2024–254, among the strongest growth figures in the city.
In the Darwin Suburbs SA3, Berrimah dominated with 156 approvals, or 71% of that SA3's total of 219. Most were detached houses (109) linked to the Berrimah Farm residential development, with Malak–Marrara the next most active suburb at 33.
Litchfield recorded 131 approvals, almost all detached houses (127), spread across Humpty Doo (38), Howard Springs (34), Virginia (31) and Weddell (28). Darwin City SA3 had the fewest approvals at 11, down from 41 in 2024–25, and only 3 were apartments, townhouses or semi-detached homes; Darwin City suburb itself recorded none.
Outside Greater Darwin, 239 approvals were recorded across five regions: Alice Springs (69), Katherine (67), East Arnhem (59), Daly–Tiwi–West Arnhem (38) and Barkly (6). Public sector housing programmes account for a large share of approval activity in these areas.
| NT population distribution and growth, 2024–25 | |||
|---|---|---|---|
| Measure | Total | Greater Darwin | Rest of NT |
| Total NT population (June 2025) | 264,556 | approx. 159,300 (60.2%) | approx. 105,300 (39.8%) |
| NT population growth 2024–25 | +3,672 | +2,719 (approx. 74%) | +953 (approx. 26%) |
Source · ABS Regional Population 2024–25 (cat. 3218.0), Table 7, NT SA2 level data. Greater Darwin figure sums Darwin City, Darwin Suburbs, Litchfield, and Palmerston SA3 areas.
Dwelling type varies significantly by area
The type of housing approved varied significantly by area. Litchfield remained almost entirely detached housing, with just 3 non-house approvals, all in Humpty Doo. Darwin Suburbs SA3 was 70% houses, with Berrimah (156 approvals, 109 of them houses) and Malak–Marrara (33, 23 of them houses) driving the numbers. Palmerston was 60% houses, with non-house approvals concentrated in Palmerston South (69) and Rosebery–Bellamack (20). Darwin City SA3, the medium-density exception in 2024–25, recorded just 11 approvals in 2025–26, 3 of them non-house, all in Parap. Medium-density activity shifted to Palmerston and Berrimah in 2025–26.
Section 05 · Remote housing
Remote housing: why supply works differently outside Darwin
The public sector accounted for 30% of NT house approvals in 2024, rising to 33% in 2025, the highest sustained share since the 2008 to 2010 stimulus period. A significant share of the NT population lives outside Greater Darwin and Alice Springs. In those areas, new housing activity is more likely to involve public sector housing than private sector construction.
Remote housing faces structural constraints that do not apply in the same way in urban Darwin. Land tenure in remote communities is often held under the Aboriginal Land Rights Act or subject to long-term government leasing, which can limit conventional market financing. Distance from Darwin, limited local trades capacity and high logistics costs can extend construction timelines compared with similar projects in larger urban markets.
Residential approvals outside Greater Darwin, 2025–26
The 239 dwelling approvals recorded outside Greater Darwin in 2025–26 were spread across five regions. Alice Springs recorded the most, with 69, including 18 non-house approvals. Katherine followed with 67, including 31 houses in Katherine township and 18 approvals in the Gulf area. East Arnhem rose to 59 from 12 the year before, led by Nhulunbuy (27), East Arnhem (19) and Anindilyakwa (13). Daly–Tiwi–West Arnhem recorded 38, while Barkly fell to 6 from 40 in 2024–25.
| Region (SA3) | Key areas | Houses | Other res. | Total | Res. value |
|---|---|---|---|---|---|
| Alice Springs | Alice Springs town (31), surrounding remote areas (38) | 49 | 18 | 69 | $50.6m |
| Katherine | Katherine township (31), Gulf (18), Victoria River (13), Elsey (5) | 61 | 6 | 67 | $38.7m |
| East Arnhem | Nhulunbuy (27), East Arnhem (19), Anindilyakwa (13) | 34 | 25 | 59 | $38.6m |
| Daly – Tiwi – West Arnhem | West Arnhem (19), Alligator (7), Thamarrurr (7), Daly (5) | 23 | 15 | 38 | $28.8m |
| Barkly | Barkly region (3), Tennant Creek (3) | 6 | 0 | 6 | $9.3m |
| Rest of NT total | 173 | 64 | 239 | $166.0m |
Source · ABS Building Approvals, Australia (cat. 8731.0), 87310DO026_202607, NT SA2 data cube, FY2025–26.
Section 06 · Greenfield, infill and infrastructure
Greenfield growth accounts for most Greater Darwin approvals
Outer growth areas accounted for 76% of all Greater Darwin dwelling approvals in 2025–26, with 462 of 608 approvals. Palmerston South and the four main Litchfield suburbs, Humpty Doo, Howard Springs, Virginia and Weddell, together accounted for 306 approvals, or 50% of the Greater Darwin total. Berrimah also contributed to outer-area activity, with 156 approvals from subdivision-style development on former rural land. Berrimah recorded $83.2 million in approved residential value, the highest of any Darwin suburb, just ahead of Palmerston South at $82.2 million.
Medium-density approvals, including apartments, townhouses and semi-detached dwellings, made up 28% of Greater Darwin dwelling approvals in 2025–26. Unlike the year before, most of this activity was outside Darwin City: Palmerston South (69), Berrimah (47) and Rosebery–Bellamack (20) led, while Darwin City SA3 recorded just 3. The established middle-ring suburbs of Karama, Malak–Marrara, Nightcliff, Coconut Grove and Jingili recorded 40 approvals between them, 33 of them in Malak–Marrara.
Infrastructure is a factor in growth corridor expansion. The Palmerston ring road and associated transport works have supported development in the satellite city, while water, sewerage and power networks in outer areas need to expand alongside population growth. In a small market, infrastructure delivery can have a larger effect on where new housing is approved.
Section 07 · State comparison
NT housing supply compared with other states and territories
The NT delivered 142 completed dwellings per 1,000 new residents in 2024–25, the lowest ratio of any mainland state. By comparison, Western Australia recorded 340, Victoria 459 and NSW 425 over the same period. In raw volume, NT completions of 521 sit alongside WA's 22,516 and Victoria's 56,383. This reflects the Territory's small population base and lower completion levels after a decade of decline.
That ratio needs qualification. A large share of NT population growth came from overseas migration concentrated in Darwin, while net internal migration was negative, meaning more residents left for other states than arrived from them. This means the completions-per-new-resident ratio should be read alongside migration patterns, not as a standalone measure of housing pressure.
Section 08 · Demand drivers
What is driving new housing demand in the NT?
NT population grew by 3,672 in 2024–25, but the composition of that growth is important. Net overseas migration added 3,753 people, natural increase contributed 2,024, and net internal migration subtracted 2,105 residents4. This mix means NT housing demand cannot be read from the headline population growth figure alone.
Overseas migration was the largest contributor to NT population growth
Net overseas migration of 3,753 was the largest single contributor to NT population growth in 2024–25, more than offsetting the internal migration loss. Because most private sector construction is concentrated in Greater Darwin, overseas migration can affect housing demand differently from natural increase or internal migration.
Net internal migration remained negative
The NT lost a net 2,105 residents to other states in 2024–25. The pattern varied across Greater Darwin. Karama lost 167 residents through internal migration, Malak–Marrara lost 111, and Coconut Grove lost 111. Palmerston South gained 111 residents, and Berrimah gained 4794, both areas with newer or expanding housing stock. This shows that internal migration patterns differ by suburb, rather than moving evenly across the Territory.
Employment sectors support Darwin housing demand
The 59% rise in approvals from 2024 to 2025 coincided with several factors, including deferred construction activity, renewed public sector housing programmes and higher approved residential values. The data does not isolate how much each factor contributed to the increase.
Darwin's demand base is supported by Defence, federal government employment, the oil and gas sector, and NT government employment. These sectors form part of the city's employment base, but the approval data does not show their direct effect on housing demand.
References
- ABS Building Approvals, Australia, July 2026 — Table 18 (dwelling units approved by sector, original, Northern Territory) · Australian Bureau of Statistics ↑ b
- ABS Building Activity, Australia, March 2026 — Table 38 (dwelling unit completions by sector, states and territories, original) · Australian Bureau of Statistics ↑
- NHSAC State of the Housing System 2026 · nhsac.gov.au ↑ b
- ABS Regional population, 2024-25: population estimates and components by SA2, 2024 to 2025 (datacube 32180DS0001) · Australian Bureau of Statistics ↑ b c
- ABS Building Approvals, Australia (latest release, Cat. 8731.0) · Australian Bureau of Statistics
- ABS, Building Activity, Australia (latest release, Cat. 8752.0) · Australian Bureau of Statistics
- ABS: Regional Population, 2024–25 · Australian Bureau of Statistics
