

Published 23 June 2026 · Updated 29 Sept 2026
 Is Australia on track to build 1.2 million homes by June 2029?Australia has completed 307,635 homes in the first seven quarters of the National Housing Accord, leaving the country 112,365 homes behind the pace needed to reach 1.2 million by June 2029. Australia…
 How long does it take to build a house in Australia?The average time from approval to handover is now about 11.5 months for a house, 14.8 months for a townhouse and almost 33 months for an apartment in Australia. While homes still take much longer to b…
Section 01 · The housing target
The housing target: how far behind is Tasmania?
Tasmania needs to complete 5,200 homes a year for five straight years to meet its Accord share. The state has not reached that pace in any recent financial year. Even at the peak of the HomeBuilder boom, Tasmania approved 4,292 dwellings in 2020-21 and completed 3,582 dwellings in 2021-22. The Accord pace is about 45% higher than Tasmania’s strongest recent completion year and more than double its 2024-25 completion rate.
Tasmania Housing Accord progress
Annual dwelling approvals against the 5,200-a-year pace needed to reach 26,000 homes by June 2029.
- 2024-252,341
- 2025-262,735
— Target pace per year: 5,200
How Tasmania compares with other states
Every jurisdiction is behind the Accord pace, but Tasmania and the Northern Territory are the only ones projected to finish more than four years late. Victoria, Western Australia and the ACT are projected to finish in December 2029, two quarters after the deadline.1 Across most progress measures, Tasmania and the Northern Territory sit near the bottom of the national table.
| State / territory | 5-yr target | Annual target | FY24-25 completions | % of annual target |
|---|---|---|---|---|
| New South Wales | 376,000 | 75,200 | 42,724 | 57% |
| Victoria | 306,000 | 61,200 | 56,383 | 92% |
| Queensland | 246,000 | 49,200 | 33,880 | 69% |
| South Australia | 84,000 | 16,800 | 12,870 | 77% |
| Western Australia | 129,000 | 25,800 | 22,516 | 87% |
| Tasmania | 26,000 | 5,200 | 2,499 | 48% |
| Northern Territory | 11,000 | 2,200 | 521 | 24% |
| ACT | 21,000 | 4,200 | 4,116 | 98% |
| Australia | 1,200,000 | 240,000 | 175,511 | 73% |
Source · NHSAC State of the Housing System 2026 (state targets); ABS Building Activity, Australia, March quarter 2026, Table 39. 5-year target apportioned by population share (Dec 2022 estimates), per NHSAC. FY24-25 completions = Sep 2024 to Jun 2025 quarters, all dwellings completed (including conversions and other dwellings created outside new residential building). State figures may not add to the Australian total because of ABS rounding.
Section 02 · Hobart vs other capitals
How Hobart compares with other capitals
Hobart approved 3.5 dwellings per 1,000 residents in 2024-25, the second-lowest rate of any Australian capital and less than half the rate recorded in Melbourne, Brisbane, Perth and Adelaide. Greater Hobart also grew by only 542 residents over the year, the slowest population growth of any capital city.2
Hobart’s approval rate changes depending on the population measure used. Measured per existing resident, only Darwin approved fewer dwellings per 1,000 people. Measured per new resident, Hobart recorded a higher ratio because its population growth was very low in 2024-25. This means approvals per existing resident and approvals per new resident show different parts of the housing supply picture.
| Capital city dwelling approvals, population and growth rates, 2024-25 | ||||
|---|---|---|---|---|
| Capital | Population (Jun 2025) | Pop. growth 2024-25 | Dwelling approvals 2024-25 | Approvals per 1,000 residents |
| Melbourne | 5,435,590 | +105,030 | 46,530 | 8.6 |
| Sydney | 5,638,830 | +75,230 | 33,573 | 6.0 |
| Brisbane | 2,833,524 | +58,223 | 21,588 | 7.6 |
| Perth | 2,452,765 | +58,088 | 19,458 | 7.9 |
| Adelaide | 1,491,015 | +18,647 | 11,837 | 7.9 |
| Canberra | 484,630 | +6,200 | 2,831 | 5.8 |
| Darwin | 159,284 | +2,719 | 364 | 2.3 |
| Hobart | 255,250 | +542 | 885 | 3.5 |
Source · ABS Regional Population 2024-25 (cat. 3218.0), released 31 March 2026; ABS Building Approvals (cat. 8731.0), Table 10, 2024-25.
Hobart’s low population growth changes how approval rates are read
Per existing resident, Melbourne, Brisbane, Perth and Adelaide all approved more than twice as many dwellings as Hobart in 2024-25. Sydney approved 6.0 dwellings per 1,000 residents, about 72% higher than Hobart’s 3.5.
Per new resident, Hobart approved 1,633 dwellings for every 1,000 people added to the population, roughly 3.6 times the rate of Sydney, Melbourne and Canberra. This reflects Hobart’s very low population growth in 2024-25, rather than a direct measure of surplus housing supply. The Accord target of 26,000 was set using December 2022 population figures, before Greater Hobart’s 2024-25 population growth slowed to 542 people.
Section 03 · Approvals
Tasmania dwelling approvals remain below the Housing Accord pace
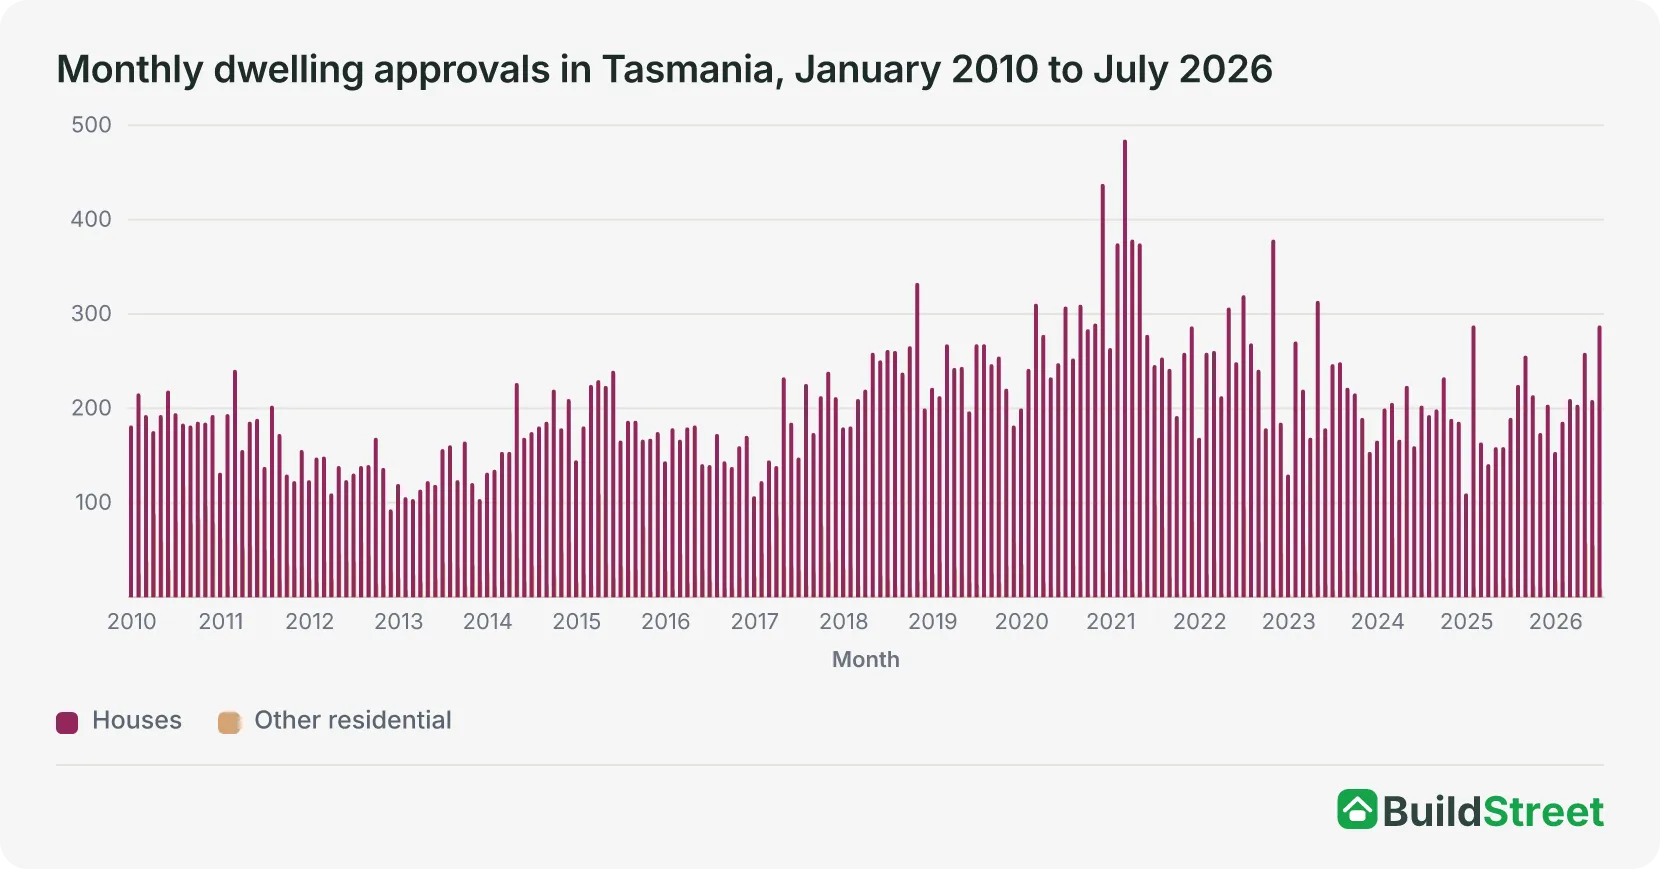
Tasmania approved 2,735 dwellings in 2025-26, equal to 53% of the 5,200 dwellings a year needed to match its Housing Accord target. That was up 17% on the 2,341 dwellings approved in 2024-25.
In the 12 months to June 2026, NHSAC measured Tasmania's approvals 17% higher than in the previous 12 months.1 That was faster than Western Australia, at 11%, New South Wales, at 6%, and South Australia, at 4%, but behind Queensland, at 23%, the Northern Territory, at 20%, and the ACT, at 42%.
Factors linked to Tasmania’s low approval numbers
Three factors help explain the approval trend:
- Approvals recovered to 2,735 in 2025-26, from 2,341 in 2024-25, which was the lowest total since 2016-17. Approvals rose quickly in 2020-21 during the HomeBuilder grant period, then declined as housing market and construction conditions changed.
- Tasmania’s new dwelling approvals remain heavily weighted toward detached houses. The General Residential Zone requires a minimum lot size of 450m² in most councils, which limits many forms of medium-density housing on existing residential land.
- The value of residential building work approved fell in real terms during 2024, alongside higher borrowing costs and weaker conditions for multi-unit projects.
Section 04 · Commencements & completions
Tasmania completed 2,499 dwellings in 2024-25
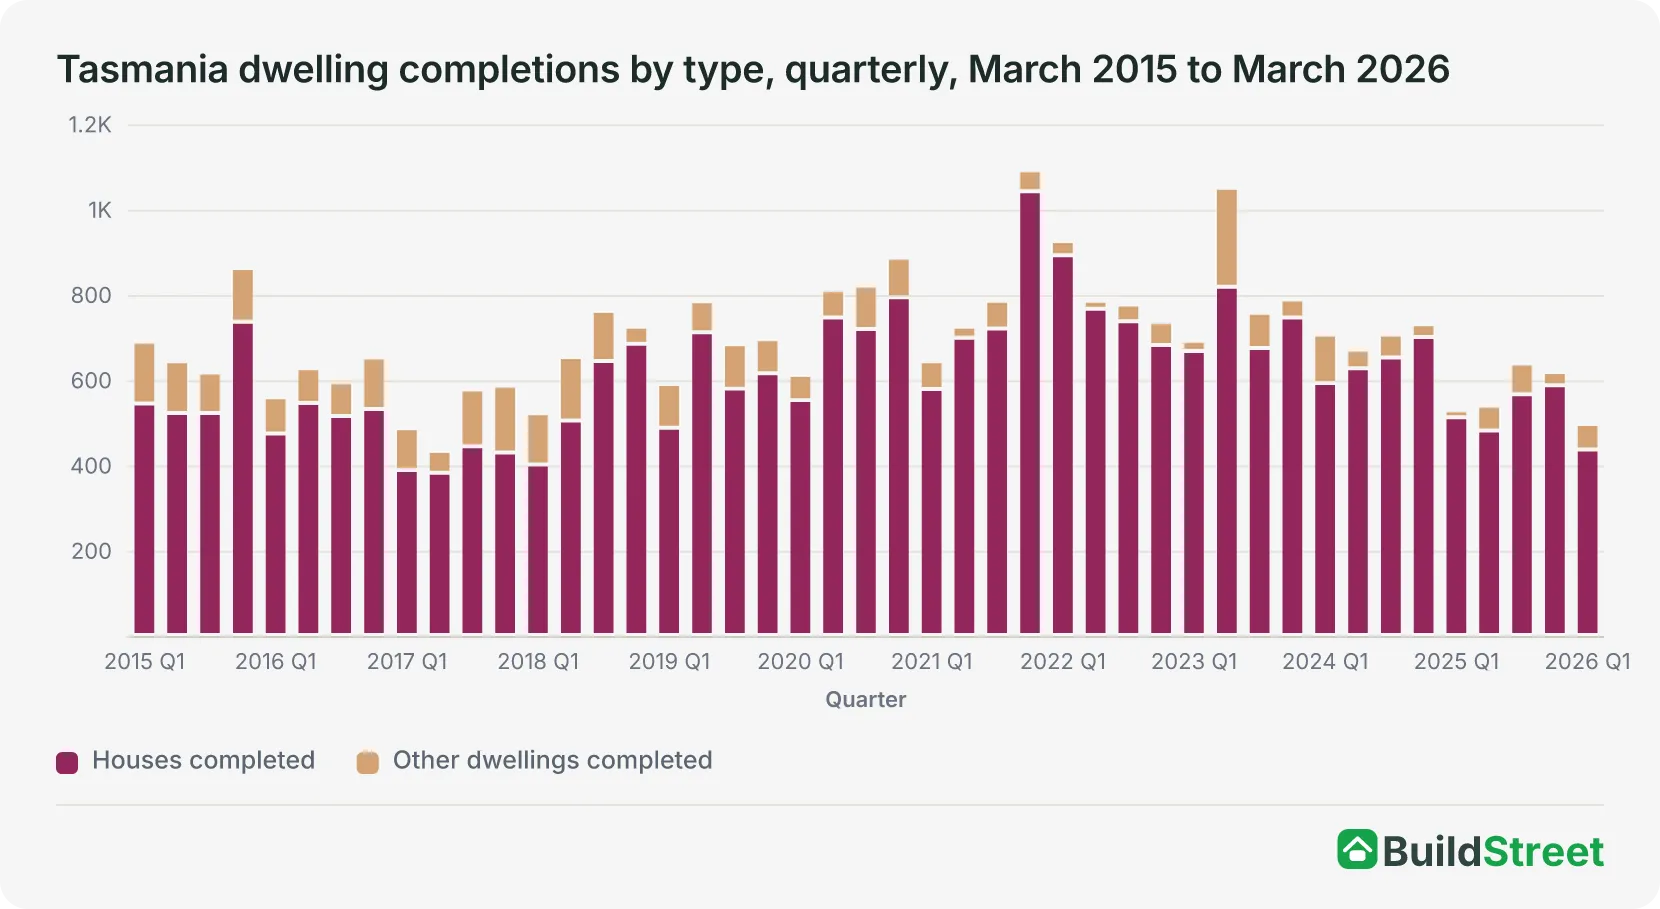
Tasmania completed 2,499 dwellings in 2024-25, its lowest annual result since 2017-18. That was down 30% from the post-HomeBuilder peak of 3,582 completions in 2021-22.
At that pace, the state was completing about 7 homes per day and 208 per month. To match its Housing Accord target, Tasmania would need to complete about 433 homes per month.
Approvals, commencements and completions were closely aligned in 2024-25, at 2,341, 2,397 and 2,499 dwellings respectively. This shows the pipeline was running at a similar volume across approvals, starts and finishes, but still well below the Accord pace.
Why completions matter for housing supply
Completions are the only pipeline measure that directly adds to housing stock. Approvals can lapse, and commencements can stall.
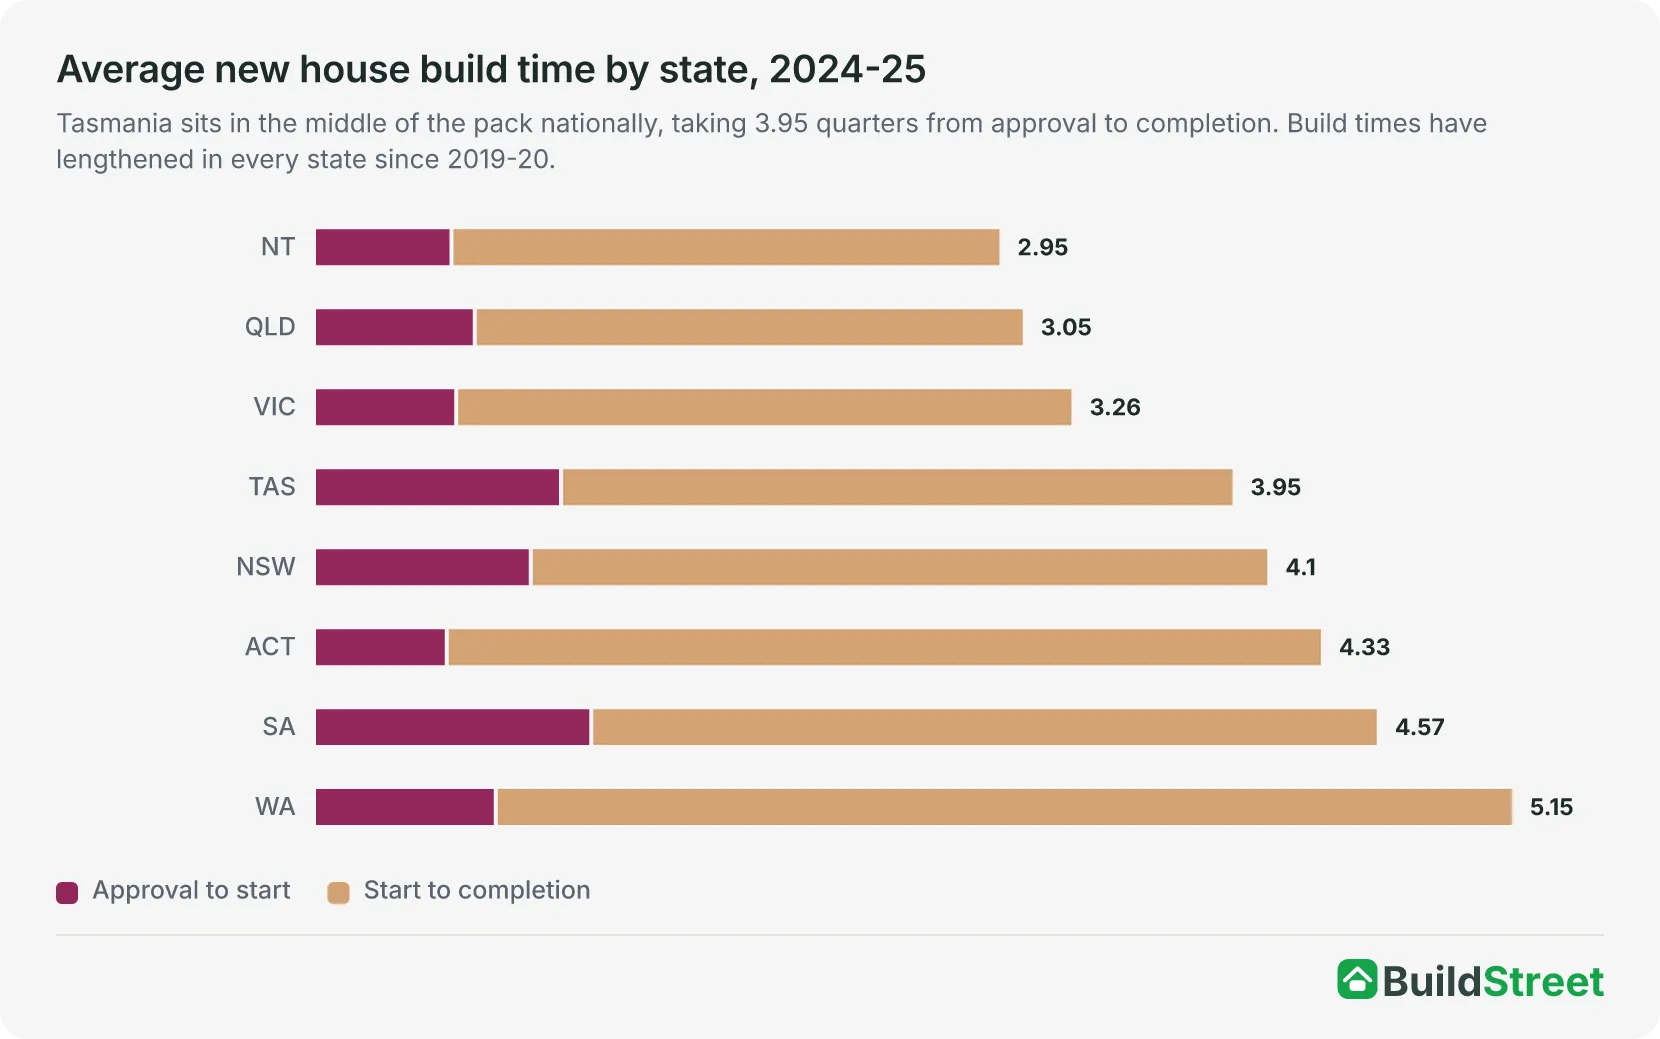
Rolling four-quarter completions fell 13% in the year to March 2026, even as approvals rose.1 This may reflect longer construction times, trade capacity constraints or earlier approvals that did not progress to completion.
Section 05 · Dwelling mix
Detached houses accounted for 91% of Tasmania’s new dwelling approvals
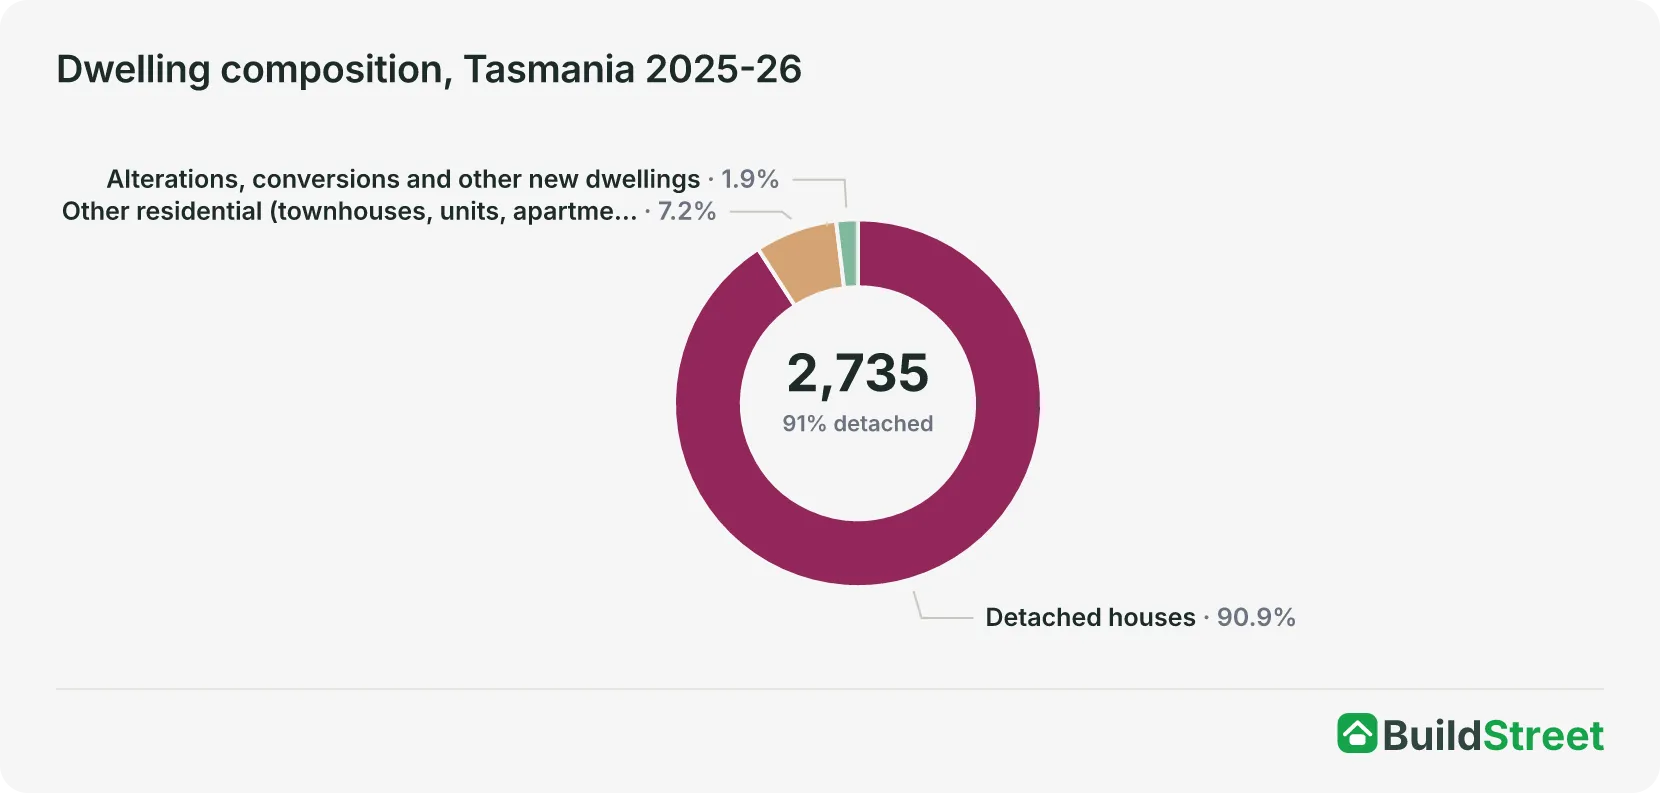
Detached houses accounted for 91% of Tasmania’s total dwelling approvals in 2025-26, the highest detached-house share of any state. Across the full financial year, Tasmania approved 2,485 detached houses and 198 other residential dwellings, along with 52 dwellings created through alterations, conversions and other building work. The detached share was down from 95% in 2024-25, as other residential approvals doubled.
How this compares with other states
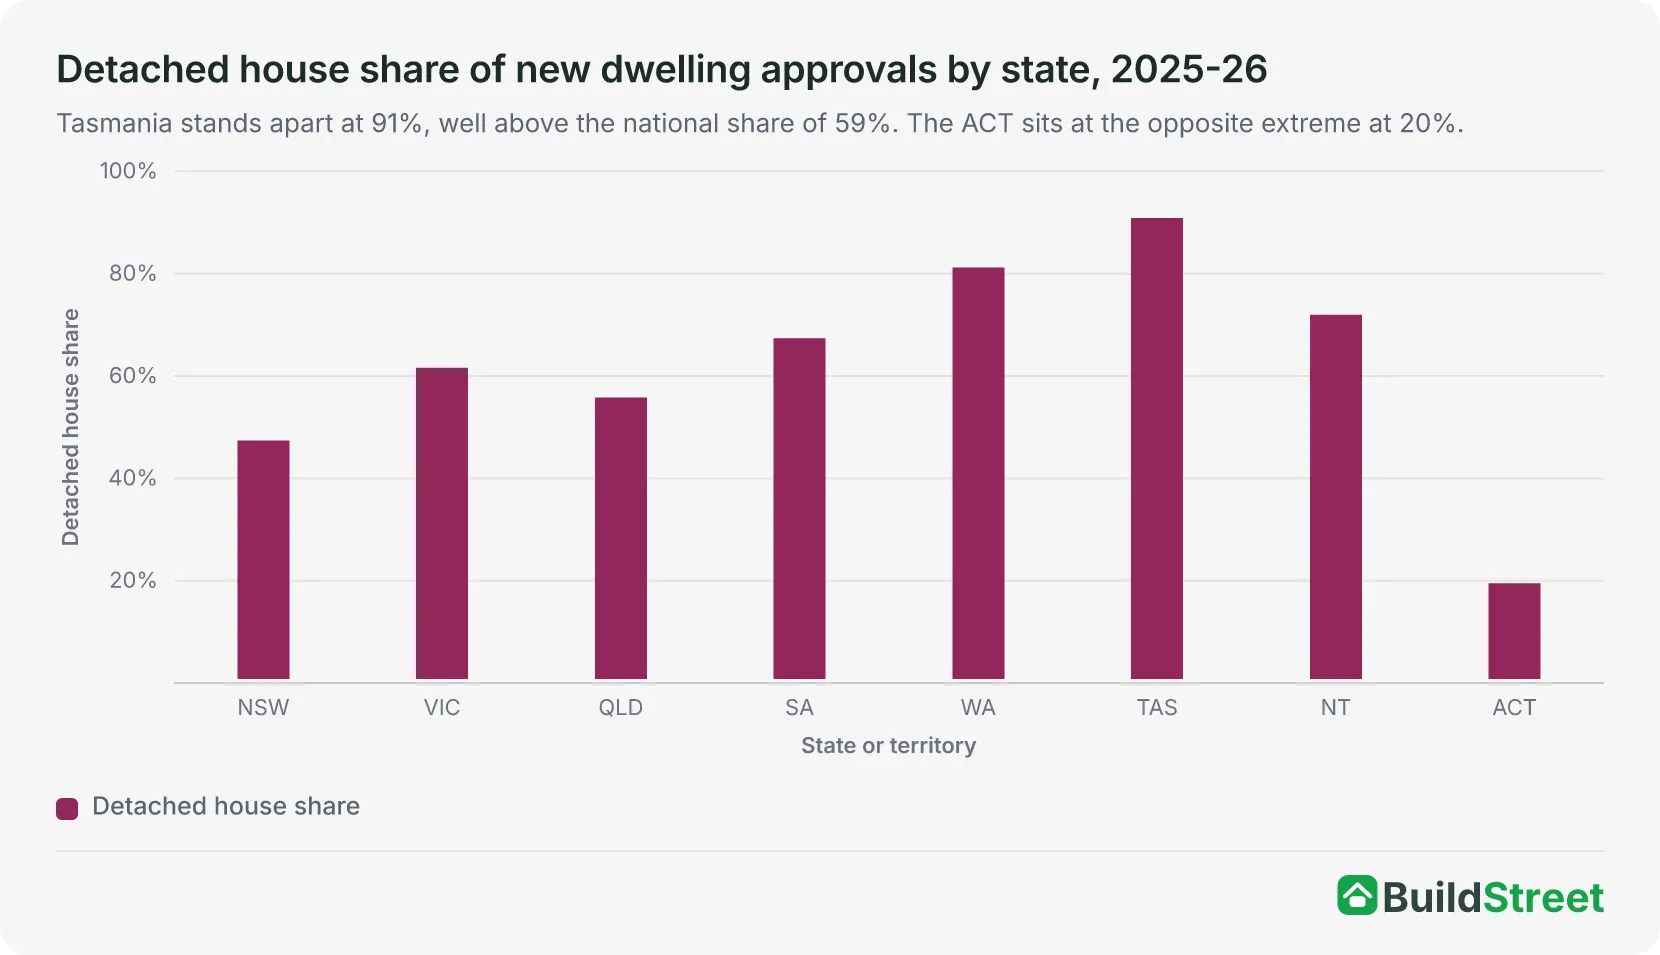
Tasmania is the most detached-house-heavy market in the country. In every other state and territory except Western Australia, attached housing makes up more than a quarter of new approvals. The ACT approves around four apartments or townhouses for every detached house. New South Wales approved more attached than detached dwellings in 2025-26. Only Western Australia (81%) comes within 15 percentage points of Tasmania’s 91%.
Section 06 · Hobart vs regional Tasmania
Most Tasmanian dwelling approvals are outside Greater Hobart
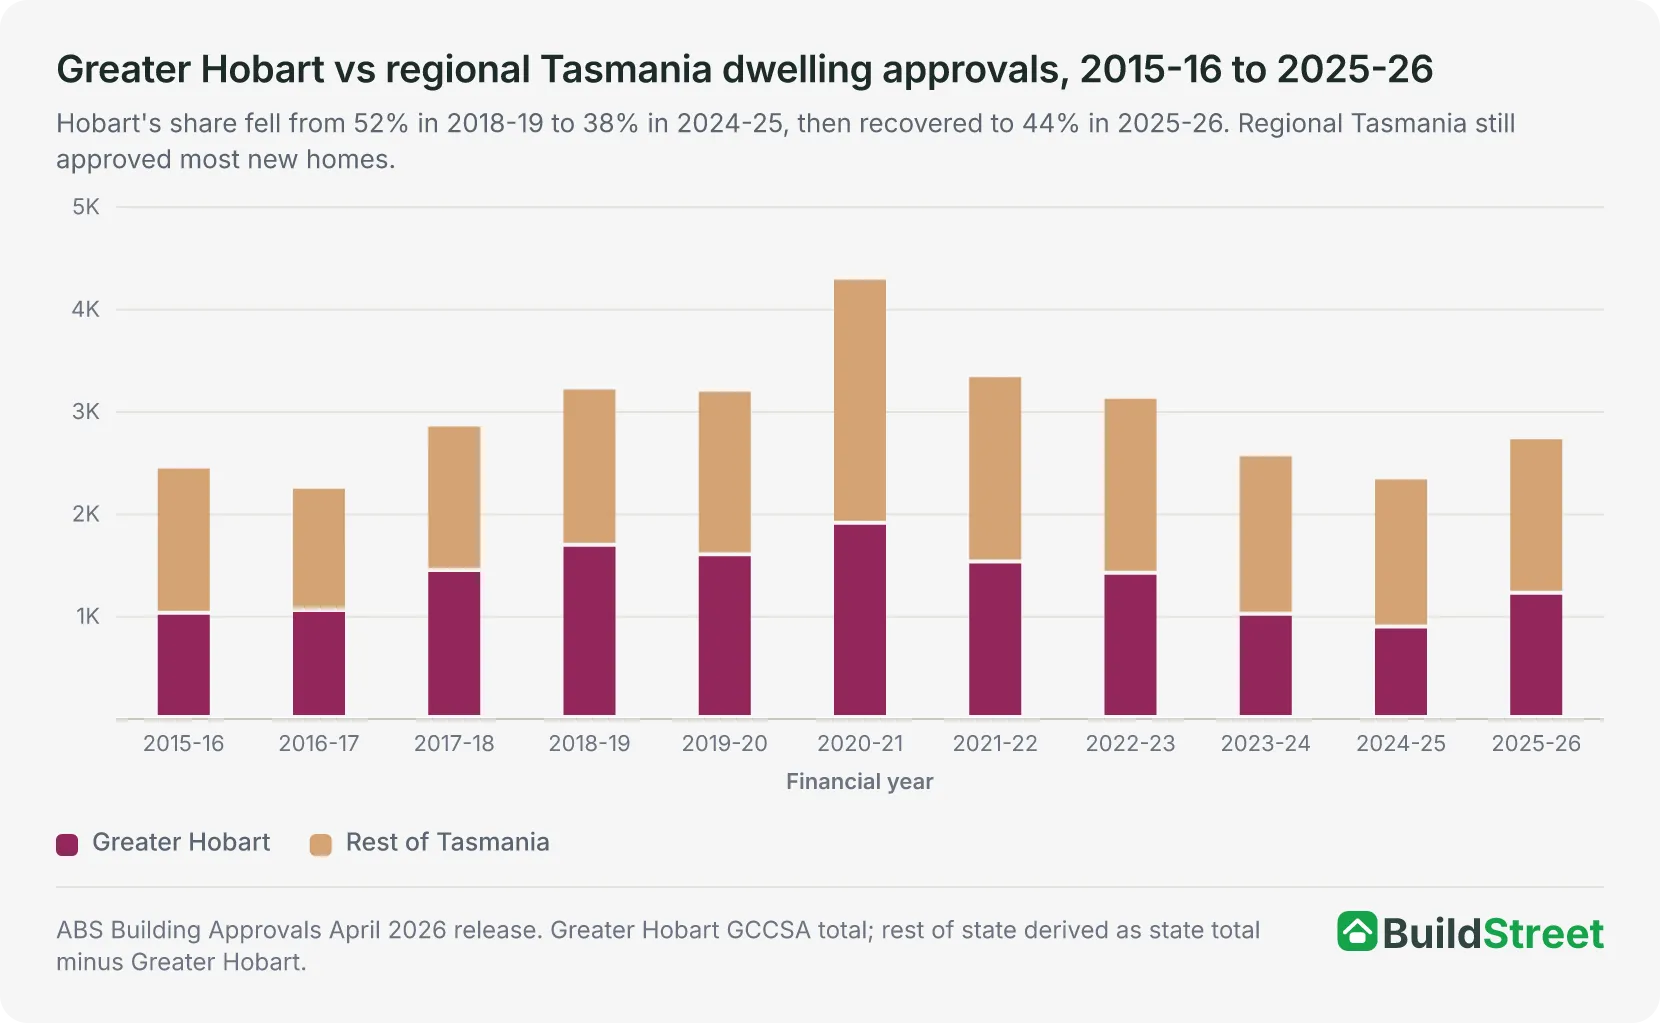
Only 44% of Tasmania’s dwelling approvals came from Greater Hobart in 2025-26. The remaining 56% were approved across regional Tasmania.
This is different from the pattern in many larger states, where capital cities account for most new housing approvals. In Tasmania, more homes were approved outside the capital than within it. Greater Hobart’s share fell from 52% in 2018-19 to 38% in 2024-25, before recovering to 44% in 2025-26.
Greater Hobart accounted for a larger share of Tasmania’s apartment-style supply. About 90% of the state’s other residential approvals came from Greater Hobart councils in 2025-26, even though the area accounted for 44% of total dwelling approvals.
Which councils are approving the most homes?
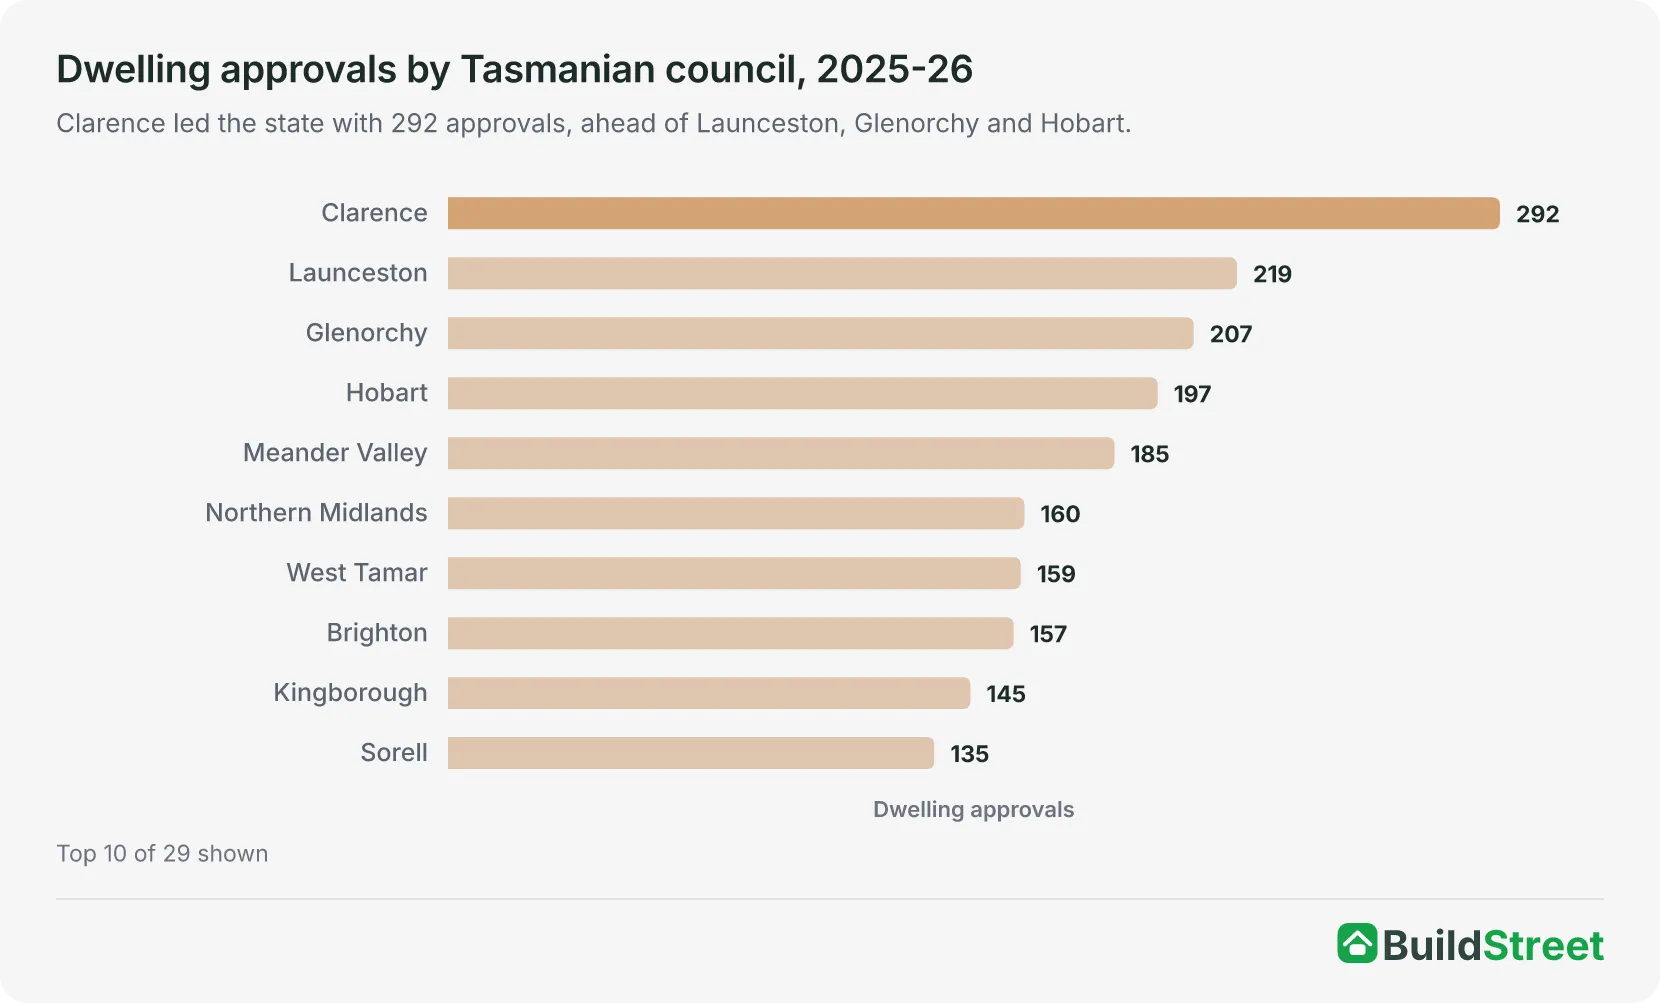
Clarence recorded the highest number of dwelling approvals of any Tasmanian council in 2025-26, with 292 approvals. Launceston followed with 219 approvals, while Glenorchy recorded 207. The top five councils accounted for around 40% of all dwelling approvals in Tasmania.
Section 07 · Structural barriers
Why is Tasmania’s housing pipeline smaller than other states?
Tasmania’s housing pipeline is smaller than most other states because of its population size, approval mix, construction capacity and project costs. Some constraints relate to scale, while others are linked to planning settings, labour availability and infrastructure timing.
- Population scale. Tasmania makes up just 2.2% of Australia's population, so even at the Accord pace, the target of 5,200 homes a year is a fraction of what NSW or Victoria need to build.
- Zoning and dwelling mix. Tasmania’s new dwelling approvals are heavily weighted toward detached houses. The General Residential Zone generally requires a minimum lot size of 450 square metres across suburban residential land, which can make medium-density projects harder to deliver on existing lots.
- Freight and construction costs. Construction materials shipped to Tasmania can carry additional freight costs across Bass Strait. This may add to project costs, particularly for smaller developments where fixed costs are spread across fewer dwellings.
- Trades capacity. Tasmania has a smaller construction workforce than the mainland states. Industry forecasts have pointed to a multi-thousand-worker shortfall across the Accord period, which may limit how quickly approved projects can move through to completion.
- Construction productivity. National construction productivity has been under pressure over the long term. In a smaller market such as Tasmania, weaker productivity can be harder to offset because there are fewer large projects, firms and workers available to absorb delays.
What the April 2026 Tasmania housing package includes
In April 2026, the Commonwealth and Tasmanian Governments agreed in principle to a $165 million housing package. The package includes $115 million in concessional Housing Australia loans and $50 million in grants.3 It is designed to support up to 4,000 new dwellings, with up to 2,101 reserved for first-home buyers.
The package has two main streams.
- Enabling infrastructure. This stream includes a $35 million loan and $50 million in grants for water, sewer and road works in Brighton, Sorell and Meander Valley. The funding is expected to unlock around 2,700 homes, with almost 1,100 reserved for first-home buyers.
- First-home buyer loans. A further $80 million in concessional loans is intended to support more than 2,000 homes around Hobart, Launceston, Devonport and Burnie.
The first homes supported by the package are not expected to reach the market until 2027-28.3 That means the package is not yet visible in the approvals, commencements or completions data used in this article.
Section 08 · Existing-stock pressure
Short-stay rentals in Tasmania and their impact on housing supply
There were 4,750 non-primary-residence short-stay listings across Tasmania in the April to June 2026 quarter, up 53% from the October to December 2019 baseline of 3,112. These listings represent existing dwellings used for commercial short-stay accommodation rather than as primary residences. Tasmania approved 2,735 new homes in 2025-26, meaning its commercial short-stay stock was 1.7 times that figure.
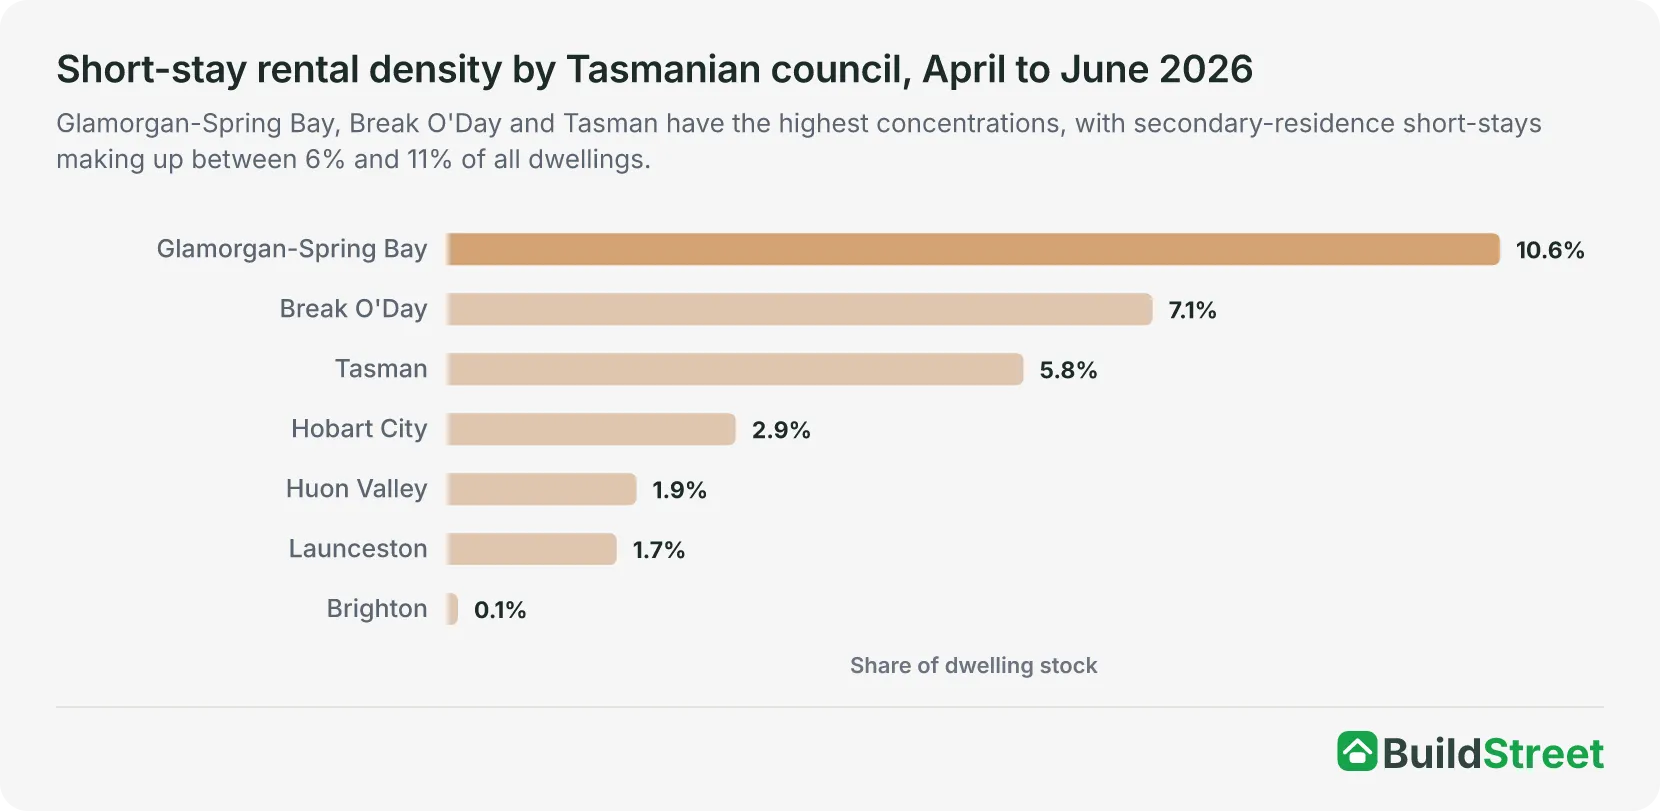
The concentration varies widely by council. In some coastal areas, short-stay rentals account for more than one in ten dwellings. In the Hobart council area the share is 2.9%, while the other Greater Hobart councils range from 0.1% in Brighton to 1.7% in Kingborough.
What the Tasmanian short-stay levy does
Tasmania’s Short Stay Levy Bill 2026 passed the House of Assembly on 7 May 2026 and had its first reading in the Legislative Council on 15 May 2026. As of August 2026, it was still before the Legislative Council and had not received Royal Assent.
The bill would introduce a 5% levy on short-stay accommodation bookings, with the revenue directed to first-home-buyer support.4 The levy is proposed to apply to bookings made through short-stay platforms, while owner-occupiers renting out their primary residence would be exempt. If Parliament passes the bill, the levy will start no earlier than 1 January 2027.
It is not yet clear whether the levy would reduce the number of short-stay properties, be passed on to guests, or shift any homes back into the long-term rental market. The data does not yet show any effect from the proposed levy. In Greater Hobart, the rental vacancy rate was 0.5% in April 2026.
Section 09 · The shortfall
Will Tasmania meet its 2029 Housing Accord target?
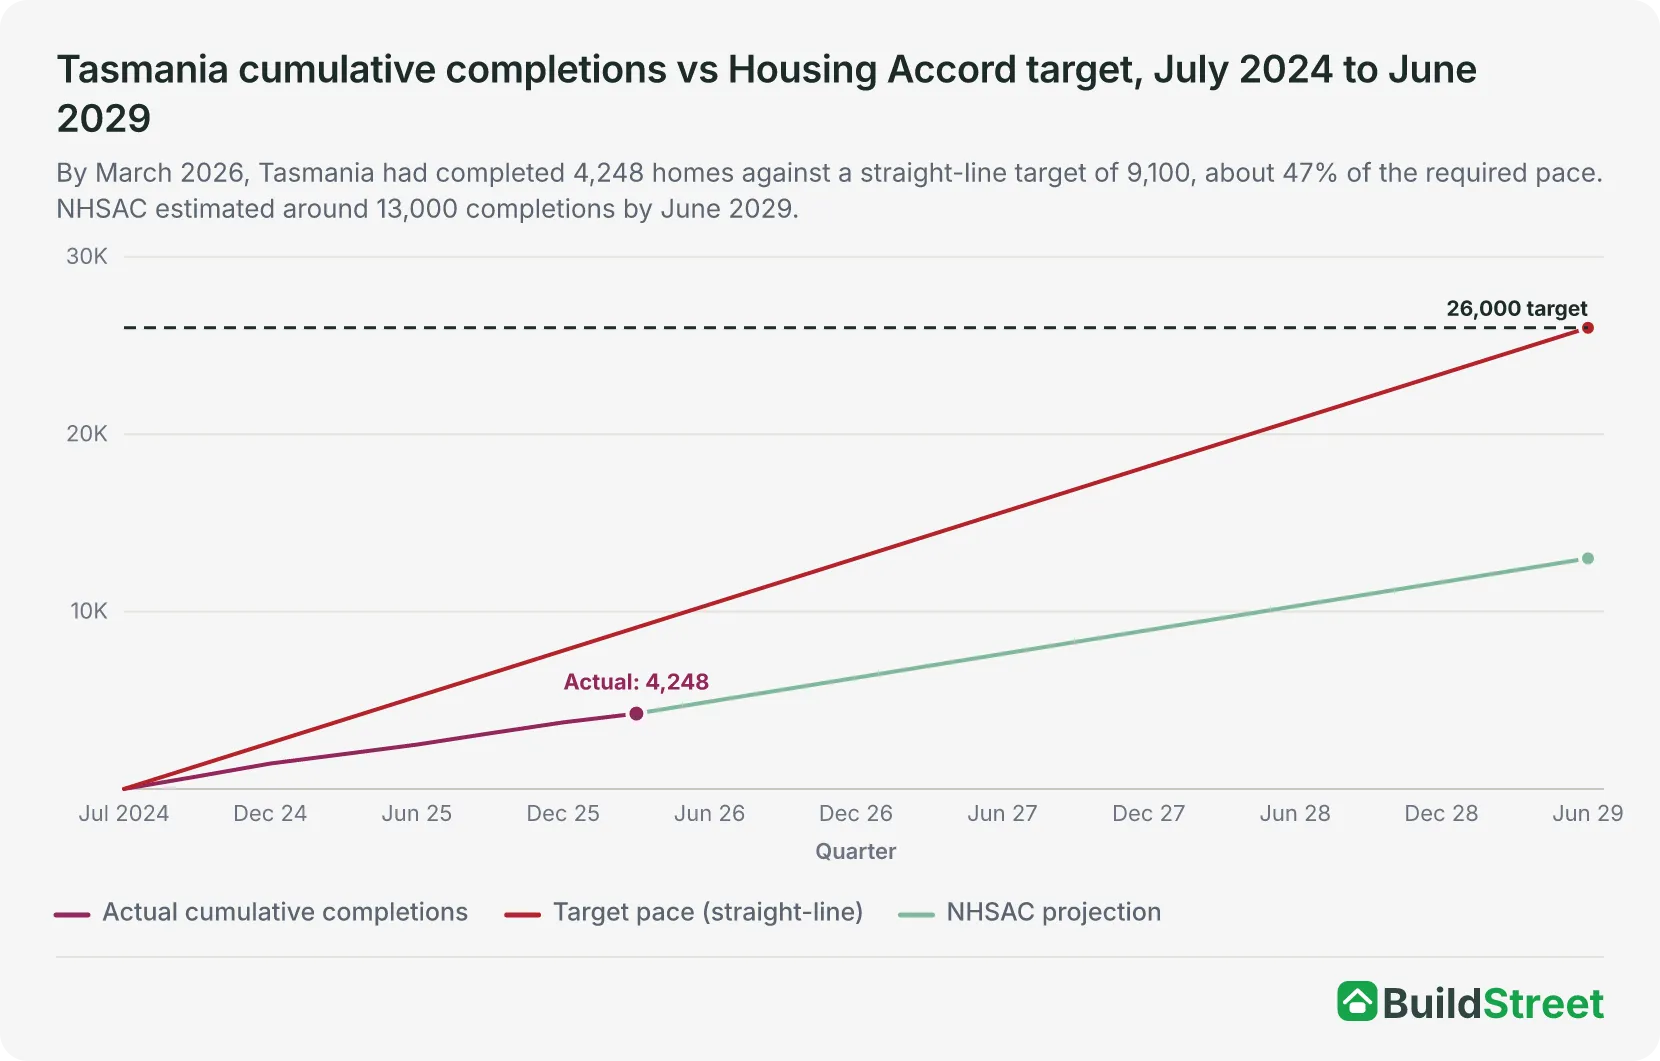
NHSAC's April 2026 outlook projected that Tasmania would deliver around 13,000 of its 26,000-home target by June 2029. That would leave the state about halfway to its target by the deadline. NHSAC's August 2026 report does not expect the full target to be reached until June 2034.1
Industry forecasts suggest the shortfall could be as large as 14,000 homes, based on current commencement rates.
What the data shows about Tasmania’s housing shortfall
Closing a shortfall of around 13,000 homes by June 2029 would require completions to increase well above recent levels. The data points to three constraints: limited medium-density approvals, infrastructure timing and construction workforce capacity.
The April 2026 $165 million state-federal deal helps with part of the second point, but those homes are not expected to settle until 2027-28. Slower population growth eases demand a little, but Tasmania's problem is mostly on the supply side: too few approvals, too few starts, longer build times, and existing homes continuing to move into short-stay accommodation.
Section 10 · Pipeline summary
Tasmania housing pipeline summary, 2009-10 to 2025-26
Tasmania’s dwelling approvals peaked at 4,292 in 2020-21 during the HomeBuilder grant period. Commencements reached 4,053 in the same year, while completions peaked one year later at 3,582 in 2021-22.
Since 2022-23, approvals, commencements and completions have declined toward the 2,300 to 2,500 range. The 2024-25 figures are among Tasmania’s lowest annual pipeline results since the global financial crisis. Approvals picked up to 2,735 in 2025-26, but completions have not yet followed.
Show full tables
| FY | Approvals | Commencements | Completions | Under construction (EOY) | Approved, not yet started (EOY) |
|---|---|---|---|---|---|
| 2009–10 | 3,355 | 3,221 | 2,833 | 2,584 | 523 |
| 2010–11 | 3,124 | 3,064 | 3,244 | 2,357 | 590 |
| 2011–12 | 2,126 | 2,268 | 2,640 | 1,932 | 441 |
| 2012–13 | 1,897 | 1,917 | 2,187 | 1,639 | 333 |
| 2013–14 | 2,184 | 1,962 | 1,919 | 1,633 | 334 |
| 2014–15 | 2,872 | 2,842 | 2,474 | 1,971 | 276 |
| 2015–16 | 2,448 | 2,443 | 2,661 | 1,684 | 372 |
| 2016–17 | 2,250 | 2,177 | 2,161 | 1,666 | 326 |
| 2017–18 | 2,858 | 2,827 | 2,333 | 2,101 | 332 |
| 2018–19 | 3,221 | 3,026 | 2,855 | 2,224 | 419 |
| 2019–20 | 3,198 | 3,053 | 2,795 | 2,416 | 489 |
| 2020–21 | 4,292 | 4,053 | 3,069 | 3,248 | 543 |
| 2021–22 | 3,339 | 3,512 | 3,582 | 3,051 | 358 |
| 2022–23 | 3,130 | 3,059 | 3,248 | 2,915 | 466 |
| 2023–24 | 2,569 | 2,335 | 2,917 | 2,331 | 609 |
| 2024–25 | 2,341 | 2,397 | 2,499 | 2,200 | 516 |
| 2025–26* | 2,735 | 1,831 | 1,749 | 2,248 | 516 |
Source · * 2025-26 covers the full year of approvals (Jul 2025 to Jun 2026), three quarters of commencements and completions (Sep 2025 to Mar 2026), and stocks at March 2026. Methodology: Approvals: ABS Building Approvals (cat. 8731.0), July 2026 release, Table 17. Commencements and completions: ABS Building Activity (cat. 8752.0), March quarter 2026, Tables 36 and 39 (completions include dwellings created outside new residential building). Under construction (EOY): Table 77. Approved but not yet started (EOY): Table 80. Population: ABS National, state and territory population (cat. 3101.0) and ABS Regional Population (cat. 3218.0). Houses share = house approvals divided by total residential approvals. Accord pace = 26,000 ÷ 5 years = 5,200/year. EOY values are at 30 June of the financial year shown, except the 2025-26 row which uses March 2026.
References
- NHSAC Quarterly Report – August 2026 · nhsac.gov.au ↑ b c d
- ABS: Regional Population, 2024–25 · Australian Bureau of Statistics ↑
- Federal Treasury Ministers — $165 million Tasmania-Commonwealth housing partnership announcement · ministers.treasury.gov.au ↑ b
- Tasmanian Department of Treasury and Finance — Short Stay Levy consultation and Bill · treasury.tas.gov.au ↑
- ABS Building Approvals, Australia (latest release, Cat. 8731.0) · Australian Bureau of Statistics
- ABS, Building Activity, Australia (latest release, Cat. 8752.0) · Australian Bureau of Statistics
- ABS, National, state and territory population (latest release) · Australian Bureau of Statistics
- NHSAC State of the Housing System 2026 · nhsac.gov.au
- HIA — HIA welcomes move to unlock 4,000 new homes for Tasmania, April 2026 · hia.com.au
- TasCOSS State of Housing Dashboard — short-stay accommodation indicators · tascoss.org.au
- Tasmanian CBOS — Short Stay Accommodation Dashboard and Report 20 · cbos.tas.gov.au
- Master Builders Tasmania — Tasmanian Housing Forecast 2026-2029 · mbatas.org.au
- SQM Research — Hobart residential vacancy rates, April 2026 · sqmresearch.com.au
- Premier of Tasmania — Thousands of new homes for Tasmanian first home buyers, April 2026 · premier.tas.gov.au
- TasCOSS, Tasmania's State of Housing Data (dashboard data download), September 2026 · tascoss-org-au.assets.ionatahosting.net
