How population growth has changed housing demand in Australia since 1990
Australia's population has grown every decade since 1990: by 1.96 million in the 1990s, 3.00 million in the 2000s, and 3.62 million in the 2010s. A further 2.15 million people were added between June 2020 and December 2025. Overseas migration now accounts for most of Australia's population growth, rising from about half in the early 2000s to almost three-quarters in 2024–25.
Household formation has also increased faster than population growth alone would suggest.
Average household size fell from 2.6 people in 2016 to 2.5 in 2021. No single estimate exists for cumulative shortfall since 1990, but the National Housing Supply and Affordability Council's forward-looking benchmark projects a 37,000-dwelling shortfall over the current Housing Accord period, a flow measure rather than an accumulated total.
Population growth since June 1990
10.74m
From 17.07m in June 1990 to 27.80m in December 2025
Overseas migration's share of growth, 2024–25
72.5%
Up from 51.1% in the early 2000s
Average household size, 2021
2.5
Down from 2.6 in 2016, 2011 and 2006
Projected Housing Accord shortfall
−37,000
NHSAC's forward projection for 2024–25 to 2028–29
Projected population, 2040
32.3m
ABS medium series, Series 29(B)
Projected households, 2040
12.94m
ABS Series II, up 2.94m from 2021
What is driving housing demand in Australia in 2026?
A current breakdown of the core drivers: population growth, net overseas migration, household formation, and how demand differs between capital cities and regions.
Read more →Is Australia on track to build 1.2 million homes by June 2029?
Target pace versus actual completions, a state-by-state scorecard, and the current size of the shortfall against the 1.2 million homes goal.
Read more →SECTION 01 · THE NATIONAL PICTURE
How much has Australia's population grown since 1990?
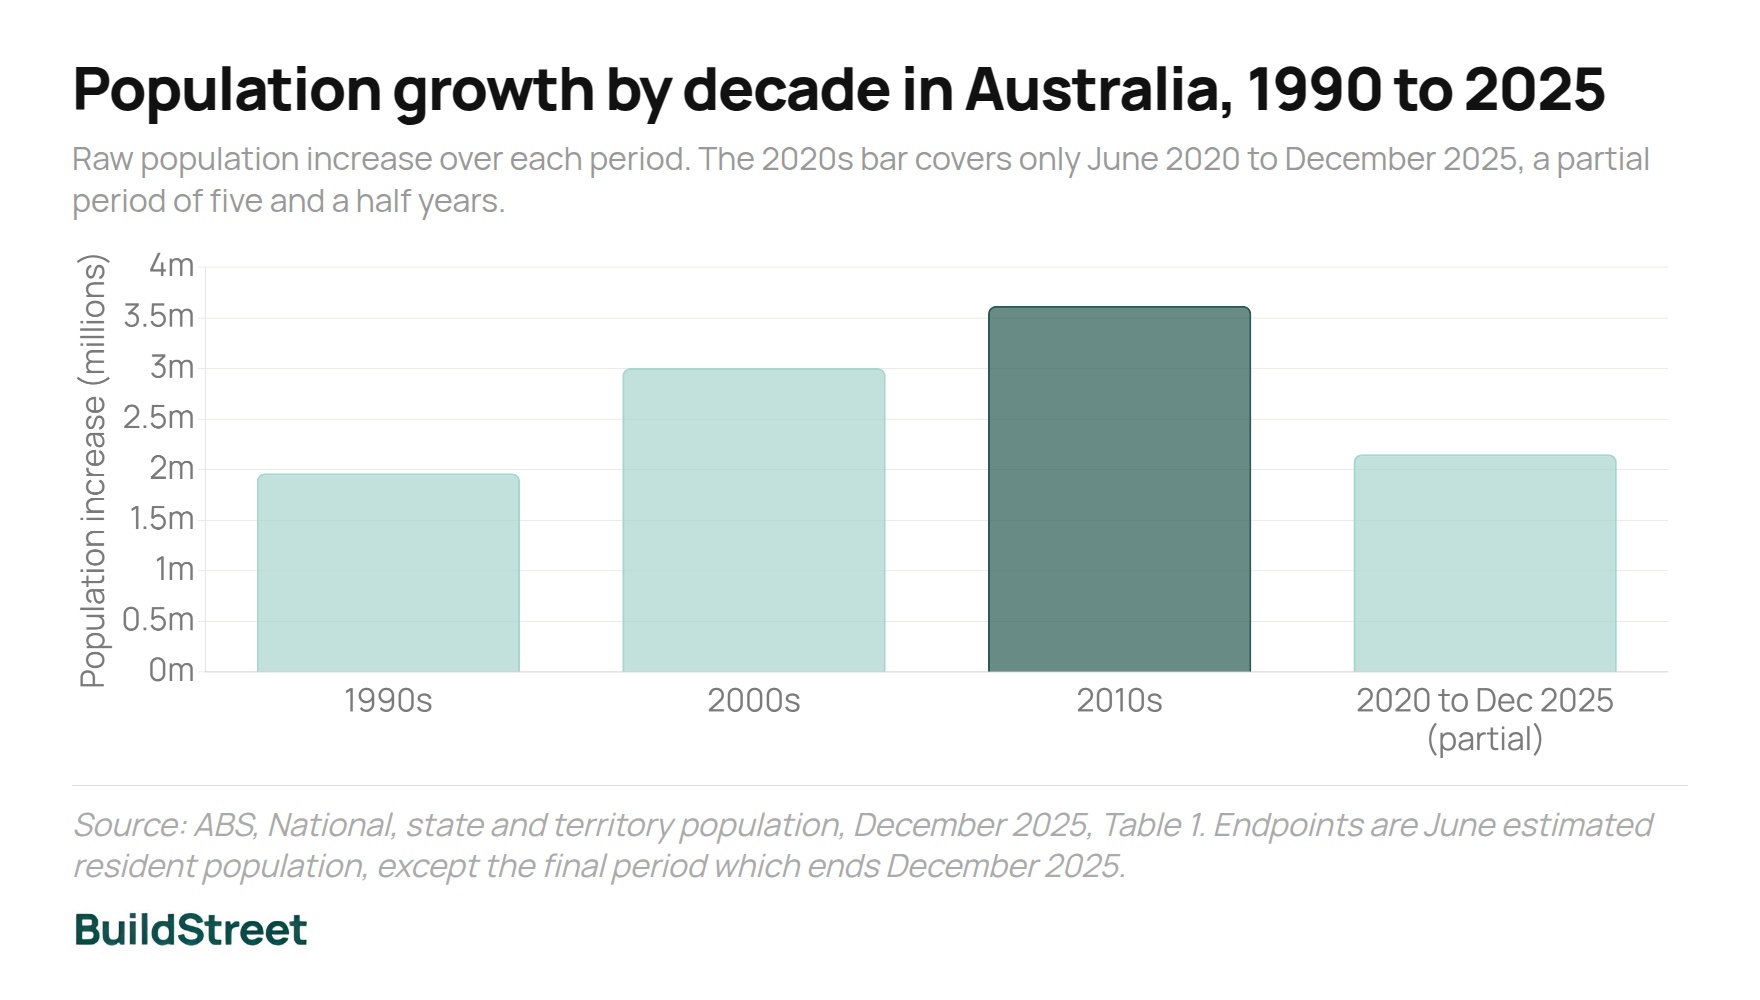
Australia's population rose from 17.07 million in June 1990 to 27.80 million in December 2025. In raw terms, the completed decades added progressively more people: 1.96 million in the 1990s, 3.00 million in the 2000s and 3.62 million in the 2010s. A further 2.15 million people were added in the five and a half years from June 2020 to December 2025.
Raw increases alone are not a fair comparison, since each decade started from a larger population than the last. Measured instead as a compound annual growth rate, the 2010s were the fastest of the four periods at 1.53% a year, followed by the 2000s and the partial 2020s period, both at 1.48%. The 1990s grew the slowest, at 1.10% a year.
Population growth since June 2020 has therefore matched the annual pace recorded in the 2000s, rather than setting a new record.
Population growth by decade in Australia, 1990 to 2025
Raw population increase over each period. The 2020s bar covers only June 2020 to December 2025, a partial period of five and a half years.
1990s
Source: ABS, National, state and territory population, December 2025, Table 1.
| Period | Start population | End population | Increase | CAGR |
|---|---|---|---|---|
| 1990s | 17,065,100 | 19,028,800 | 1,963,700 | 1.10% |
| 2000s | 19,028,800 | 22,031,800 | 3,003,000 | 1.48% |
| 2010s | 22,031,800 | 25,649,200 | 3,617,400 | 1.53% |
| 2020 to Dec 2025 (partial) | 25,649,200 | 27,801,000 | 2,151,800 | 1.48% |
Source: ABS, National, state and territory population, December 2025, Table 1. The final row spans 5.5 years, not 10, so its raw increase is not directly comparable with the completed decades above.
Why the partial 2020s period needs separate comparison
The 2020s row covers only five and a half years, from June 2020 to December 2025. Comparing its raw population increase directly against a full ten-year decade would understate how fast Australia is growing right now.
The compound annual growth rate corrects for this by expressing growth as a yearly pace rather than a total. The growth rate since 2020 (1.48% a year) is below the 2010s (1.53%) and equal to the 2000s (1.48%), not a new high.
SECTION 02 · MIGRATION
How has overseas migration changed Australia's population growth?
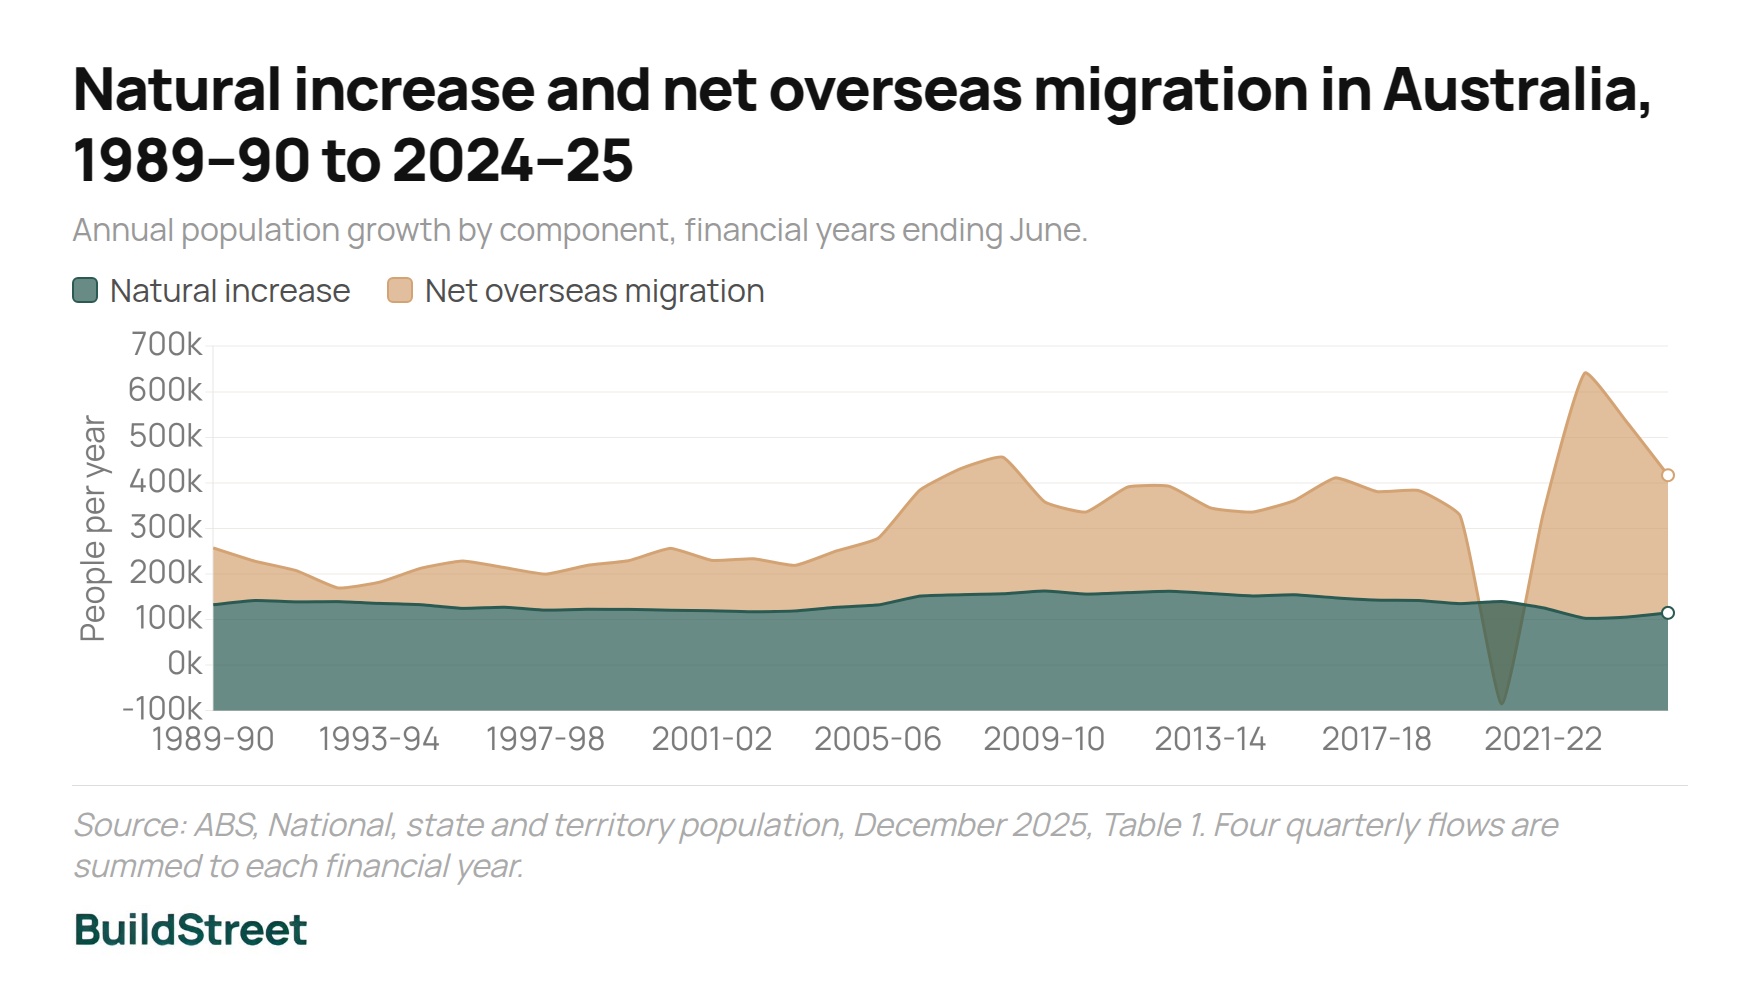
Overseas migration accounted for 71% of Australia's population growth over the five years to 2024–25, compared with 51.1% in the early 2000s. In the latest completed financial year, 2024–25, its share was 72.5%.
The shift has not been a smooth trend. Overseas migration fell to a net outflow of 85,000 people in 2020–21 during Australia's international border closure, before reaching a record year-ending level of 556,000 in the September quarter of 2023 as arrivals increased after the border reopened.
The most recently completed financial year, 2024–25, recorded overseas migration of 302,200 in the quarterly population series. The ABS's separate annual migration release publishes 306,000 for the same year after later revisions.
Natural increase and net overseas migration in Australia, 1989–90 to 2024–25
Annual population growth by component, financial years ending June.
1989-90
Source: ABS, National, state and territory population, December 2025, Table 1.
| Financial year | Natural increase | NOM | Total growth | NOM share |
|---|---|---|---|---|
| 1999–2000 | 122,100 | 107,200 | 216,500 | 49.5% |
| 2004–05 | 126,900 | 123,800 | 244,100 | 50.7% |
| 2009–10 | 162,600 | 196,100 | 340,100 | 57.7% |
| 2014–15 | 151,800 | 184,100 | 340,300 | 54.1% |
| 2019–20 | 134,800 | 192,700 | 314,400 | 61.3% |
| 2020–21 | 139,500 | -85,000 | 36,200 | −234.8% |
| 2022–23 | 102,900 | 538,300 | 641,200 | 84.0% |
| 2024–25 | 114,600 | 302,200 | 416,700 | 72.5% |
Source: ABS, National, state and territory population, December 2025, Table 1. The 2020–21 overseas migration share is a mathematical artefact of a very small growth total combined with a net migration outflow.
Overseas migration peaked at a year-ending 556,000 in September 2023 before falling to 306,000 in 2024–25
The peak reflected a catch-up in arrivals after almost two years of closed international borders. The subsequent fall coincided mainly with fewer temporary visa arrivals, particularly international students, and a rise in departures as earlier arrivals reached the end of their visas.
International student arrivals fell after the 2022–23 peak
International student arrivals fell by about 44% in two years, from 278,000 in 2022–23 to 157,000 in 2024–25. This was part of a broader decline in temporary visa arrivals.
Migrant arrivals by visa status, ABS Overseas Migration release
2022–23
2023–24
2024–25
Source: ABS, Overseas Migration releases for 2022–23, 2023–24 and 2024–25.
SECTION 03 · HOUSEHOLD FORMATION
How has household formation compared with dwelling completions?
Household growth was equivalent to about 97 households for every 100 gross dwelling completions in the five years to the 2021 Census, the highest ratio across the five Census periods examined. The other periods ranged from 52 to 81 households per 100 completions. This is a descriptive comparison, not a direct measure of housing supply against demand.
Using a household proxy comprising family, lone-person and group households, the number of households grew by 989,128 between the 2016 and 2021 Censuses, compared with 1,019,732 gross dwelling completions over the same aligned 20 quarters.
Part of the change reflects smaller households. Average household size remained at 2.6 people across the 2006, 2011 and 2016 Censuses before falling to 2.5 in 2021.
Household growth versus gross dwelling completions in Australia, 1996 to 2021
Household growth and gross dwelling completions compared across five Census periods, with new households formed per 100 completions.
Source: ABS Census QuickStats (1996 to 2021); ABS Building Activity, Australia, Table 37.
| Census interval | Household increase | Gross completions | Per 100 completions |
|---|---|---|---|
| 1996–2001 | 462,978 | 698,197 | 66.3 |
| 2001–2006 | 399,302 | 773,304 | 51.6 |
| 2006–2011 | 616,222 | 757,459 | 81.4 |
| 2011–2016 | 525,765 | 849,708 | 61.9 |
| 2016–2021 | 989,128 | 1,019,732 | 97.0 |
Source: ABS Census QuickStats and ABS Building Activity, Australia, Table 37. Gross completions exclude demolitions and conversions, so the ratio is descriptive rather than a shortfall measure.
Why household growth and completions do not measure a housing shortfall
The difference between household growth and completions is not a reliable measure of housing undersupply because the two series measure different things. Gross completions do not account for dwellings lost through demolition, disaster or conversion, so they overstate net additions to the housing stock.
Census household counts are also influenced by vacancy rates, secondary or short-stay dwellings and the number of people able to form a separate household. They do not measure underlying housing demand independently of the available dwelling stock.
A valid supply-demand balance requires comparable flow measures on both sides. Section 04 outlines the current official annual-flow benchmark.
Average household size fell to 2.5 people in 2021
Average household size has declined over the longer term. RBA estimates suggest the household-size decline between early 2020 and September 2022 alone, separate from population growth, added around 120,000 households nationally.
| Census year | Average people per household |
|---|---|
| 2006 | 2.6 |
| 2011 | 2.6 |
| 2016 | 2.6 |
| 2021 | 2.5 |
Source: ABS Census QuickStats, Australia, 2006, 2011, 2016 and 2021.
SECTION 04 · THE SUPPLY-DEMAND BALANCE
What is Australia's projected housing supply shortfall?
The clearest available benchmark projects a 37,000-dwelling shortfall over the 2024–25 to 2028–29 Housing Accord period, with net new supply of 862,000 dwellings against new underlying demand of 900,000 households.
The National Housing Supply and Affordability Council describes this as a forward-looking flow model. It does not represent the total housing shortfall accumulated before the Accord period.
No single, consistent estimate exists for cumulative housing undersupply since 1990. A genuine supply-demand balance needs two comparable flow measures: net new supply after losses, and new underlying demand.
Is housing supply keeping pace with underlying demand?
NHSAC projects that net new housing supply will remain below new underlying demand from 2023–24 to 2026–27. Supply is projected to exceed demand from 2027–28, but not by enough to remove the shortfall across the full Housing Accord period.
The simpler comparison in Section 03 shows that gross completions exceeded household growth in every Census interval from 1996 to 2021, but that comparison does not include dwellings lost through demolition or disaster.
The narrower official conclusion is that net new supply is projected to fall short of new underlying demand over the Housing Accord period, despite annual supply moving above demand from 2027–28.
NHSAC's housing supply and demand outlook for Australia, 2023–24 to 2029–30
Gross new supply, net new supply and new underlying demand by financial year, alongside the net balance between supply and demand. Shaded years fall within the 2024–25 to 2028–29 Housing Accord period.
2023–24
Source: NHSAC, State of the Housing System 2026, Table 4.2.
| Year | Gross | Net | Demand | Balance | Accord |
|---|---|---|---|---|---|
| 2023–24 | 177,000 | 155,000 | 233,000 | -78,000 | No |
| 2024–25 | 174,000 | 153,000 | 196,000 | -43,000 | Yes |
| 2025–26 | 179,000 | 158,000 | 182,000 | -24,000 | Yes |
| 2026–27 | 199,000 | 175,000 | 176,000 | -1,000 | Yes |
| 2027–28 | 213,000 | 187,000 | 174,000 | +13,000 | Yes |
| 2028–29 | 215,000 | 190,000 | 172,000 | +17,000 | Yes |
| 2029–30 | 219,000 | 193,000 | 180,000 | +13,000 | No |
Source: NHSAC, State of the Housing System 2026, Table 4.2, report page 71. Figures rounded to the nearest 1,000.
NHSAC projects a 37,000-dwelling shortfall over the Housing Accord period
The shortfall is concentrated in the earlier Accord years. NHSAC's outlook shows the balance first turning positive in 2027–28. These later annual surpluses reduce, but do not remove, the projected shortfall across the full Accord period.
SECTION 05 · INTERNAL MIGRATION
How the mining boom and COVID changed interstate migration
New South Wales recorded a net interstate outflow in every year from 1989–90 to 2024–25, while Queensland recorded a net inflow in every year over the same 36-year period.
Across the financial years ending 2003 to 2013, an analytical period used in this article rather than an official ABS classification, average annual net interstate migration was Queensland +20,100 a year, Western Australia +4,100 and New South Wales −21,500. Western Australia's smaller interstate inflow does not mean the resources boom generated less labour demand there; temporary migration and FIFO arrangements were important sources of labour.
Net interstate migration in NSW, Vic, Qld and WA, 1989–90 to 2024–25
Annual net gain or loss of residents to other states and territories.
1989-90
Source: ABS, National, state and territory population, December 2025, Table 2.
Average annual net interstate migration by era
Mining-boom (FY03–13)
COVID (FY20–22)
Post-COVID (FY23–25)
Source: ABS, National, state and territory population, December 2025, Table 2. Eras are analytical groupings, not official ABS classifications.
Victoria's interstate outflow eased after COVID-19
During the COVID disruption (FY20 to FY22), Victoria averaged −23,059 a year, its largest average outflow across the three periods compared. In the post-COVID period the pattern shifted: Victoria's outflow eased to −4,605 a year, New South Wales's widened to −29,943, and Western Australia's inflow strengthened to +14,064.
The interstate migration data show where net gains and losses occurred but do not establish why people moved.
SECTION 06 · TODAY VERSUS THE EARLY 2000s
How housing demand drivers today compare to the early 2000s
Average annual population growth rose from 229,600 people a year over 2000–01 to 2004–05 to 392,360 a year over 2020–21 to 2024–25. Most of the increase came from overseas migration rather than natural increase.
In the earlier period, natural increase supplied 52.5% of growth and net overseas migration supplied 51.1%. In the more recent five years, migration supplied 71% of growth. Annual growth has therefore become more sensitive to changes in migration policy, international travel and temporary visa movements.
Average annual population growth by component
Early 2000s (FY01–05)
Recent 5 years (FY21–25)
Latest year (2024–25)
Source: ABS, National, state and territory population, December 2025, Table 1. Component shares are expressed as a percentage of published population growth; the two shares in each column may not sum to 100 due to reconciliation revisions.
A brief affordability note
Australia's residential dwelling stock was valued at $12.77 trillion in the March quarter of 2026, with a mean dwelling price of $1,111,100. The rents component of the CPI rose 3.6% in the twelve months to May 2026.
These figures provide broader affordability context. They do not measure housing demand directly and are not used in the population or household-formation calculations in this article.
SECTION 07 · LOOKING AHEAD
How could population and household growth affect housing demand to 2040?
Australia's population is projected to reach 32.3 million by 2040, up from 27.4 million in 2025, under the medium-scenario projection used in this article. Household projections put the central estimate (Series II) at 12.94 million households in 2040, an increase of 2.94 million from the 2021 base.
A separate projection from the Centre for Population, a Treasury body, expects Australia's population to reach 31.5 million by 2035–36 and 41.0 million by 2065–66, with annual growth easing to about 1.2% from 2026–27, below the 1.4% average of the 2010s.
Population and household projections for Australia, 2021 to 2040
ABS medium population series against the Series I, II and III household projection range.
2021
Source: ABS Population Projections, Table B9, Series 29(B); ABS Household and Family Projections, 2021 to 2046.
| Year | ABS medium pop. | Series I | Series II | Series III |
|---|---|---|---|---|
| 2021 | — | 9,993,880 | 9,993,880 | 9,993,880 |
| 2025 | 27,395,011 | 10,714,916 | 10,622,921 | 10,622,921 |
| 2030 | 29,294,970 | 11,621,708 | 11,449,795 | 11,401,389 |
| 2035 | 30,862,815 | 12,432,612 | 12,216,604 | 12,077,783 |
| 2040 | 32,308,944 | 13,165,972 | 12,938,818 | 12,670,783 |
Source: ABS Population Projections, Table B9, Series 29(B); ABS Household and Family Projections, Series I to III. The ABS population projection has no 2021 data point in this series; the first year shown is 2022.
Population and household projections are scenarios, not forecasts
Series I assumes household living-arrangement patterns stay as they were in 2021. Series II assumes the historical 2006–2021 rate of change continues but gradually eases. Series III assumes that same rate continues without easing. None of the three household series predicts what will occur.
SECTION 08 · POPULATION GROWTH
How has Australia's housing demand changed since 1990?
Australia's population has grown every decade since 1990, from 17.07 million to 27.80 million. Three major demand drivers changed over that period:
- Migration now drives most of the growth. NOM has gone from about half of population growth in the early 2000s to close to three-quarters today, making growth faster but more sensitive to migration policy and global conditions.
- Households are forming faster than population growth alone explains, partly because the average household has grown smaller.
- Internal migration patterns have changed by state. Queensland and Western Australia have responded differently to both the mining boom and COVID, while NSW and Victoria have recorded net interstate losses through most of the past decade.
No single, methodologically consistent estimate exists for cumulative housing undersupply since 1990. The clearest current official benchmark is NHSAC's forward-looking Housing Accord outlook. Across the 2024–25 to 2028–29 Accord period, NHSAC projects a shortfall of 37,000 dwellings. Annual net supply is projected to exceed annual demand from 2027–28, but the later surpluses are not large enough to remove the published shortfall across the full five-year period.
General information only
This article is a statistical reference based on publicly available government data. Figures may differ slightly because of rounding, revisions or different methodologies. Data were reviewed in July 2026 and some recent ABS figures remain preliminary and subject to revision.
References
- ABS: National, state and territory population, December 2025
- ABS: Overseas Migration, 2024–25
- ABS: Building Activity, Australia, March 2026
- ABS: Census QuickStats, Australia, 2021
- ABS: Household and Family Projections, 2021 to 2046
- ABS: Population Projections, 2022 (base) to 2071
- NHSAC: State of the Housing System 2026
- Centre for Population: 2025 Population Statement
- RBA: A new measure of average household size, March 2023
- Productivity Commission: Geographic Labour Mobility, April 2014
Chart Snapshots