What is driving housing demand in Australia in 2026? Population, migration and household formation
New household formation in Australia is projected to exceed net new housing supply by 24,000 dwellings in 2025–26, down from a 78,000-dwelling gap two years earlier, according to the National Housing Supply and Affordability Council (NHSAC).
Population growth is the largest demographic driver: Australia added 412,494 people (+1.51%) in the year to December 2025, reaching 27,801,023. Net overseas migration contributed 300,955 of that growth, around 73%, with natural increase adding a further 111,539.
Household formation has also slowed: NHSAC estimates new underlying demand at 182,000 households in 2025–26, while the average number of adults per household rose to 2.10 in 2024–25. NHSAC projects the shortfall will become a surplus by 2027–28.
Population, Dec 2025
27.80m
+412,494 over the year (+1.51%)
Net overseas migration
300,955
Year to Dec 2025 · about 73% of population growth
Natural increase
111,539
Births minus deaths, year to Dec 2025
Demand vs supply gap, 2025–26
-24,000
Dwellings short of new demand · narrowed from -78,000 in 2023–24
Adults per household
2.10
2024–25, up from 2.08 a year earlier
Capital city vs regional growth
1.8% / 1.1%
2024–25 population growth
Is Australia on track to build 1.2 million homes by June 2029?
How the National Housing Accord target is tracking state by state, and which jurisdictions are expected to reach their share of it first.
Read more →Why is housing construction falling short of targets?
The labour, land and cost pressures behind the gap between approvals and completions, and the factors that may determine whether it closes.
Read more →SECTION 01 · THE FRAMEWORK
The core drivers of housing demand in Australia
Four demographic drivers shape how many homes Australia needs. The first is population growth: Australia added 412,494 people (+1.51%) in the year to December 2025.
The other three drivers are:
- the age profile of that growth
- how many people live in each household
- where growth is concentrated
Economic conditions then determine how much of that underlying need shows up as buying or renting activity.
Population growth
+412,494
Base layer of housing demand, though not one-to-one with dwellings.
Age profile
38.4 yrs
Median age, 2024–25. Younger and older adults form households at different rates.
Household size
2.10 adults
Per household. Higher figures reduce the number of new households formed.
Where growth lands
1.8% / 1.1%
Capital city vs regional growth in 2024–25.
What is the difference between underlying and effective housing demand?
Underlying demand is an aggregate demographic estimate of how many households the population would form on demographic grounds alone, not a count of identifiable households waiting to enter the market.
Effective demand adjusts that estimate for economic conditions, including household income, savings and access to credit, to gauge how much of that underlying need is likely to be expressed in the housing market under prevailing conditions.
The two measures can move in different directions over the same period.
SECTION 02 · THE GAP
Australia's housing demand still exceeds new housing supply
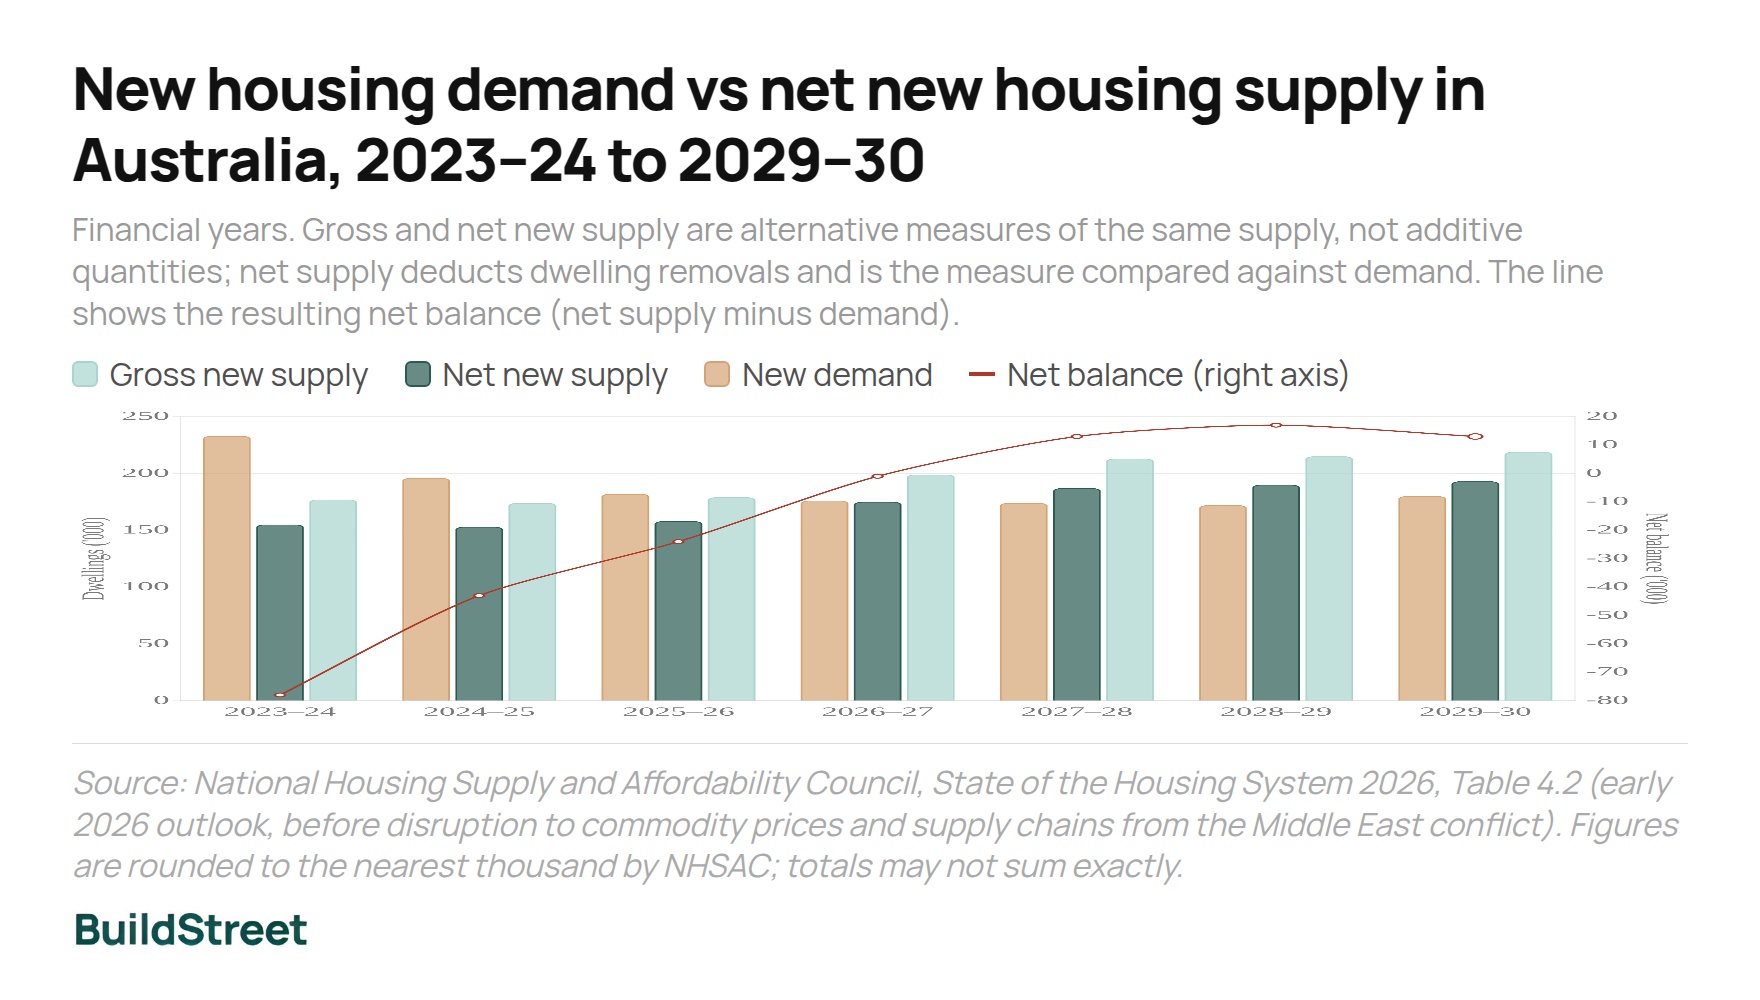
New underlying demand exceeded net new housing supply by 24,000 dwellings in 2025–26. That is a smaller shortfall than the 78,000-dwelling gap recorded in 2023–24.
NHSAC expects the gap to close further and turn into a modest surplus from 2027–28 onward, as supply continues to ramp up and demand growth settles near its long-run pace.
New housing demand vs net new housing supply in Australia, 2023–24 to 2029–30
Financial years, thousands of dwellings. The line shows the net balance (net supply minus demand).
Source: NHSAC, State of the Housing System 2026, Table 4.2. Figures rounded to the nearest thousand.
| Financial year | Gross new supply | Net new supply | New demand | Net balance |
|---|---|---|---|---|
| 2023–24 | 177,000 | 155,000 | 233,000 | -78,000 |
| 2024–25 | 174,000 | 153,000 | 196,000 | -43,000 |
| 2025–26 | 179,000 | 158,000 | 182,000 | -24,000 |
| 2026–27 | 199,000 | 175,000 | 176,000 | -1,000 |
| 2027–28 | 213,000 | 187,000 | 174,000 | +13,000 |
| 2028–29 | 215,000 | 190,000 | 172,000 | +17,000 |
| 2029–30 | 219,000 | 193,000 | 180,000 | +13,000 |
Source: NHSAC, State of the Housing System 2026, Table 4.2. Figures rounded to the nearest thousand.
The shortfall narrows to 1,000 dwellings in 2026–27
The annual gap is projected to narrow to 1,000 dwellings in 2026–27, before net new supply overtakes new demand from 2027–28. This reflects both a moderating population growth rate and a ramp-up in housing supply, rather than either factor alone.
SECTION 03 · BUILDING ACTIVITY
How many dwellings is Australia building, and where?
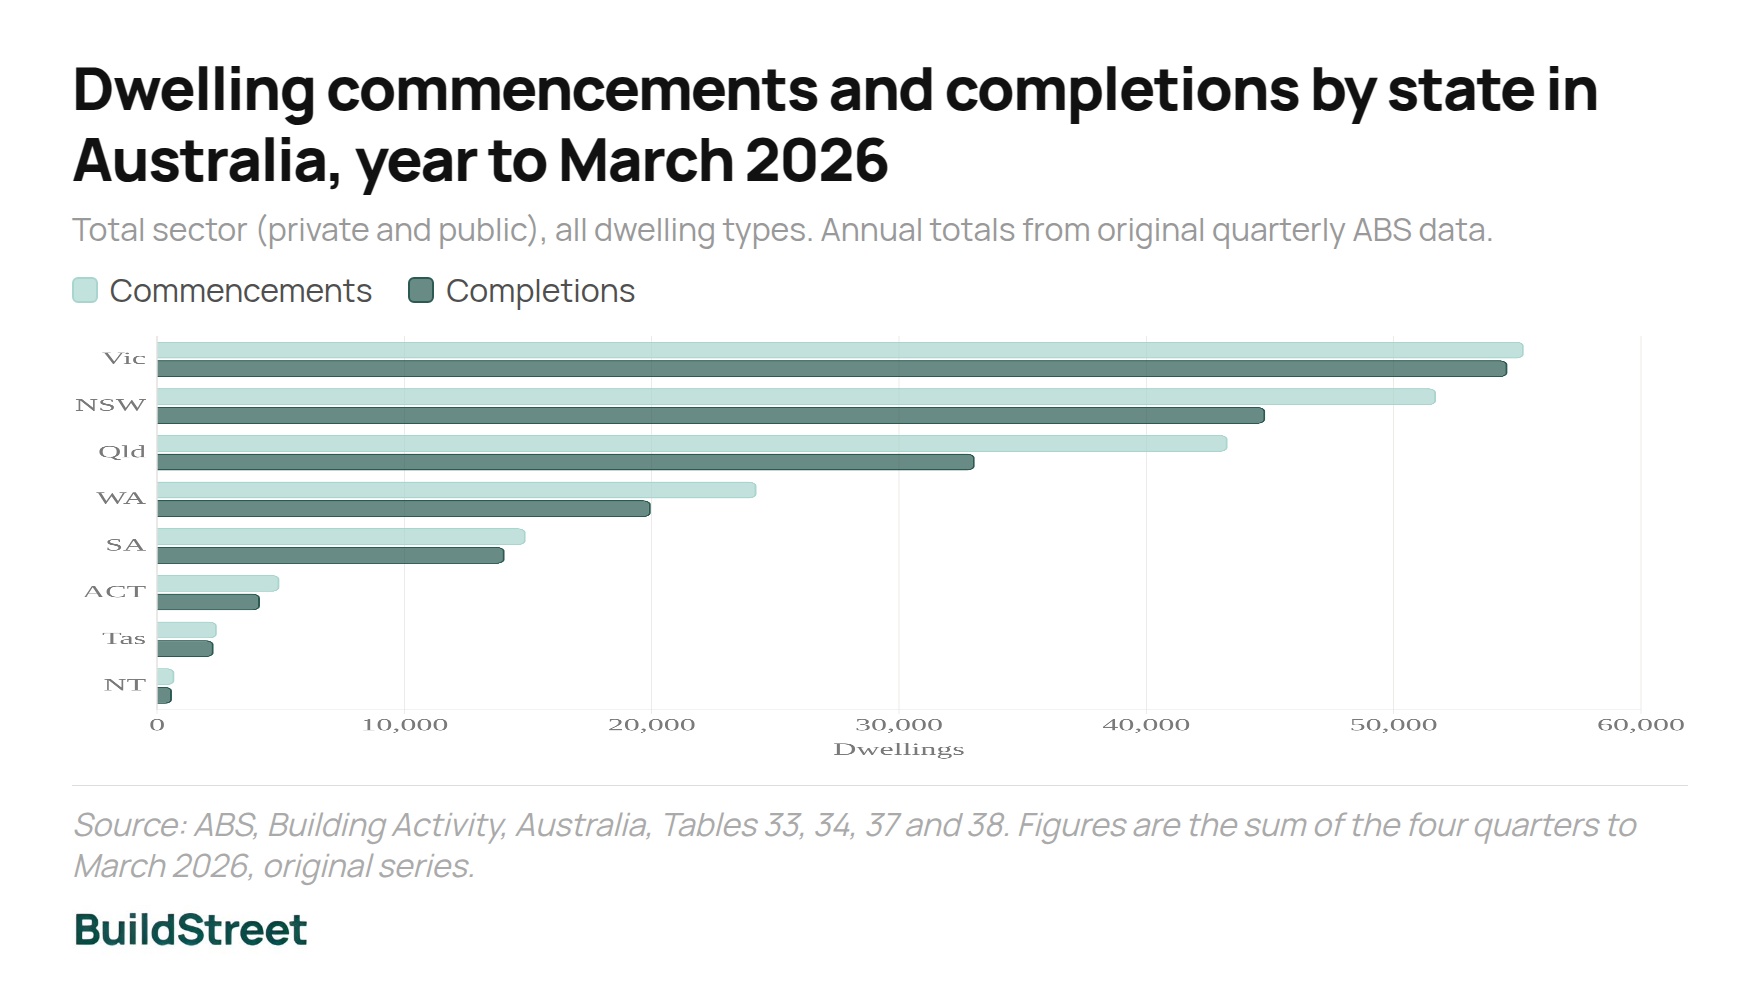
In the year to March 2026, 197,456 dwellings were commenced and 173,526 were completed nationally. Commencements and completions are different flow measures covering different dwelling cohorts.
The separately reported pipeline measure was higher again: 243,864 dwellings were under construction at March 2026. Of the dwellings commenced, 113,337 were houses and 83,280 were other residential (townhouses, units and apartments).
Dwelling commencements and completions by state in Australia, year to March 2026
Total sector (private and public), all dwelling types. Annual totals from original quarterly ABS data.
Source: ABS, Building Activity, Australia, Tables 33, 34, 37 and 38.
Victoria completed more dwellings than any other state
Victoria completed more dwellings than any other state in the year to March 2026. New South Wales completed 44,804 dwellings, compared with 51,714 commencements. Because annual commencements and completions cover different dwelling cohorts, that gap should not be read as a direct measure of NSW's construction pipeline.
SECTION 04 · HOUSEHOLD FORMATION
How many new households form in Australia each year?
New underlying demand is estimated at 182,000 households in 2025–26, down by about 22% from 233,000 in 2023–24 as population growth moderates towards its pre-pandemic pace.
From 2026–27 onward, new household formation is expected to settle at around 172,000 to 180,000 a year through to 2029–30. The annual figure remains sensitive to migration, the population's age structure, and how households form.
A separate ABS Household and Family Projections series, under Series II living-arrangement assumptions, projects the number of Australian households to rise from 10,622,921 in 2025 to 10,787,602 in 2026, an implied increase of about 164,700 — broadly consistent with the 182,000 estimate above.
What do ABS household projection Series I, II and III assume?
All three series are built on the same underlying population projection. They differ only in how they assume people's living arrangements will change:
- Series I holds 2021 propensities constant for the whole period.
- Series II assumes the 2006–2021 trend in propensities continues, but gradually plateaus.
- Series III assumes that trend continues at its full historical rate.
SECTION 05 · MIGRATION
How much of Australia's population growth comes from migration?
Net overseas migration added 300,955 people to Australia's population in the year to December 2025, around 73% of total population growth.
For 2024–25: 568,370 arrivals and 262,800 departures, giving net overseas migration of 305,570. Temporary student arrivals were the largest single group at 156,710.
Overseas migrant arrivals and departures in Australia, by visa and citizenship group, 2024–25
Financial year 2024–25. Permanent visas combine family, skilled permanent, humanitarian, and other permanent categories.
Source: ABS, Overseas Migration, 2024–25, Table 4.1. Figures rounded to the nearest 10.
Temporary student visas were the largest migrant-arrival category in 2024–25
In 2024–25, 156,710 arrivals and 48,640 departures were recorded under temporary student visas, an arithmetic difference of 108,070. This should not be read as the net contribution of a fixed student cohort, since travellers can change visa or citizenship category before they depart.
The 2026–27 Federal Budget, released in May 2026, revised the 2025–26 migration forecast up to 295,000, from 260,000 in the December 2025 Mid-Year Economic and Fiscal Outlook.
| Financial year | Dec 2025 MYEFO | May 2026 Budget |
|---|---|---|
| 2024–25 | 310,000* | 305,000 |
| 2025–26 | 260,000 | 295,000 |
| 2026–27 | 225,000 | 245,000 |
| 2027–28 | n/a | 225,000 |
| 2028–29 / 2029–30 | n/a | 225,000 (both years) |
Source: Australian Government, MYEFO 2025–26 and Budget Paper No. 1, 2026–27, Table 2.2. NOM remains around 45% below its 2022–23 peak of 538,000.
SECTION 06 · MIGRANT COUNTRIES OF BIRTH
Which countries of birth contributed most to Australia's net overseas migration?
India was the leading country of birth by net overseas migration in 2024–25, adding a net 57,410 people, around 19% of the national total. Together, the top five countries of birth accounted for just over half of Australia's total net overseas migration for the year.
Net overseas migration to Australia by top country of birth, 2024–25
Top 10 countries by net contribution to Australia's population, financial year 2024–25.
Source: ABS, Overseas Migration, 2024–25, Table 1.1.
The top five countries of birth account for just over half of net migration
India, China, the UK/Channel Islands/Isle of Man, New Zealand and the Philippines together contributed around 53% of Australia's total net overseas migration in 2024–25. The remaining share was distributed across 240 other countries of birth.
SECTION 07 · HOUSEHOLD SIZE
How household size changes housing demand in Australia
Australia's average number of adults per household rose to 2.10 in 2024–25, up from 2.08 a year earlier, after dipping as low as 2.05 in 2021–22.
NHSAC attributes the recent increase to affordability pressure, reflected in adult children staying in the family home for longer and more people sharing homes or living with partners. Both patterns reduce the number of dwellings needed for a given adult population.
Adults per household in Australia, 2019–20 to 2024–25
National average, financial years. Axis truncated to 2.00–2.15 to make the year-to-year movement legible.
Source: NHSAC, State of the Housing System 2026, selected housing data table.
Living with parents, age 20–24 (2006 Census)
33.9%
Share still living as 'child' in the family home
Living with parents, age 20–24 (2021 Census)
37.4%
Share still living as 'child' in the family home
Source: ABS, Household and Family Projections, Australia, 2021 to 2046. The equivalent share for 25–29 year olds rose from 12.9% in 2006 to 13.8% in 2021.
SECTION 08 · AGEING AND FERTILITY
How ageing and falling fertility affect housing demand in Australia
Australia's median age reached 38.4 years in 2024–25, up from 36.7 in 2005–06, and is projected to keep climbing to 43.7 by 2065–66. The old-age dependency ratio has risen from 19.3 in 2005–06 to 26.9 in 2024–25.
Fertility has fallen below replacement level: Australia's total fertility rate was 1.481 births per woman in 2024, a new record low against a replacement rate of around 2.1. This gap is one structural reason migration has become the largest source of population growth.
Median age and old-age dependency ratio in Australia, 1985–86 to 2065–66
Historical figures to 2024–25, Centre for Population projections thereafter.
Source: ABS, National, state and territory population; Centre for Population, 2025 Population Statement.
Australia's fertility rate is below replacement level
A total fertility rate of 1.481 births per woman in 2024, against a replacement rate of around 2.1, is a new record low. This is part of why net overseas migration remains a key driver of Australia's future population growth and, by extension, long-run housing demand.
SECTION 09 · CAPITAL CITIES VS REGIONS
How population growth differs across Australian capital cities, regions and states
Capital cities grew by 1.76% in 2024–25, against 1.08% for regional Australia. Most of the net population gain from overseas migration was concentrated in capital cities, which added 258,117 people, compared with 46,662 in regional Australia. Through internal migration, capital cities recorded a net loss of 29,782 people to regional areas.
Western Australia recorded the fastest population growth of any state in 2024–25. New South Wales recorded the largest net outflow to other states. Queensland and Western Australia were the largest net beneficiaries of interstate migration.
Population growth by state and territory in Australia, 2024–25
Percentage change in estimated resident population, financial year 2024–25.
Source: ABS, Regional Population, 2024–25.
| State / territory | Growth | Natural | Net interstate | Net overseas |
|---|---|---|---|---|
| WA | +2.2% | 14,890 | +10,288 | 41,057 |
| Vic | +1.8% | 36,516 | -777 | 87,159 |
| Qld | +1.8% | 20,606 | +21,595 | 55,673 |
| NT | +1.4% | 2,024 | -2,105 | 3,753 |
| ACT | +1.3% | 2,882 | -1,501 | 4,819 |
| NSW | +1.2% | 34,576 | -24,328 | 90,226 |
| SA | +1.1% | 2,727 | -1,295 | 19,069 |
| Tas | +0.3% | 350 | -1,877 | 3,023 |
Source: ABS, Regional Population, 2024–25, Table 10. Preliminary June 2025 estimates.
New South Wales recorded the largest net loss to interstate migration
Despite recording the highest net overseas migration of any state in absolute terms, New South Wales lost more residents to other states than any other jurisdiction in 2024–25. Queensland and Western Australia were the main beneficiaries.
SECTION 10 · SINCE 2015
How population growth and migration have changed in Australia since 2015
Population growth was comparatively steady in the second half of the 2010s, running between 1.46% and 1.67% a year. Border closures then cut net overseas migration to close to zero in 2020 and 2021. Migration and population growth rose to record levels after borders reopened: NOM peaked at 530,620 in calendar 2023, and population growth reached 2.42% that year.
By December 2025, growth had eased back to 1.51%, in line with the pre-pandemic pace of the late 2010s.
Population growth and net overseas migration in Australia, 2015 to 2025
Calendar years, annual totals from quarterly ABS data.
Source: ABS, National, state and territory population, December 2025.
Steady growth of 1.46–1.67% a year, migration a consistent contributor.
Border closures cut NOM to near zero; population growth falls to 0.43–0.56%.
Post-reopening rise: NOM reaches a peak of 530,620 in 2023, growth reaches 2.42%.
NOM falls to 300,955 in the year to December 2025; NHSAC's supply-demand shortfall narrows to 24,000 dwellings in 2025–26.
The narrower annual gap does not undo the shortfall accumulated during the 2022–24 period of high migration. A smaller annual gap adds to, rather than reverses, that earlier shortfall.
General information only
This article is a statistical reference based on publicly available government data. Figures combine several sources with different reference periods, vintages and methodologies. Data and forecasts were reviewed in July 2026 and may be revised or superseded, particularly the forward-looking migration and housing supply figures.
References
- ABS: National, state and territory population, December 2025
- ABS: Regional Population, 2024–25
- ABS: Overseas Migration, 2024–25
- ABS: Births, Australia, 2024
- ABS: Building Activity, Australia, March 2026 quarter
- ABS: Household and Family Projections, 2021 to 2046
- NHSAC: State of the Housing System 2026
- Centre for Population: 2025 Population Statement
- Australian Government: MYEFO 2025–26
- Australian Government: Budget Paper No. 1, 2026–27
Chart Snapshots