Migration and housing demand across Australia's capital cities
Net overseas migration added 302,184 people to Australia's population in 2024–25, accounting for 72.5% of total population growth that year. The eight capital cities received 258,100 people through net overseas migration, equal to 85.4% of the national total.
The latest available data, for the year ended December 2025, show that net overseas migration eased further to 300,955 people.
Share of population growth from migration, 2024–25
72.5%
302,184 of 416,740 people came from net overseas migration
Net overseas migration to capital cities, 2024–25
85.4%
258,100 of the national NOM total
Fastest-growing capital, 2024–25
Perth, +2.4%
Net overseas migration of 37,289 people during the year
Construction cost trends in Australia
How labour, materials and financing costs have moved since 2022, and what it means for the pace of new supply.
Read full article →What is driving housing demand in Australia in 2026?
How population growth, overseas migration and smaller households combine to shape the number of homes Australia needs each year.
Read full article →SECTION 01 · THE NATIONAL PICTURE
How much of Australia's population growth comes from migration
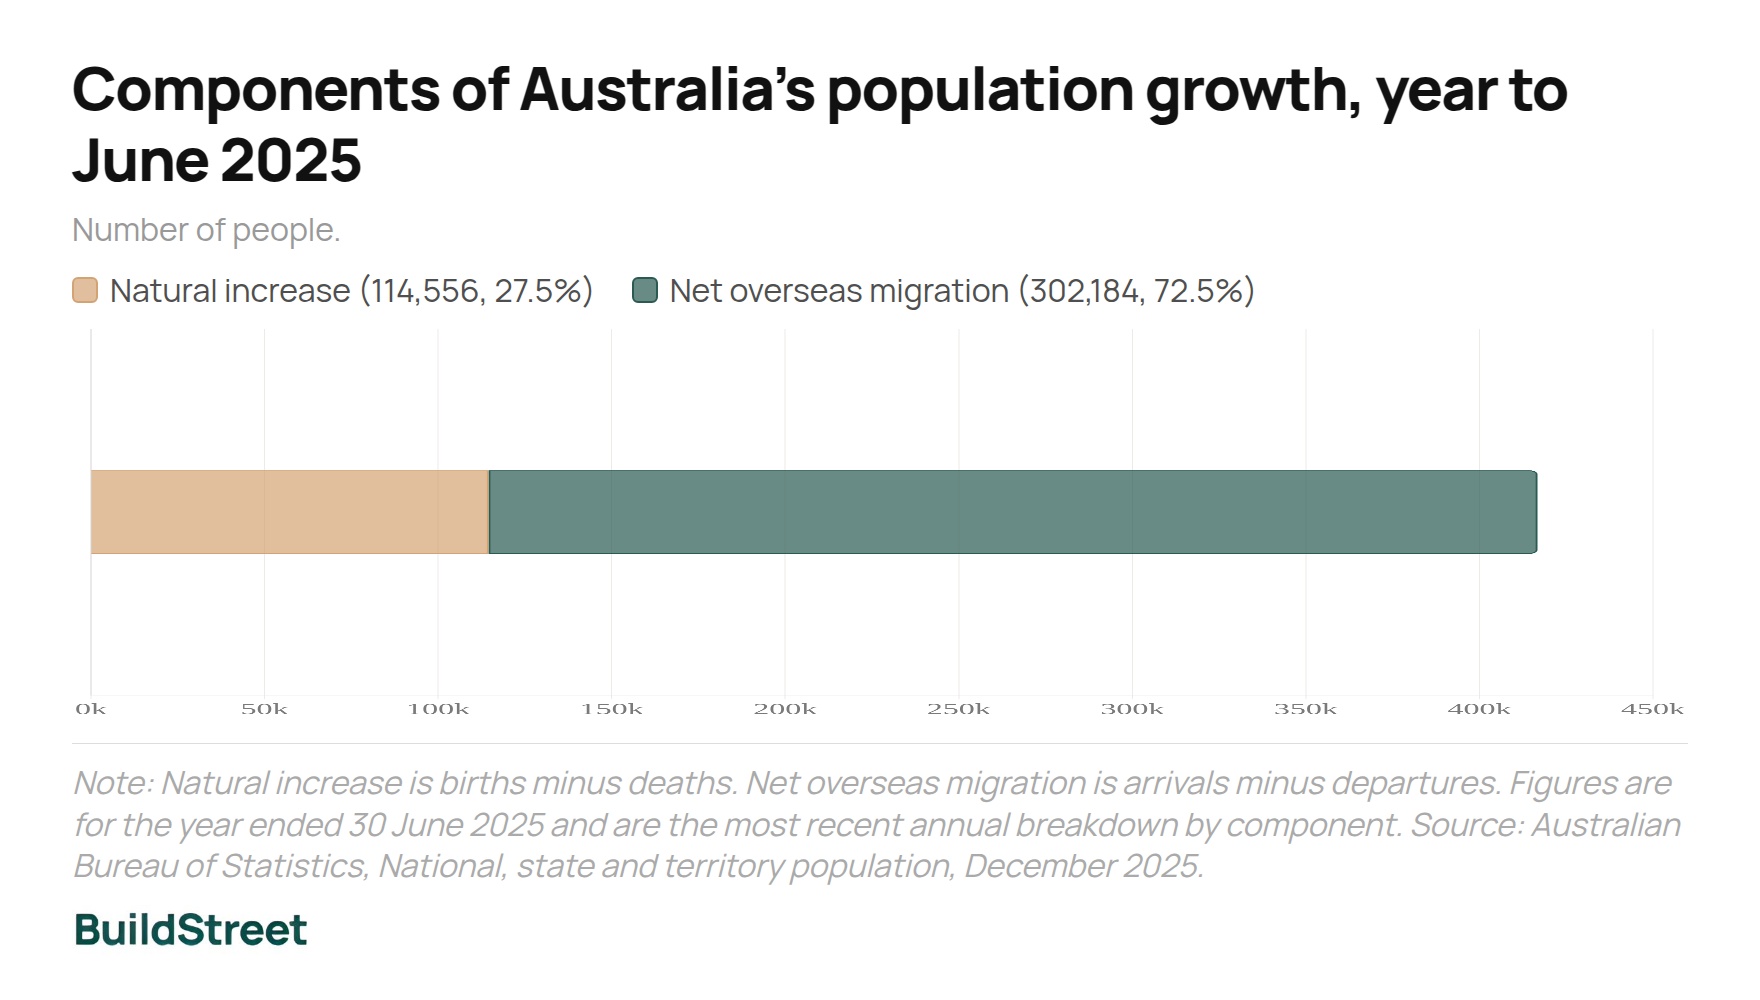
Australia's population passed 27.5 million in March 2025. In the year to June 2025, the population grew by 416,740 people: 114,556 from natural increase (births minus deaths) and 302,184 from net overseas migration. Net overseas migration therefore accounted for 72.5% of total population growth.
The shift is easiest to see against the last full pre-pandemic year. In 2018–19, natural increase accounted for 37.5% of population growth and net overseas migration for 62.5%. By 2024–25, migration's share had reached 72.5%.
Components of population growth: 2018–19 versus 2024–25
2018–19 (pre-pandemic)
2024–25 (latest financial year)
Components of Australia's population growth, year to June 2025
Number of people. Natural increase is births minus deaths; NOM is arrivals minus departures.
Year to June 2025
Source: ABS, National, state and territory population, December 2025.
Overseas migration fell to about 301,000 by December 2025
Net overseas migration fell from 429,162 in the year ended June 2024 to 302,184 in the year ended June 2025 and 300,955 in the year ended December 2025. The December 2025 figure is the most recent rolling annual estimate available.
SECTION 02 · BY CAPITAL CITY
Which capital cities received the most overseas migrants in 2024–25?
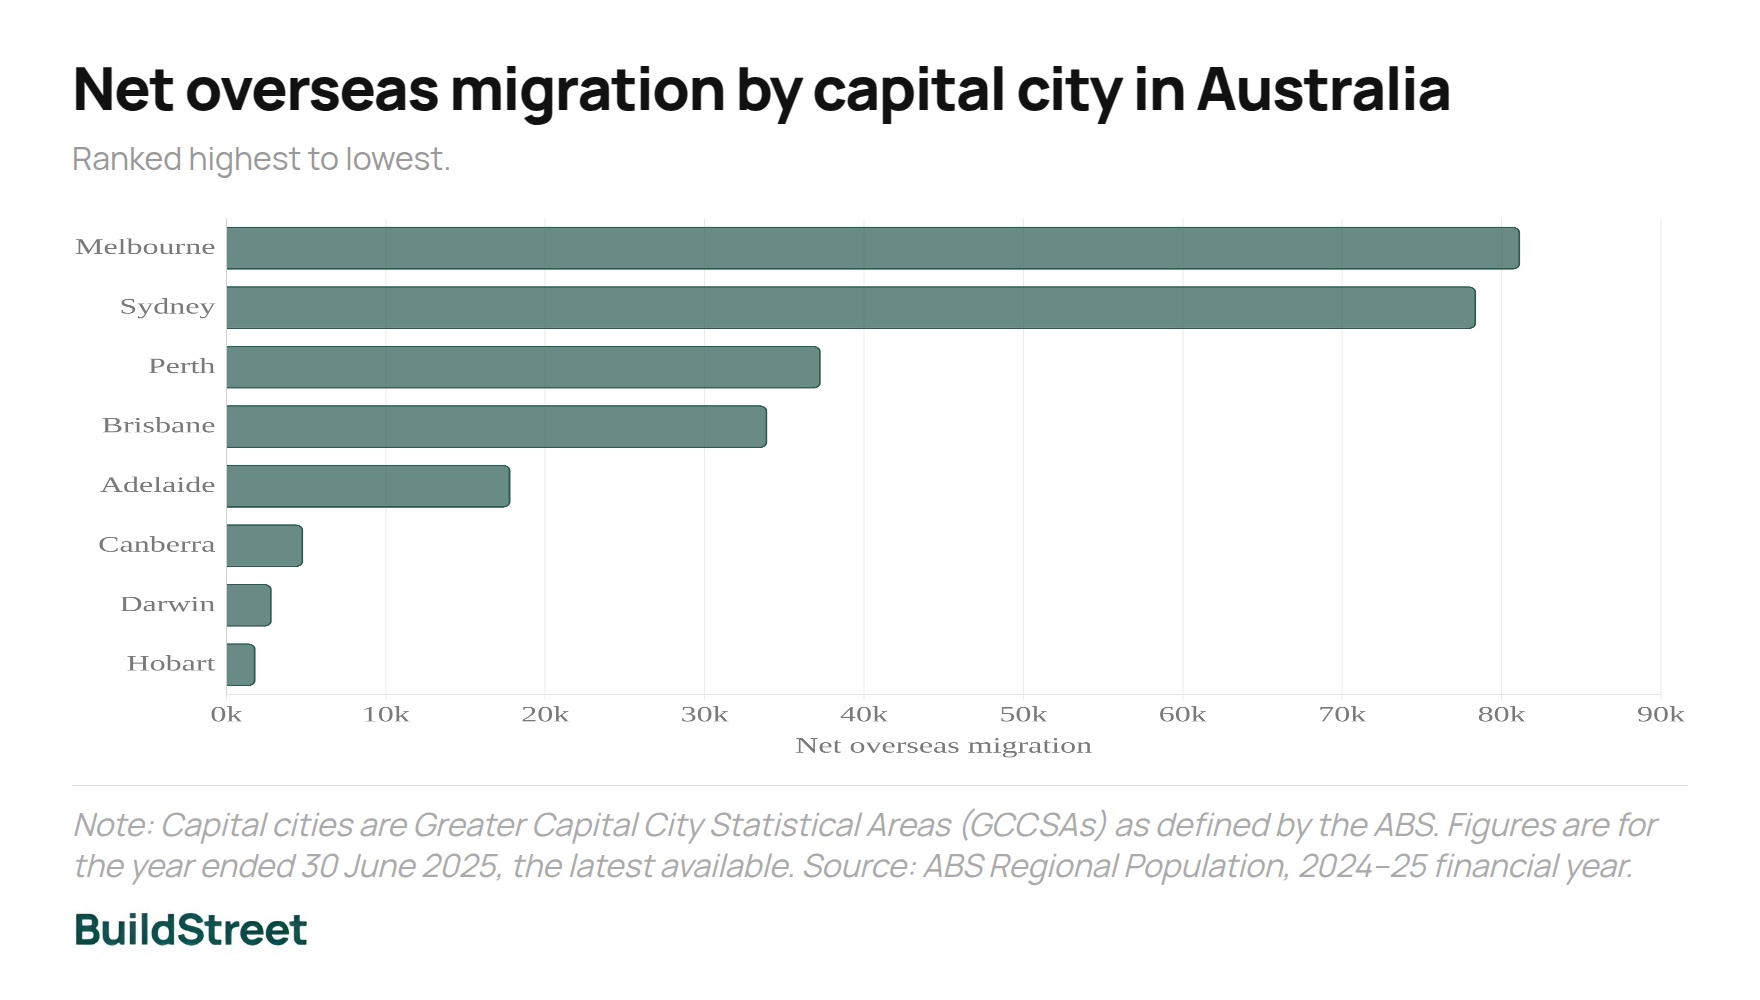
Melbourne and Sydney took in the largest numbers of migrants in 2024–25, with net overseas migration of 81,168 and 78,403 respectively. Together, the two cities accounted for 52.8% of Australia's total net overseas migration, despite accounting for about 40% of the national population.
Perth and Brisbane recorded lower migration totals but the highest overall growth rates. Perth's population grew by 2.4% in 2024–25, the fastest rate among the eight capitals, with NOM of 37,289. Brisbane grew by 2.1% with NOM of 33,934.
Net overseas migration by capital city in Australia, 2024–25
Greater Capital City Statistical Areas (GCCSAs), ranked highest to lowest.
Source: ABS Regional Population, 2024–25 financial year.
Population and components of growth by capital city, 2024–25
| Capital city | Population, 30 Jun 2025 | Growth rate | Natural | Internal | Net overseas |
|---|---|---|---|---|---|
| Melbourne | 5,435,590 | 2.0% | +32,416 | −8,554 | +81,168 |
| Sydney | 5,638,830 | 1.4% | +30,109 | −33,282 | +78,403 |
| Perth | 2,452,765 | 2.4% | +12,588 | +8,211 | +37,289 |
| Brisbane | 2,833,524 | 2.1% | +13,212 | +11,077 | +33,934 |
| Adelaide | 1,491,015 | 1.3% | +3,248 | −2,425 | +17,824 |
| Canberra | 484,630 | 1.3% | +2,882 | −1,501 | +4,819 |
| Darwin | 159,284 | 1.7% | +1,302 | −1,430 | +2,847 |
| Hobart | 255,250 | 0.2% | +587 | −1,878 | +1,833 |
| All capitals | 18,750,888 | 1.8% | +96,344 | −29,782 | +258,117 |
Source: ABS Regional Population, 2024–25 financial year. Negative internal migration means more people left for other parts of Australia than arrived.
Why migration totals and population growth rates differ by capital city
Melbourne and Sydney received the largest numbers of overseas migrants, partly reflecting their larger existing populations. Perth and Brisbane recorded lower migration totals but faster overall population growth rates because growth represented a larger share of their smaller population bases.
SECTION 03 · SETTLEMENT PATTERNS
Where overseas migrants settle and where new homes were built
Overseas migration is concentrated not only in Australia's capital cities, but also within particular parts of those cities. Centre for Population analysis found inner-city regions in Sydney, Melbourne, Brisbane and Perth received around 15% of national NOM in 2023–24, despite accounting for 5.9% of Australia's population.
Historical construction data shows a different pattern by dwelling type. ABS figures for March 2016 to December 2019 show new houses were concentrated mainly in outer suburban growth areas, while apartment completions were concentrated in inner-city locations.
In Melbourne, Cranbourne East recorded 8,377 completed houses, while the Melbourne SA2 recorded 8,533 completed apartments. Sydney showed a similar divide, with 8,034 houses in Riverstone–Marsden Park and 5,950 apartments in Waterloo–Beaconsfield.
Houses and apartments were built in different parts of the cities
House building was strongest in outer metropolitan areas, while apartment construction was concentrated closer to established city centres. This provides useful context but does not show whether construction occurred in the same locations where recently arrived migrants settled.
Why current migration and housing supply cannot be directly compared
The datasets cover different periods. The inner-city migration analysis relates to 2023–24, while the detailed small-area dwelling figures cover 2016 to 2019 and predate the post-pandemic increase in migration. No official dataset directly compares current migrant settlement locations with current dwelling completions using the same geography.
SECTION 04 · WHERE HOMES ARE BEING BUILT
Which Australian states completed the most new homes in 2024–25?
Victoria recorded the highest dwelling completions total in 2024–25, at 56,383 dwellings, followed by New South Wales at 42,725 and Queensland at 33,880. Together, the three states accounted for 75.8% of all dwellings completed nationally.
Western Australia completed 22,516 dwellings, South Australia 12,870, while the ACT, Tasmania and the Northern Territory each completed fewer than 5,000.
Dwelling completions by state and territory in Australia, 2024–25
Sum of quarterly completions (Sept 2024 to June 2025). Ranked highest to lowest.
Source: ABS Building Activity, Australia, March 2026, Table 39.
Why the figures do not show a capital-city housing supply gap
Population growth is measured at the capital-city (GCCSA) level, but dwelling completions are only published at the state and territory level. Pairing the two mixes two different geographies and can overstate or understate the true position in any individual city.
What the dwelling completion figures show
The figures show how many dwellings were completed in each state during 2024–25 and each jurisdiction's share of the national total. They do not show where within each state the dwellings were built, how many were located in the capital city, or whether construction kept pace with migration-driven population growth.
SECTION 05 · STUDENTS AND RENTAL DEMAND
International student visa numbers and rental demand in Australia
International students are one of the largest single visa categories in Australia's migration intake. There were 592,342 student visa holders onshore at 30 June 2025, down 2.6% from a year earlier. A further 228,909 people held a Temporary Graduate visa, totalling 821,251 people.
Student (subclass 500) visa holders fell to 477,890 by 31 December 2025, down 8.5% on the same date in 2024. India, China and Nepal were the three largest citizenship groups, together accounting for 45.2% of the total at 30 June 2025.
Student + Temporary Graduate visa holders, 30 June 2025
821,251
592,342 student + 228,909 Temporary Graduate visa holders
Student (subclass 500) visa holders, 31 Dec 2025
477,890
Down 8.5% on 31 Dec 2024 (522,183)
Student visa holders in Australia by citizenship, June 2025
Share of onshore student (subclass 500) visa holders.
Source: Department of Home Affairs, Student and Temporary Graduate Visa Program Report, June 2025.
Where students live is not officially published
Home Affairs visa data breaks student numbers down by nationality but not by state or city of residence. Department of Education enrolment figures can indicate where international students are enrolled, but the location of an education provider is not necessarily the same as the student's place of residence.
How rents have moved since migration surged
Rental inflation eased to 3.6% in the 12 months to May 2026, down from a peak of 7.8% in August 2023, around the time net overseas migration itself peaked. Population growth is one of several factors that can push up rental demand, though the rents index does not isolate migration's specific contribution.
Housing costs broadly, which include rents alongside electricity and new dwelling prices, were the largest single contributor to annual inflation nationally over the same period, up 6.5%.
Rents component of the CPI in Australia, annual movement
Weighted average of eight capital cities, quarterly since mid-2023.
Source: ABS Consumer Price Index, Australia, May 2026. National series; a capital-city rents breakdown is not published in the standard release commentary.
SECTION 06 · SINCE THE 2022 REOPENING
How overseas migration has changed since Australia's borders reopened
Net overseas migration eased to 192,703 in the year to June 2020, then collapsed to −84,930 in the year to June 2021, a negative annual result, as pandemic border closures cut off nearly all inbound travel.
Migration turned positive again from late 2021, reaching 207,912 in 2021–22, then 538,341 in 2022–23 — the highest financial-year figure on record. Measured on a rolling annual basis, the peak was even higher, at 555,798 in the year to September 2023.
Migration eased after that peak: 429,162 in 2023–24, then 302,184 in 2024–25 (a 29.6% fall in that year alone). The latest estimate was 300,955 in the year to December 2025.
Net overseas migration in Australia, 2018–19 to December 2025
Financial years ended 30 June, plus the year ended 31 December 2025.
Source: ABS, National, state and territory population, December 2025 and earlier releases. The 2020–21 result was a negative annual figure; the rolling annual peak was 555,798 in the year to September 2023.
Three phases of migration in Australia since the pandemic
2018–19
Pre-pandemic normal
2019–20 to 2021–22
Collapse and early recovery
2022–23 to now
Reopening, then sustained easing
Treasury forecasts overseas migration to fall further
The Australian Government's 2026–27 Budget forecasts net overseas migration of 295,000 in 2025–26, followed by 245,000 in 2026–27 and 225,000 in 2027–28. These are financial-year forecasts and are not directly comparable with the rolling annual estimate for the year ended December 2025.
SECTION 07 · WHAT COMES NEXT
What Australia's population projections mean for housing demand to 2035–36
Australia's population is projected to reach 31.5 million by 2035–36, according to the Centre for Population's 2025 Population Statement. These are projections rather than guaranteed outcomes and change as assumptions are updated.
Population growth is expected to remain concentrated in the capitals: capital-city populations are projected to grow by an average of 1.4% a year to 2035–36, compared with 0.8% for the rest of each state. Melbourne and Perth are jointly projected to record the highest annual growth rate in 2035–36, at 1.5%.
Capital city population projections, 2024–25 to 2035–36
| Capital city | Population 2024–25 | Growth 2024–25 | Projected 2035–36 | Growth 2035–36 |
|---|---|---|---|---|
| Sydney | 5,648,000 | 1.5% | 6,467,000 | 1.2% |
| Melbourne | 5,435,000 | 2.0% | 6,457,000 | 1.5% |
| Brisbane | 2,830,000 | 2.0% | 3,337,000 | 1.4% |
| Perth | 2,452,000 | 2.4% | 2,932,000 | 1.5% |
| Adelaide | 1,490,000 | 1.2% | 1,631,000 | 0.8% |
| Canberra | 485,000 | 1.4% | 561,000 | 1.3% |
| Darwin | 159,000 | 1.6% | 183,000 | 1.2% |
| Hobart | 255,000 | 0.0% | 266,000 | 0.4% |
Source: Centre for Population, 2025 Population Statement. Figures rounded to the nearest thousand as published. The 2024–25 column is a modelled estimate and will not match ABS Regional Population outcomes exactly.
Capital city population: 2024–25 modelled estimate vs 2035–36 projected
Millions of people.
Source: Centre for Population, 2025 Population Statement.
What population projections indicate about future housing demand
Sydney and Melbourne are each projected to add roughly 800,000 to a million people over the coming decade. In 2035–36, every capital except Hobart and Adelaide is projected to record annual population growth above 1%.
None of the official sources convert that population growth into a dwelling target. The projections show that growth is expected to remain concentrated in Australia's capital cities, but they do not directly measure the number, location or type of homes required.
General information only
This article summarises publicly available migration and housing statistics and does not constitute financial, legal or professional advice. Several series, particularly quarterly migration estimates, are subject to revision.
References
- ABS: National, state and territory population, December 2025
- ABS: Regional Population, 2024–25
- ABS: Overseas Migration, 2024–25
- Centre for Population: Regional Population, 2023–24
- ABS: Small Area Dwelling Completions, 2016–2019
- ABS: Building Activity, Australia, March 2026
- Home Affairs: Student and Temporary Graduate Visa Program Report, June 2025
- Home Affairs: Student and Temporary Graduate Visa Program Report, December 2025
- ABS: Consumer Price Index, Australia, May 2026
- Centre for Population: 2025 Population Statement
- Australian Government: Budget Paper No. 1, 2026–27
Chart Snapshots