Australia's average household size: what smaller households mean for housing demand
Australia's average household size was 2.5 people in the 2021 Census, down from 2.6 in 2016 after remaining at 2.6 across the previous four Censuses. The RBA's survey-based measure recorded a historic low of 2.48 in August 2022 and 2.49 in January 2023. An e61 Institute extension implies about 2.51 people per household at the end of 2024.
Smaller households mean more dwellings are needed to house the same population. No official observed figure is available for 2026, and the next Census is not expected to provide one until 2027.
Latest Census figure
2.5
Average household size, 2021 Census, down from 2.6 in 2016
RBA monthly low
2.48
Historic low, August 2022 (RBA measure, series from July 1983)
e61 end-2024 derived
~2.51
1.92 adults + 0.59 children per household, e61 rounded components
ABS 2026 projection
~2.58
Series II projection: 10.79M households / 27.80M people at June 2026
What is driving housing demand in Australia in 2026?
Population growth, overseas migration and household formation together determine how many homes Australia needs each year.
Read full article →Migration and housing demand across Australia's capital cities
How overseas migration reshapes population and housing demand in Sydney, Melbourne and the smaller capitals.
Read full article →SECTION 01 · CURRENT SNAPSHOT
What is Australia's average household size in 2026?
Different official sources give different figures because they use different methods. The 2021 Census recorded 2.5 people per household. The RBA's higher-frequency measure hit a historic low of 2.48 in August 2022 and 2.49 in January 2023. Extending that series, e61 Institute data implies about 2.51 at the end of 2024, based on 1.92 adults and 0.59 children per household. ABS Household and Family Projections imply about 2.58 for mid-2026 under the middle (Series II) scenario.
These figures are not directly comparable. The Census reading is observed, the RBA figure is survey-based, the e61 figure is derived from rounded components, and the ABS figure is projection-based rather than measured.
Key releases and moments in the household-size story
10 August 2021
2021 Census night
About two million more people were recorded at home than on 2016 Census night, reflecting where people were located under lockdown restrictions rather than a direct measure of household size.
June 2022
First 2021 Census results released
Average household size recorded at 2.5, down from 2.6 in 2016.
March 2023
RBA publishes a new monthly household size measure
Built from Labour Force Survey microdata back to July 1983, showing household size had fallen to a historic low of 2.48 by August 2022.
28 June 2024
ABS releases Household and Family Projections, 2021 to 2046
Projects total households rising from 9,993,880 in 2021 to 10,787,602 in 2026 under the middle (Series II) scenario.
May 2025
e61 Institute extends the RBA measure
Breaks household size into adults and children per household, tracking both through to the end of 2024.
11 August 2026
Next Census night
The nineteenth national Census of Population and Housing. First results are expected to be released progressively from June 2027.
SECTION 02 · LONG-RUN TREND
How Australia's average household size has changed since the 1980s
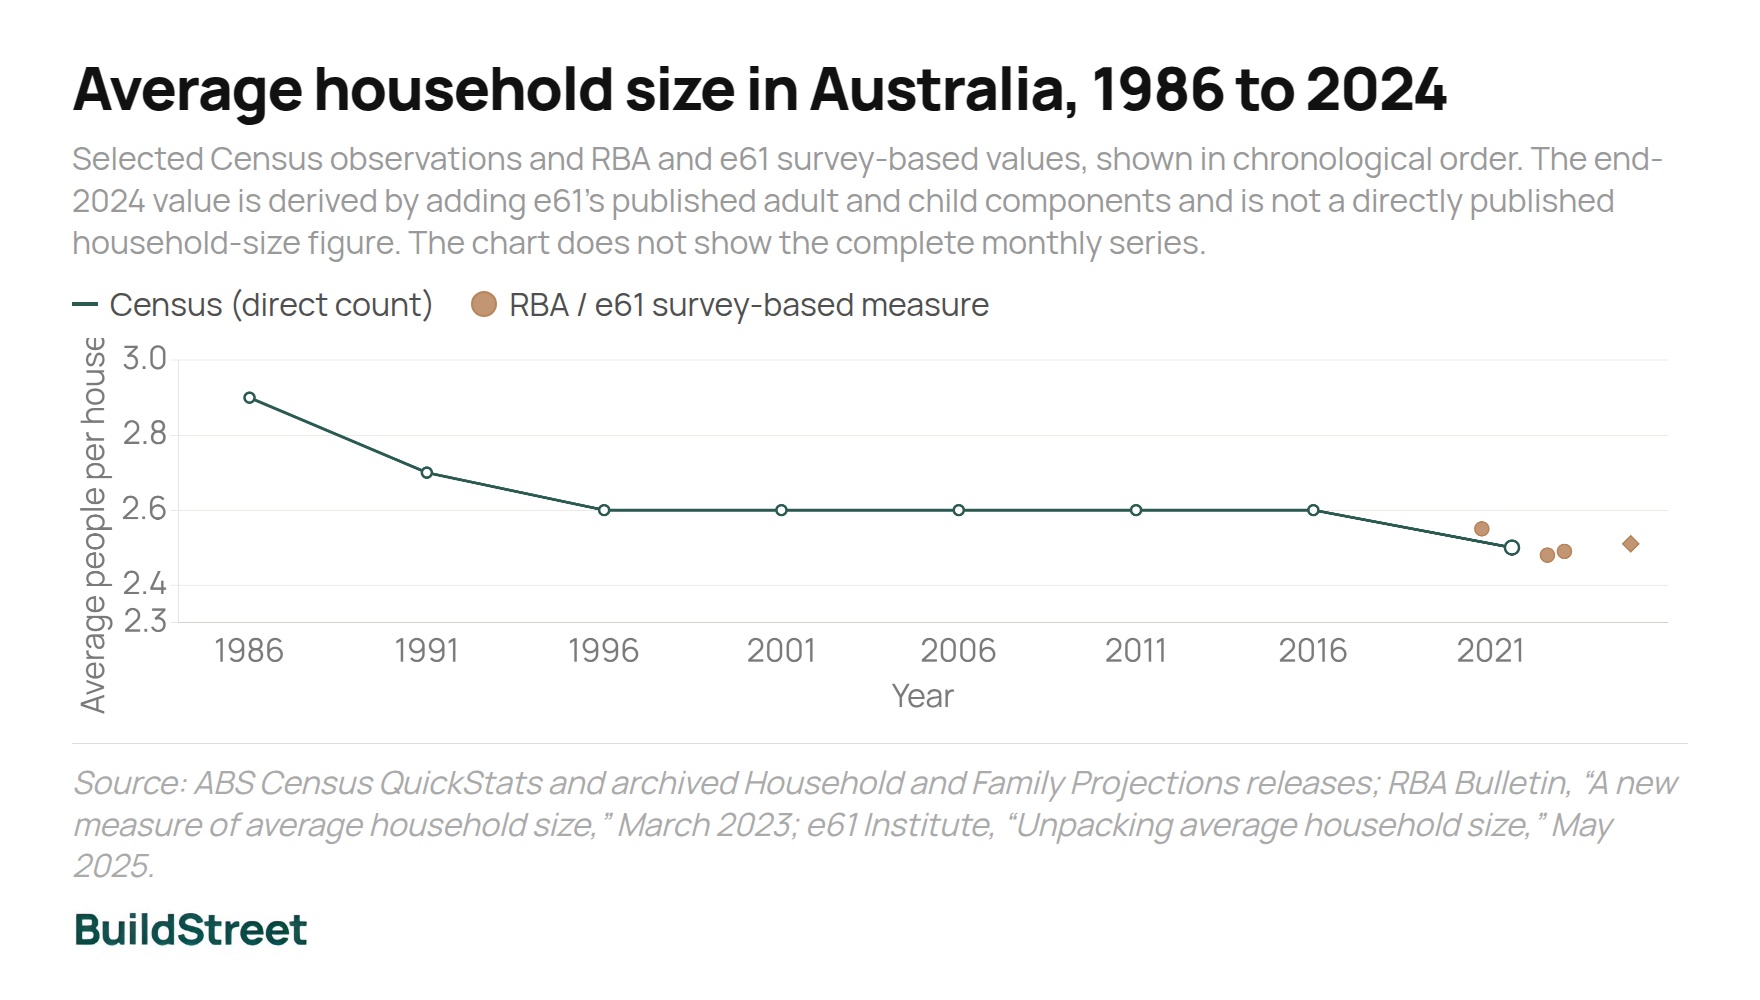
Average household size fell from 2.9 in 1986 to 2.5 at the 2021 Census, a decline of roughly 14% over 35 years. The decline was not steady: household size fell sharply through the late 1980s and 1990s, while the published Census figure rounded to 2.6 from 1996 through 2016. The RBA's higher-frequency measure then recorded a renewed decline, reaching 2.48 in August 2022.
Average household size in Australia, 1986 to 2024
Selected Census observations (line) and RBA / e61 survey-based values (dots), shown in chronological order.
Source: ABS Census; RBA Bulletin, March 2023; e61 Institute, May 2025.
Household-size data before 1996
The ABS household and family projection releases used elsewhere in this article begin in 1996, but earlier Census figures are available. Average household size was 2.9 in 1986 and 2.7 in 1991. A complete annual ABS series linking 1986 to 1996 was not identified. The RBA's monthly measure, which begins in July 1983, provides the most detailed series between Census years.
SECTION 03 · WHY IT MATTERS
Why smaller households mean Australia needs more homes
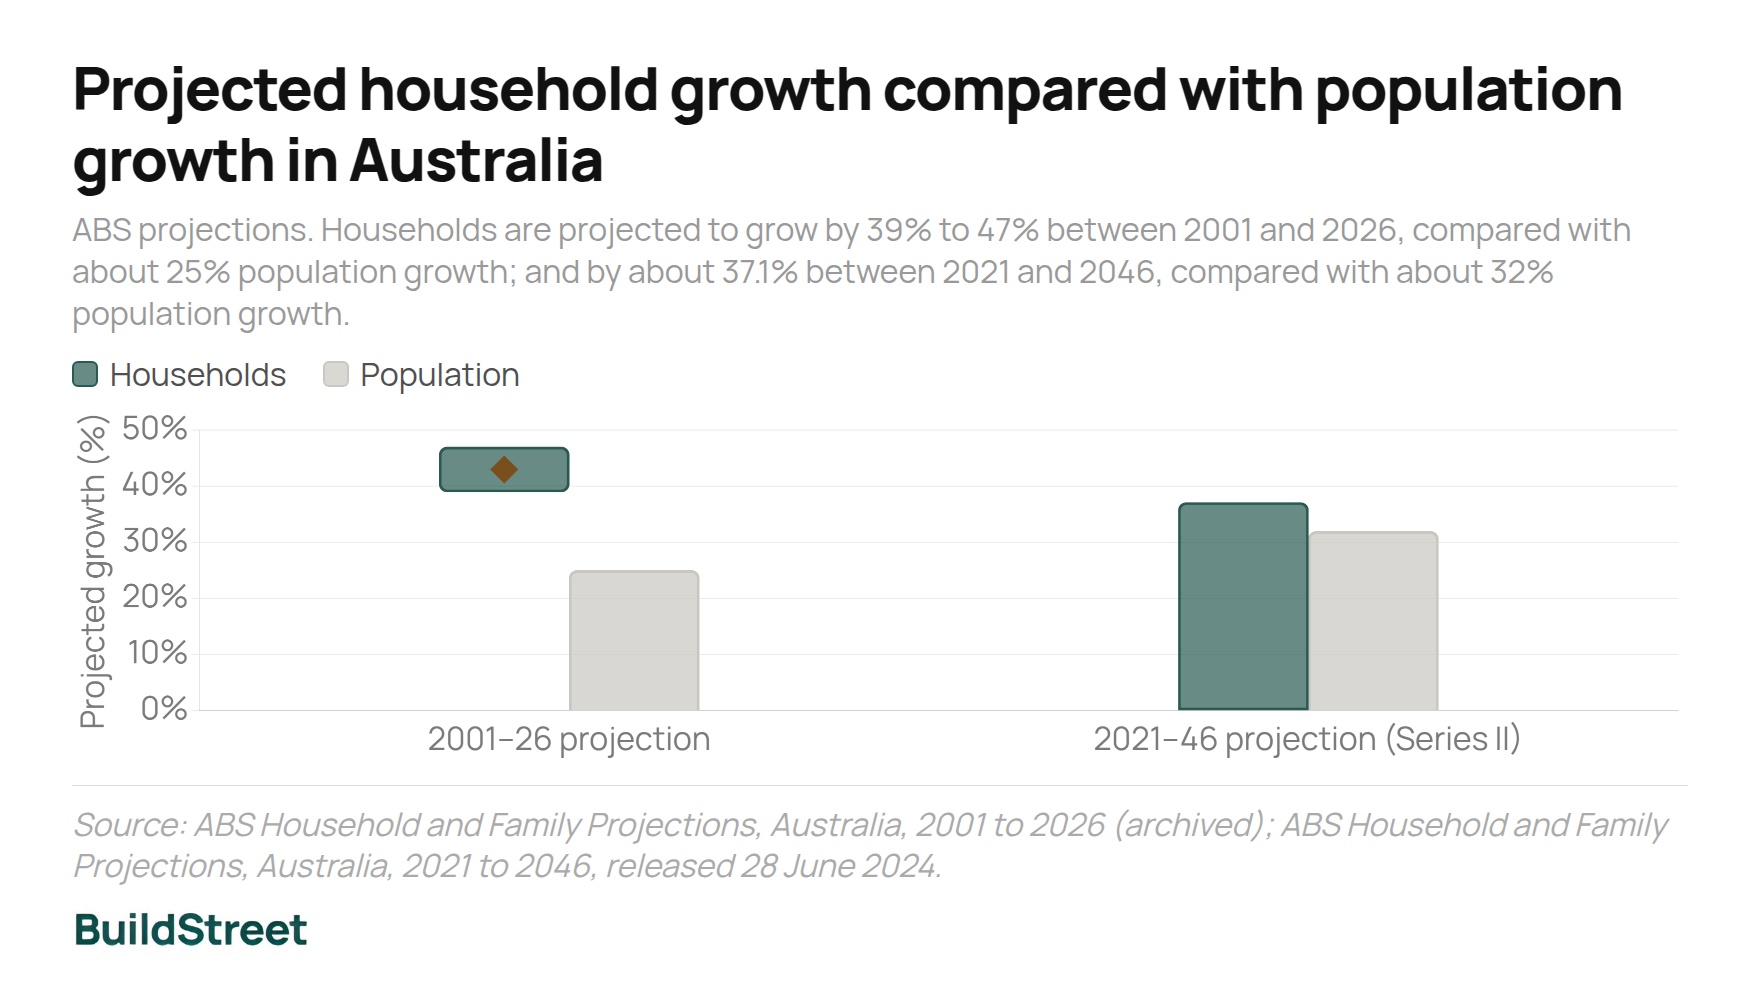
Smaller households increase housing demand because more dwellings are needed to house the same population. Households are projected to grow by about 37% between 2021 and 2046, against about 32% population growth over the same period. An earlier projection showed an even wider gap: households were projected to grow by 39–47% between 2001 and 2026, against 25% population growth.
The 2021-to-2046 figures come from households rising from 9,993,880 to 13,704,641 under the middle scenario, against population growing from 25.7 million to 33.9 million. The older 2001-to-2026 projection also expected household size to keep falling to between 2.2 and 2.3 by 2026 — the 2021 Census recorded 2.5, well above that path.
Projected household growth compared with population growth
Percent change over each projection window. Household growth outpaces population growth because average household size is projected to fall.
Source: ABS Household and Family Projections, 2001 base and 2021 base releases.
SECTION 04 · DRIVERS
What is making Australian households smaller
Long-run drivers include population ageing, lower fertility, later partnering and growth in lone-person households. Lone-person households are projected to reach about 3.79 million by 2046, up from 2.64 million in 2021 under the ABS Series II projection.
Short-run drivers include the pandemic-era shift to more space per person during 2020–22, changes in housing preferences, and — moving in the opposite direction — the tightening rental market since 2023, which has been associated with more people sharing dwellings.
Projected lone-person households in Australia, 2021 to 2046
ABS Series II projections. Lone-person households are projected to reach 3.79 million by 2046, up from 2.64 million in 2021.
Source: ABS Household and Family Projections, Australia, 2021 to 2046 (Series II).
SECTION 05 · STATE DIFFERENCES
How average household size varies across Australia's states and territories
At the 2021 Census, average household size ranged from 2.4 in South Australia and Tasmania to 2.8 in the Northern Territory. Larger households in the NT reflect its younger population and higher share of families with children, particularly in remote communities. Smaller households in South Australia and Tasmania reflect older populations and a higher share of lone-person households.
Average household size by state and territory, 2021 Census
Number of people per household. The Northern Territory sits well above the national average of 2.5.
Source: ABS 2021 Census QuickStats.
SECTION 06 · PANDEMIC EFFECT
How the pandemic changed average household size in Australia
Household size did not fall in a straight line through the pandemic. It rose about 2% between February and September 2020, then reversed hard, falling from 2.55 to a historic low of 2.48 by August 2022.
The increase in 2020 was partly associated with young adults moving back in with family: the share of 18-to-30-year-olds living with their parents climbed 5 percentage points to a historical high during the lockdown period. From late 2020 to 2022, average household size fell during a period of lower rents, stronger income growth and changing preferences for space.
Onset, Feb–Sep 2020
+2%
Household size rose during lockdowns, partly associated with young adults moving back in with family.
Trough, August 2022
2.48
Historic low in the RBA's monthly series.
Implied additional households, early 2020 to Sep 2022
~120,000
The RBA's rough estimate, based on an average household-size decline of about 1% and a population of more than 25 million.
Average household size in Australia, late 2020 to late 2024
Truncated vertical scale (2.4 to 2.6) makes small changes visible. The 2021 Census point (diamond) uses a different method.
Source: RBA Bulletin, March 2023; e61 Institute, May 2025; ABS 2021 Census.
Sydney and Melbourne drove most of the cycle
Both cities had longer, more stringent lockdowns and were more exposed to the loss of overseas migration during border closures. That produced weaker rental markets, higher vacancy rates and lower advertised rents through 2020, before tightening sharply as household size fell again from 2021.
SECTION 07 · HOUSEHOLD DEMAND
What a 0.1 change in household size means for the number of households
At Australia's estimated population on 31 December 2025 (27,801,023), a fall in average household size from 2.6 to 2.5 would mathematically imply about 428,000 additional households. A further fall to 2.4 would imply about 463,000 more. These are illustrative calculations, not forecasts of dwelling construction.
- At 2.6 people per household: about 10,692,701 households.
- At 2.5 people per household: about 11,120,409 households, or 427,708 more than at 2.6.
- At 2.4 people per household: about 11,583,760 households, or a further 463,350 more than at 2.5.
How households and dwellings are treated in this calculation
This calculation treats the number of households and the number of dwellings needed as broadly equivalent. In practice, Australia's total dwelling stock is larger than its number of occupied households because it also includes vacant dwellings, holiday homes and other non-primary residences. The figures therefore illustrate underlying household formation rather than forecast the total number of physical dwellings required.
Dwelling demand calculator
Shows the implied number of dwellings needed for Australia's population at a chosen household size, and the difference against the 2021 Census figure of 2.5.
Implied dwellings needed
11,120,409
Difference vs 2.5 (2021 Census)
+0
Source: calculation based on ABS National, state and territory population, December 2025. The slider and population field can be edited to explore other assumptions.
Data notes
About the data
Australia's average household size was 2.5 at the 2021 Census. The RBA's survey-based measure recorded 2.49 in January 2023, while e61 data implies about 2.51 at the end of 2024. Matching ABS projections imply about 2.58 for June 2026. These figures use different methods and should not be treated as directly comparable.
The cited sources do not provide:
- an observed national figure for 2026
- a single reconciled series combining the Census and RBA/e61 measures
- state-level average household size beyond the 2021 Census
General information only
This article summarises publicly available population and household statistics and does not constitute financial, legal or professional advice. Several series, particularly the RBA and e61 survey-based measures, are estimates and are not directly comparable with Census counts.
References
Chart Snapshots