Home insurance costs in Australia: premiums, location risk and price increases
Home insurance premiums in Australia rose 46.4% between 2021–22 and 2024–25, taking the national mean for combined home and contents cover to $2,360 a year. Building-only cover rose faster still, up 48.4% over the same period, while contents-only cover rose 20.1%.
The rise has not been even across the country. North Western Australia's mean premium is now more than double the rest-of-Australia rate, and insured losses from declared extreme weather events reached $4.8 billion in 2025, up 727% from 2024.
Combined home and contents, national mean
$2,360
2024–25, up 10% on the year before
Rise since 2021–22
46.4%
Combined home and contents cover
Insured losses from extreme weather, 2025
$4.8bn
Up 727% from 2024, across 294,000 claims
Building material costs in Australia
Which construction inputs are driving rebuilding costs and helping to push home insurance premiums higher.
Read full article →What does it cost to build a house in Australia?
A state-by-state breakdown of new home building costs, from land value to construction price per square metre.
Read full article →SECTION 01 · NATIONAL COSTS
What does home insurance cost in Australia in 2026?
Combined home and contents insurance costs an average of $2,360 a year, equivalent to $196.67 a month. Building-only cover averages $1,852 a year, and contents-only cover averages $531. These are the latest actual mean premiums available as at July 2026, covering the 2024–25 financial year.
Combined home and contents
$2,360
$196.67 a month, $45.38 a week
Home building only
$1,852
$154.33 a month, $35.62 a week
Home contents only
$531
$44.25 a month, $10.21 a week
| Policy type | 2024–25 mean | Monthly equivalent | Weekly equivalent |
|---|---|---|---|
| Combined home and contents | $2,360 | $196.67 | $45.38 |
| Home building | $1,852 | $154.33 | $35.62 |
| Home contents | $531 | $44.25 | $10.21 |
Monthly and weekly figures are calculated directly from the published annual mean and do not include instalment fees. Source: ACCC Insurance Monitoring Report 2026, June 2026.
These are means, not medians, and the three figures are not additive
These are mean premiums, which can be pulled upwards by high-cost policies. No Australian body has published a national median home insurance premium. Combined, building-only and contents-only premiums also come from different groups of policyholders, so a combined policy is not simply the sum of the other two.
The mean premium includes GST, stamp duty and other levies, along with commissions built into the price, but excludes any separate fees charged by a broker.
SECTION 02 · REGIONAL PREMIUMS
Home insurance premiums by region in Australia
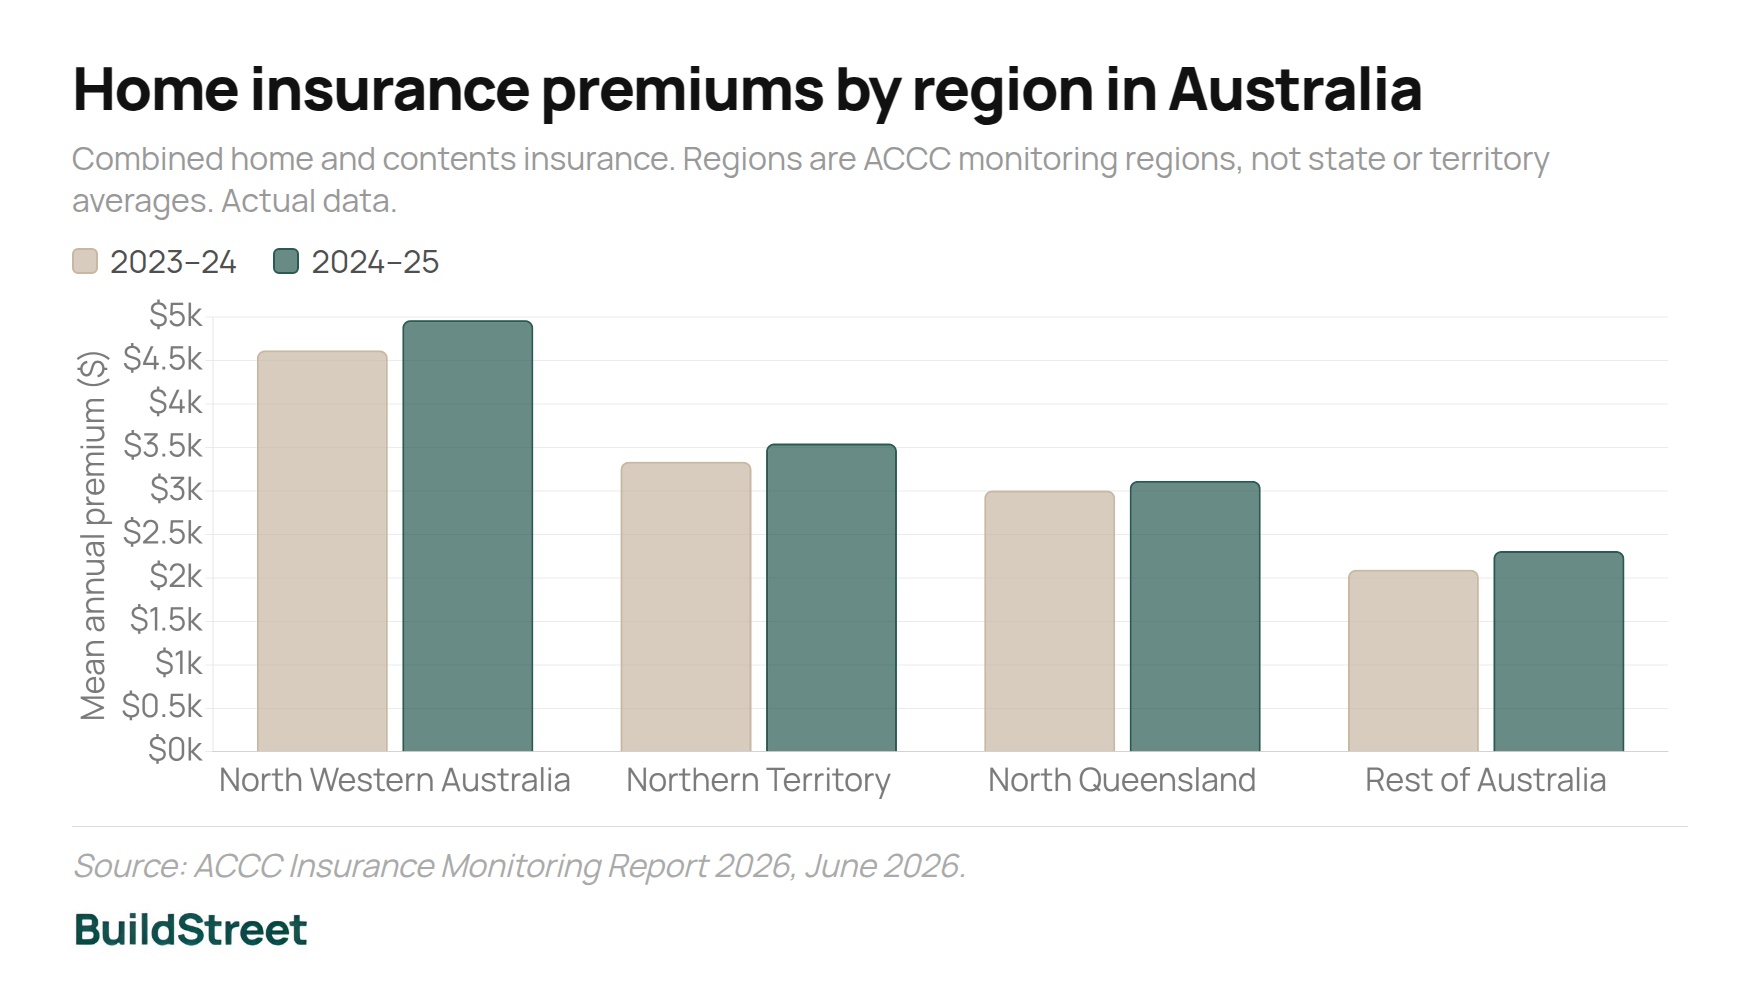
North Western Australia's mean premium reached $4,966 in 2024–25, 115% higher than the $2,310 mean for the rest of Australia. The Northern Territory averaged $3,546, and north Queensland averaged $3,117. Six of the 10 highest-premium regions nationally, measured at the SA3 level, were located in north Western Australia or the Northern Territory.
Why home insurance premiums cannot be compared by state
These figures cover four ACCC monitoring regions: north Western Australia, the Northern Territory, north Queensland, and the rest of Australia combined. Two are sub-state subsets, not state averages. No government or statutory authority publishes a comparable mean or median premium for all eight states and territories.
| ACCC region | 2023–24 | 2024–25 | Change | Per $100k, 2024–25 | Change/$100k | Notes |
|---|---|---|---|---|---|---|
| North Western Australia | $4,618 | $4,966 | +8% | $729 | +3% | 6 of 10 highest-premium SA3s nationally are in this region or the Northern Territory |
| Northern Territory | $3,337 | $3,546 | +6% | $442 | +2% | Cyclone and storm exposure are major factors |
| North Queensland | $3,006 | $3,117 | +4% | $490 | −3% | Only region where per-$100k rate fell, linked to the cyclone pool |
| Rest of Australia | $2,094 | $2,310 | +10% | $295 | +7% | Combines every area outside the three named regions |
Source: ACCC Insurance Monitoring Report 2026, June 2026.
Home insurance premiums by region in Australia
Combined home and contents insurance. Regions are ACCC monitoring regions, not state or territory averages.
North Western Australia
Source: ACCC Insurance Monitoring Report 2026, June 2026.
The rest-of-Australia region recorded the largest percentage increase in 2024–25, up 10%, even though it remains the cheapest of the four. North Queensland was the only region where the premium per $100,000 insured fell, declining 3%, with the ACCC linking the reduction to the cyclone reinsurance pool.
SECTION 03 · PREMIUM GROWTH
How much have home insurance premiums increased?
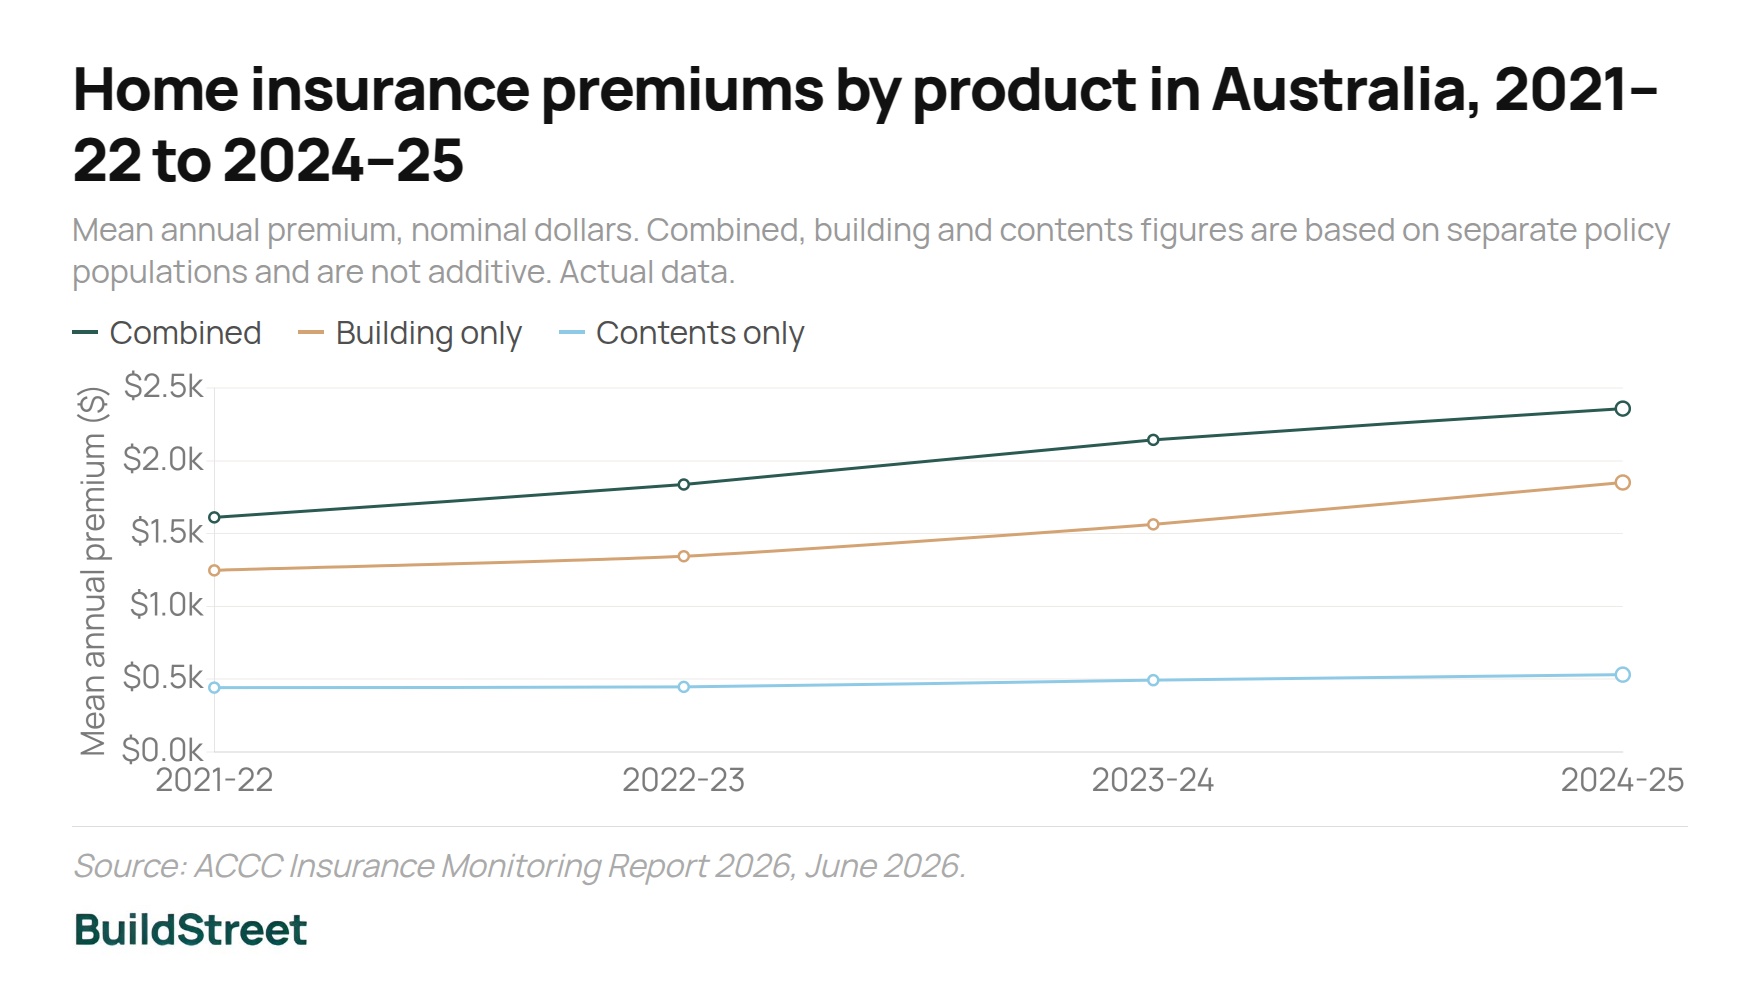
Combined home and contents premiums rose 46.4% between 2021–22 and 2024–25, from $1,612 to $2,360. Building-only cover rose slightly faster, up 48.4% from $1,248 to $1,852, the largest increase of the three product types. Contents-only cover rose the least, up 20.1% from $442 to $531.
| Policy type | 2021–22 | 2022–23 | 2023–24 | 2024–25 | Chg. 2024–25 | Chg. since 2021–22 |
|---|---|---|---|---|---|---|
| Combined home and contents | $1,612 | $1,838 | $2,145 | $2,360 | +10.0% | +46.4% |
| Home building | $1,248 | $1,345 | $1,564 | $1,852 | +18.4% | +48.4% |
| Home contents | $442 | $447 | $493 | $531 | +7.7% | +20.1% |
Home insurance premiums by product in Australia, 2021–22 to 2024–25
Mean annual premium, nominal dollars. Combined, building and contents figures are based on separate policy populations and are not additive.
Source: ACCC Insurance Monitoring Report 2026, June 2026.
Even after adjusting for inflation, the increase remains. In 2024–25 dollars, the combined mean rose from $1,841 to $2,360, a real increase of $519. Building-only cover rose from $1,425 to $1,852 in real terms, a gain of $427, while contents-only cover rose by just $26 in real terms, from $505 to $531.
A longer view: the insurance price index
Annual insurance price inflation peaked at 16.4% in the March quarter of 2024, the strongest increase since 2001, before slowing to 7.6% in March 2025 and easing further to 5.5% in the 12 months to May 2026. This broader index covers motor vehicle, house and home contents insurance combined, not home insurance alone, but it is the only price series that reaches back two decades.
Annual change in Australia's insurance price index, 2006 to 2026
March quarter each year unless noted. Covers motor vehicle, house and home contents insurance combined, not home insurance alone.
Note: The final point is the 12 months to May 2026, not a March quarter figure. Source: ABS Consumer Price Index, Australia.
SECTION 04 · COST DRIVERS
Why are home insurance costs in Australia rising?
Weather perils account for 28% of the modelled average home insurance premium, and non-weather perils such as fire and theft for another 21%. Reinsurance makes up 10%, insurer expenses 20%, and taxes, levies and government charges the remaining 21%.
What makes up the average home insurance premium in Australia
Modelled breakdown of current policies, 2024. National estimate, not an itemised bill for any individual policy.
Source: APRA, Mind the Gap: An Insurance Climate Vulnerability Assessment, March 2026.
Rebuilding costs also play a direct role. Higher sums insured contributed to premium growth in 2024–25, and rebuilding costs run higher in northern Australia because of remoteness and higher building standards. Construction cost inflation was identified as the main reason premium growth outpaced household income growth in one of two modelled stress-test scenarios.
How reinsurance costs have affected home insurance premiums
Reinsurance, the cover insurers buy against large losses, was the biggest single driver of premium increases through 2023. It contributed to the 16.4% insurance inflation peak in March 2024, and separate Actuaries Institute modelling found that increases in reinsurance costs and retentions during 2023 were the primary reason home insurance premiums outpaced household incomes in the year to March 2024.
That pressure has since eased. Reinsurance costs fell 21%, from $208 million to $164 million, in northern Australia in 2024–25. They also fell 6%, or $231 million, across the rest of Australia, the first decline outside northern Australia since 2017–18.
Why claims are the largest home insurance cost in northern Australia
In northern Australia, claims costs made up 71% of the average cost per home and contents policy in 2024–25:
- Claims, including net claims and reinsurance: 71%
- Underwriting: 18%
- Commissions: 6%
- Other costs: 5%
Declared insurance events caused $4.8 billion in insured losses in 2025
Six declared insurance events resulted in $4.8 billion in insured losses in 2025, up 727% from $585 million in 2024 and above the $2.35 billion recorded in 2023. Insurers handled 294,000 claims across the six declared events, almost six times the number recorded in 2024.
North Queensland floods
11,770 claims, $316 million in insured losses.
Ex-Tropical Cyclone AlfredHighest claim count
133,000 claims, $1.5 billion in insured losses. Impacted Queensland and northern NSW.
Mid North Coast and Hunter floods
14,700 claims, $275 million in insured losses.
Severe spring storms
41,200 claims, $895 million in insured losses. South-east Queensland and northern NSW.
Qld and NSW severe storms and hailCostliest event
92,900 claims, $1.7 billion in insured losses. Overtook Cyclone Alfred as the year's costliest single event.
Bondi event
39 claims, $0.6 million in insured losses.
Six events were declared significant or catastrophic by the Insurance Council of Australia in 2025, totalling 294,000 claims and $4.8 billion in insured losses. Source: Insurance Council of Australia, April 2026.
Queensland accounted for the largest share of the damage, recording $4.18 billion of the $4.8 billion total across 255,000 claims. New South Wales recorded $539 million across 35,000 claims. Premiums are generally based on expected future losses over the policy period, rather than losses from the most recent year alone.
How insurer profitability changed in 2024–25
Insurer profitability was under pressure before this recovery: the combined operating ratio exceeded 100% in every year from 2020–21 to 2022–23, meaning insurers were making underwriting losses on home insurance across the market.
Fifteen monitored insurers reported $14.0 billion in gross earned premium from home insurance in 2024–25, up 10% from $12.8 billion. Net profit before tax, across home, contents, strata and eligible small-business insurance combined, rose 154% to $2.8 billion, driven mainly by higher premium rates and favourable reinsurance conditions. Three of the 15 insurers still recorded net losses over the year.
Why insurer profits are not the only cause of higher premiums
Insurer profitability improved substantially in 2024–25, but several factors were working at once, including premium rates, reinsurance conditions and underwriting costs. The data does not support treating profit growth as the sole cause of higher premiums.
SECTION 05 · LOCATION AND RISK
Flood, cyclone and bushfire risk: how location affects premiums
North Western Australia's mean premium of $729 per $100,000 insured is more than double the $295 rate recorded across the rest of Australia. This gap reflects differences in exposure to flood, cyclone, bushfire, storm and hail, as well as the cost of insuring homes in higher-risk locations.
Flood risk
Flood risk affects more than half of Australian homes and is the most climate-sensitive weather peril modelled. The risk is also highly concentrated, with 50% of modelled losses occurring in just 10% of regions.
Flood is also the largest single driver of insurance affordability stress. Flood premiums make up 15% of the average premium paid by financially stressed households, compared with 2% for households that are not stressed.
No official dollar figure exists for flood cover
No official body publishes a national dollar figure for how much of a typical premium goes toward flood cover. The APRA and Actuaries Institute figures describe exposure and modelled premium shares, not an amount actually billed to households.
Cyclone risk
The Australian Government's cyclone reinsurance pool offers the clearest evidence in this data of a government intervention measurably changing prices. Since insurers began moving policies into the pool, average premiums per $100,000 insured in medium- to high-cyclone-risk areas have been 11% lower in the pool's first year and 14% lower in its second year, compared with pre-pool policies.
Change in home insurance premiums per $100,000 insured, selected Australian cities
Combined home and contents cover, since insurers joined the cyclone reinsurance pool, compared with pre-pool policies.
Note: Areas with no cyclone risk saw premiums per $100,000 insured rise 6% in the initial post-pool comparison, a different measure and period. Source: ACCC Insurance Monitoring Report 2026, June 2026.
Premium reductions in the selected cities ranged from 3% in Townsville to 15% in Karratha. All four cities were within the medium- to high-cyclone-risk band. Separate ARPC analysis using controlled building-only quotes found quotes in medium- to high-risk areas were 17% to 37% lower in January 2026 than in October 2022.
Affordability modelling provides a third measure. The gap in mean premiums between affordability-stressed and non-stressed households in cyclone-affected states narrowed in the year to March 2024:
- Queensland: from 61% to 42%
- Northern Territory: from 79% to 53%
- Western Australia: from 136% to 69%
Bushfire risk
Modelled annual bushfire losses reach $500 million. Although this is lower than the losses attributed to storm and hail, bushfire losses are highly concentrated, with around half occurring in fewer than 10% of regions. The Bushfire Resilience Rating Scheme has been associated with reductions of up to 60% in the bushfire component of premiums and total premium reductions of 5% to 21% for participating households.
Storm and hail risk
Storm and hail are the largest weather-loss category nationally, with modelled annual losses above $4 billion. Exposure is widespread, with almost every household affected to some degree, although around half of the losses are concentrated in about a quarter of Australia's regions.
SECTION 06 · AFFORDABILITY
Where home insurance affordability pressure is highest
Two separate models estimate that about 15% of their respective household populations face home insurance premiums exceeding four weeks of income. A homeowner survey provides a third measure: 45% of respondents rated their premium unaffordable or barely affordable.
How home insurance affordability is measured
The ACCC's figures come from a homeowner survey and describe how people rate their own premium. APRA's and the Actuaries Institute's figures are both modelled against an income-based threshold, a premium exceeding roughly four weeks of gross household income. APRA covers freestanding properties only; the Actuaries Institute covers all Australian households, including renters and social housing.
What Australian homeowners say about insurance affordability
A survey of 1,039 homeowners, commissioned by the ACCC and conducted by ORIMA Research between 16 January and 5 February 2026, found that 6% rated their home insurance unaffordable and a further 39% rated it barely affordable.
Medium to high cyclone risk areas
48% of respondents rated their home insurance unaffordable or barely affordable. In WA specifically, 21% rated their policy unaffordable.
Read full article →Nil to low cyclone risk areas
44% of respondents rated their home insurance unaffordable or barely affordable. In WA specifically, just 2% rated their policy unaffordable.
Read full article →What APRA estimates about uninsured homes
About 15% of households, or 1.4 million, faced premiums of at least four weeks of household income at the 2024 starting point. The assessment uses this threshold as a proxy for households that may be unable to maintain insurance. The modelling covers freestanding properties only, with the estimated uninsured share concentrated outside capital cities:
- Capital cities: about 11%
- Regional centres: around 20%
- Rural areas: around 25%
New South Wales and Queensland: about 60% of modelled uninsured homes nationally, and 90% of the 20 regions with the widest modelled gaps.
How APRA's uninsured share could change by 2050
APRA also modelled a severe but plausible scenario in which the national uninsured share rises to around 25% by 2050. Under this scenario, the share exceeds 30% in regional centres and 40% in rural areas. It is a stress test, not a forecast.
What the Actuaries Institute estimates about affordability stress
The Actuaries Institute estimated that about 15% of Australian households, or 1.61 million, faced home insurance affordability stress in the year to March 2024. This was up from 12% in 2023 and 10% in 2022. Affordability-stressed households spent an average of 9.6 weeks of gross income on home insurance, around seven times more than other households.
Share of Australian households facing home insurance affordability stress, by state
Year to March 2024. Affordability stress: a premium exceeding four weeks of gross household income.
Source: Actuaries Institute, Home Insurance Affordability and Home Loans at Risk, August 2024.
Queensland recorded the highest share of affordability-stressed households at 24%, followed by the Northern Territory at 19% and New South Wales at 17%. The Australian Capital Territory recorded the lowest share, at 5%. Local-area modelling shows the most extreme pressure concentrated in regional Western Australia, the Northern Territory, southwest Queensland and the Northern Rivers region of New South Wales.
The same study estimated that about 5% of Australian households with a mortgage were experiencing extreme insurance affordability pressure as at March 2024. These households represented $57 billion in loan balances, equivalent to 3% of all home loan assets.
SECTION 07 · COST OF OWNERSHIP
How home insurance adds to the cost of owning a home
Combined home and contents cover adds an average of $2,360 a year to the cost of owning a home, or $196.67 a month. Building-only cover adds $1,852 a year, or $154.33 a month. Home insurance is a recurring cost that sits alongside mortgage repayments, council rates, maintenance and utilities.
National combined mean, monthly
$196.67
2024–25, combined home and contents
North Western Australia, monthly
$413.83
More than double the national figure
In the highest-cost region, the recurring amount is far larger. North Western Australia's combined mean of $4,966 a year works out to $413.83 a month. The Northern Territory's mean equates to $295.50 a month, and north Queensland's to $259.75 a month.
Home insurance can also affect access to housing finance. Lenders generally require adequate building insurance before accepting a property as security for a home loan. Reduced insurance availability or coverage may therefore limit the pool of eligible buyers, restrict lending and increase credit risk when an uninsured property is damaged.
Why building insurance is based on rebuilding cost, not market value
Under Moneysmart guidance, building cover is intended to reflect the full cost of rebuilding a home, rather than its sale price. Rebuilding costs can include items such as landscaping, rubbish removal and solar panels. This helps explain why changes in insurance premiums do not necessarily follow movements in property prices.
Why Australia has no official measure of total home ownership costs
No official measure combines a property's insurance premium with mortgage interest, council rates, maintenance and utilities into a single total cost of ownership figure. The figures above describe one recurring cost, not a complete picture of what it costs to own a home.
General information only
This article is for general information only. It summarises publicly available insurance data and statistics and does not constitute financial, insurance or professional advice. Sources and figures were current as at the date of publication. Premiums, government schemes and eligibility criteria may change over time.
References
- ACCC, Insurance Monitoring Report, June 2026
- ABS, Consumer Price Index, Australia, May 2026
- APRA, Mind the Gap: An Insurance Climate Vulnerability Assessment, March 2026
- ARPC, Cyclone Reinsurance Pool Premium Assessment, May 2026
- NEMA, The Rating Scheme Helping Households Stay Safe and Save Money, July 2026
- ASIC Moneysmart, Choosing Home Insurance, accessed July 2026
- Insurance Council of Australia, Hail Events Push Extreme Weather Costs to $4.8 Billion in 2025, April 2026
- Actuaries Institute, Home Insurance Affordability and Home Loans at Risk, August 2024
Chart Snapshots