How many Australians own investment properties, and how that's changed since 2010
Australian Taxation Office data shows that 2.34 million individual taxpayers held an interest in a rental property in 2023–24, up 32.3% from 1.77 million in 2010–11. A separate Australian Bureau of Statistics household survey recorded 2.02 million households owning one or more residential properties other than their usual residence in 2019–20. This is a related but different measure.
New South Wales and Victoria have the largest and fastest-growing investor populations when investors are classified by the address recorded on their tax returns. Investor loan commitments have also exceeded owner-occupier first home buyer commitments in every quarter since the June quarter of 2021.
Individual investors
2.34 million
Individuals with an interest in a rental property, 2023–24
ATO · 2023–24Growth since 2010–11
+32.3%
Rise in individual investor numbers, 2010–11 to 2023–24
ATO · 2010–11 to 2023–24Leading state
NSW, 35.3%
Share of individual investors whose address is in NSW, 2023–24
ATO · 2023–24Investor share of new lending
41.0%
Share of new dwelling loan commitments by number, March quarter 2026
ABS · March quarter 2026First home buyer support in Australia
How many first home buyers are entering the market, what help is available, and how their share of new lending stacks up against investors.
Read full article →What is driving housing demand in Australia?
Population growth, household formation and lending flows, and how these shape demand for new and existing homes.
Read full article →SECTION 01 · SCOPE
How many Australians own an investment property?
Australian Taxation Office data shows that 2,335,540 individuals had an interest in a rental property in 2023–24. This is the latest annual figure in the ATO series, which begins in 1999–2000.
A separate Australian Bureau of Statistics household survey recorded 2.02 million households owning one or more residential properties other than their usual residence in 2019–20, equal to 21% of all Australian households.
These are two different official measures of related but separate populations, and they should not be added together or used interchangeably:
- ATO measure: individuals with a solely or jointly owned rental property interest, including properties bought or sold during the year.
- ABS measure: households, not individuals. This measure is broader than investment property ownership because it includes properties used for other purposes, such as holiday homes.
ATO taxpayer measure
2,335,540
Individuals with a solely or jointly owned interest in a rental property, including properties bought or sold during the year
ATO · 2023–24, published 17 June 2026ABS household measure
2.02 million
Households owning one or more residential properties other than their usual residence, including holiday homes and other non-rental uses
ABS · 2019–20, the latest availableSource: Australian Taxation Office, Taxation statistics 2023–24; Australian Bureau of Statistics, Housing Occupancy and Costs, 2019–20 financial year.
Why is there no single official property investor count
The ATO measure counts individuals, and the ABS measure counts households, so the two figures cannot be added or substituted for each other. The latest comparable household estimate remains from 2019–20. The ABS has confirmed that statistics from the 2023–24 Survey of Income and Housing will not be released, so a more recent figure from this survey series is not currently available.
SECTION 02 · GROWTH
How property investor numbers have changed since 2010
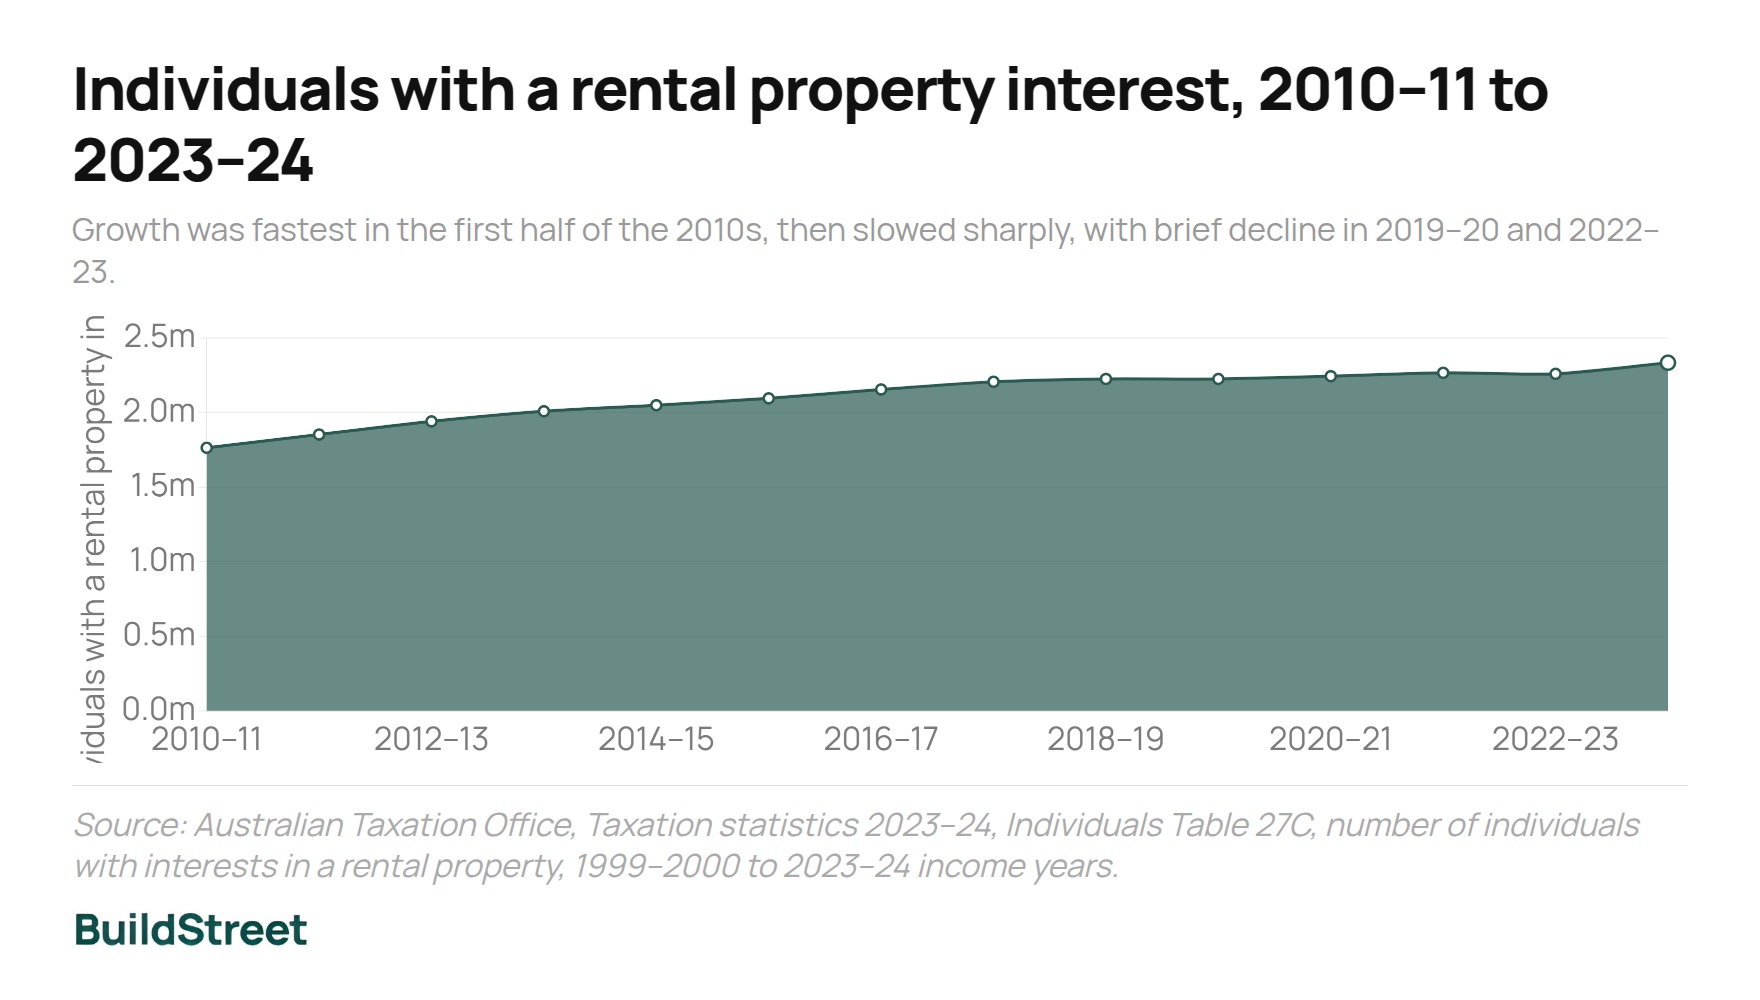
The number of individual taxpayers with a rental property interest has risen in most years since 2010–11. It grew from 1,765,130 in 2010–11 to 2,335,540 in 2023–24, an increase of 570,410 people, or 32.3%, over 13 years.
The growth was not steady. It moved in phases:
- 2010–11 to 2018–19: most of the 13-year increase happened during this period, with investor numbers rising by around 26%.
- 2018–19 to 2019–20: numbers were almost unchanged, declining by 333, from 2,227,174 to 2,226,841.
- 2021–22 to 2022–23: investor numbers recorded another decline, from 2,268,161 to 2,261,080, a fall of about 0.3%.
- 2023–24: numbers rose again, increasing by 3.3% from the year before.
Growth was fastest in the first half of the 2010s and has slowed considerably since.
Individuals with a rental property interest, 2010–11 to 2023–24
Growth was fastest in the first half of the 2010s, then slowed sharply, with brief declines in 2019–20 and 2022–23.
Source: Australian Taxation Office, Taxation statistics 2023–24, Individuals Table 27C.
The ABS household measure shows a similar broad trend over a different and shorter period. Households owning one or more residential properties other than their usual residence rose from about 1.5 million in 2013–14 to 2.02 million in 2019–20, an increase of around 520,000 households, or roughly 35%.
Because this measure includes holiday homes and other non-rental properties, it is not a direct read on investor numbers. However, it follows the same broad direction as the ATO series during the period covered by both measures.
SECTION 03 · PORTFOLIOS
How many properties do investors typically own?
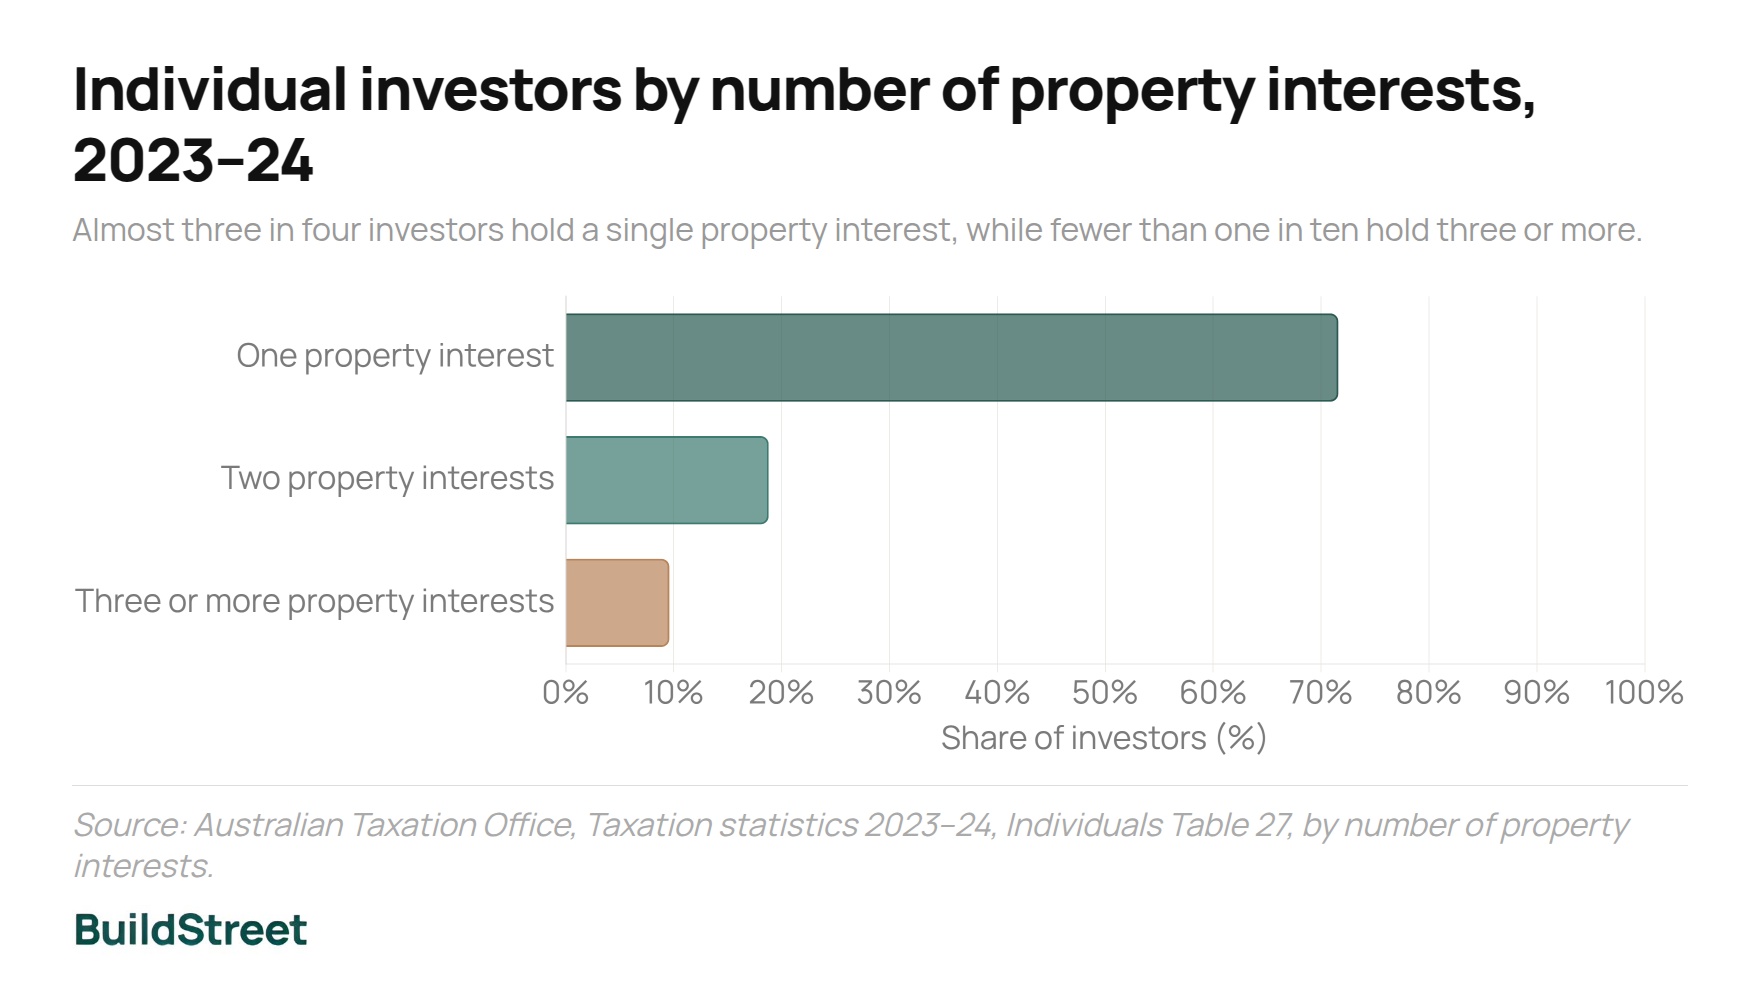
Most individual investors hold only one rental property interest, and that pattern has changed little as total investor numbers have grown. In 2023–24, 71.6% of investors had one property interest, 18.8% had two, and 9.6% had three or more.
Individual investors by number of property interests, 2023–24
Almost three in four investors hold a single property interest, while fewer than one in ten hold three or more.
Source: Australian Taxation Office, Taxation statistics 2023–24, Individuals detailed tables.
One property interest
1,672,616
71.6% of individual investors, 2023–24
Two property interests
438,906
18.8% of individual investors, 2023–24
Three or more
224,018
9.6% of individual investors, 2023–24
Source: Australian Taxation Office, Taxation statistics 2023–24, Individuals detailed tables.
SECTION 04 · GEOGRAPHY
Which Australian states have the most property investors?
New South Wales has the largest individual investor population of any state or territory, and the Northern Territory has the smallest:
- New South Wales: 824,638 investors, or 35.3% of the national total, the largest share of any state or territory.
- Victoria: 599,917 investors (25.7%), the second-largest total. Together, Victoria and New South Wales account for around 61% of all individual investors.
- Tasmania: 1.6% of the total, the second-smallest share, just ahead of the NT.
- Northern Territory: 19,545 individuals, or 0.8% of the total, the smallest share of any state or territory.
New South Wales and Victoria also recorded the fastest growth in investor numbers since 2010–11. Victoria's investor population increased by 44.7% and New South Wales's increased by 41.3%, both above the 32.3% national average. Western Australia and the Northern Territory recorded little or negative growth over the same 13 years.
This breakdown is based on the ATO's state and territory breakdown of individuals with rental property interests, which records the investor's own address, not the location of the property itself.
Individual investors by state or territory, 2023–24
NSW and Victoria together account for around 61% of individual investors. Overseas and unknown addresses (about 3%) are excluded.
Source: Australian Taxation Office, Taxation statistics 2023–24, Individuals Table 27C, by state or territory.
Queensland property investor numbers increased by 13.1% since 2010–11
Growth has not simply tracked the size of each state's investor population. Queensland, which had the third-largest investor population at 384,251, grew by just 13.1% between 2010–11 and 2023–24. This was slower than South Australia's 16.8%, even though South Australia has fewer than half as many investors.
Victoria and New South Wales were the only jurisdictions to grow faster than the 32.3% national average. The ACT and Tasmania also recorded substantial growth, but remained below the national rate, while Western Australia and the Northern Territory recorded next to no growth or an outright decline over the same 13 years.
| State | 2010–11 | 2023–24 | Change |
|---|---|---|---|
| Victoria | 414,590 | 599,917 | +44.7% |
| New South Wales | 583,764 | 824,638 | +41.3% |
| ACT | 39,447 | 50,945 | +29.1% |
| Tasmania | 28,333 | 36,284 | +28.1% |
| South Australia | 116,215 | 135,701 | +16.8% |
| Queensland | 339,718 | 384,251 | +13.1% |
| Western Australia | 213,398 | 212,926 | −0.2% |
| Northern Territory | 20,496 | 19,545 | −4.6% |
Source: Australian Taxation Office, Taxation statistics, Individuals Table 27C, by state or territory, 2010–11 and 2023–24 income years. Overseas and unknown addresses are excluded.
Why investor location does not show where rental properties are located
The investor headcount used here is classified by the address on the individual's tax return, not by the location of the rental property. The ATO separately publishes rental property schedule items by the property's state or territory in Individuals Table 26, but those records should not automatically be treated as a deduplicated count of unique investment properties. A separate ABS measure of household residence points the same way: in 2019–20, owning households were most likely to live in NSW (33%) or Victoria (29%).
SECTION 05 · PROFITABILITY
How many Australian property investors reported a rental loss?
Slightly more than half of individual investors reported a net rental loss in 2023–24, a reversal from the year before:
- Investors in net rental loss, 2023–24: 1,266,454 of 2,335,540 (54.2%).
- Average net rent, 2022–23: a profit of $704.
- Average net rent, 2023–24: a loss of $1,174.
- Share reporting a net rental loss over time: 58.6% in 2018–19, falling to a low of 41.9% in 2021–22, then rising back above half in 2023–24.
The net rental loss count provides related context for negative gearing, but it is not the same measure. A property is negatively geared when it is bought with borrowed funds and its rental income is less than its deductible expenses, including interest on the borrowings; the resulting net rental loss may be deductible against rental and other income, subject to the tax rules.
The ATO does not publish a standalone headcount of negatively geared investors as a named series. The net rent loss and net rent neutral-or-profit figures describe this broader outcome rather than a confirmed negative-gearing count, because a net rent loss can arise from any deductible expense, not loan interest alone.
Net rent measures taxable rental income less deductible rental expenses. It is not a measure of an investor's total return and does not include capital gains or losses. The change in average net rent therefore does not show whether investors' overall returns increased or decreased.
Individuals by net rent position, 2018–19 to 2023–24
Each bar shows the full investor population for that year, split between individuals reporting a net rental loss and those reporting a neutral or profitable result.
Source: Australian Taxation Office, Taxation statistics 2023–24, Individuals Table 27A.
Average net rent, 2022–23
+$704
The average net rent reported by individuals was a small profit.
Average net rent, 2023–24
−$1,174
The average result swung to a loss the following year.
One-year swing
$1,878
The average reported net rent moved by this amount, from a profit to a loss.
Source: Australian Taxation Office, Taxation statistics 2023–24, Individuals Table 27A, average overall net rental income per person, 2022–23 and 2023–24 income years.
Why net rental loss is not a negative-gearing headcount
Because the ATO does not publish a labelled negative-gearing count, this section reports the number of individuals with a net rental loss as a related but broader measure. It should not be read as a confirmed count of negatively geared investors.
SECTION 06 · LENDING
Investor and owner-occupier home lending in Australia: March quarter 2026
In the March quarter of 2026, the ABS recorded 139,794 seasonally adjusted new loan commitments for dwellings in Australia, excluding refinancing:
- By number: 82,453 commitments were for owner-occupiers, and 57,342 were for investors, a split of 59.0% owner-occupier to 41.0% investor.
- By value: new dwelling loan commitments totalled $103.0 billion, including $61.4 billion for owner-occupiers and $41.5 billion for investors — a split of 59.7% to 40.3%.
Why the published lending figures may not add exactly
The ABS seasonally adjusts each component series separately; the published components may not sum exactly to the total. Dollar components may also differ from the published total because of rounding.
Owner-occupier and investor shares of new dwelling loan commitments, March quarter 2026
Investors accounted for a smaller share of new lending than owner-occupiers overall, but recorded stronger annual growth in both number and value.
Source: Australian Bureau of Statistics, Lending indicators, March quarter 2026.
Commitments declined for both borrower groups between the December quarter of 2025 and the March quarter of 2026. Investor commitments fell by 5.3% by number and 3.0% by value, while owner-occupier commitments fell by 6.9% by number and 4.3% by value.
Over the year to the March quarter of 2026, investors recorded the stronger growth. Investor loan commitments increased by 18.8% by number and 25.3% by value. Owner-occupier commitments grew more slowly, increasing by 2.5% by number and 14.3% by value.
What new loan commitments measures
Loan commitments are new lending flows accepted by borrowers during the quarter. They are not a measure of the total stock of mortgages outstanding, and they do not represent property sales or ownership transfers directly.
SECTION 07 · COMPETITION
Investor home loans compared with first home buyer loans in Australia
The latest seasonally adjusted ABS data shows that investor loan commitments substantially exceeded owner-occupier first home buyer commitments in the March quarter of 2026. Investors recorded 57,342 new dwelling loan commitments, while owner-occupier first home buyers recorded 30,241, a gap of 27,101 loans.
By number, March quarter 2026
Investor loan commitments exceeded owner-occupier first home buyer commitments
Investors accounted for 41.0% of all new dwelling commitments by number, compared with 21.6% for owner-occupier first home buyers.
Official · ABS, March quarter 2026By value, March quarter 2026
Investor lending was more than twice as high by value
Investors recorded $41.5 billion in new dwelling commitments, against $17.9 billion for owner-occupier first home buyers, a difference of $23.6 billion. Investors accounted for 40.3% of new lending by value, compared with 17.4% for first home buyers.
Official · ABS, March quarter 2026Investor and first home buyer lending have changed places twice since 2019
The ABS quarterly series shows the two groups have swapped places twice in recent years.
Sep qtr 2019 – Mar qtr 2020
Investor lending was higher
Investor commitments exceeded owner-occupier first home buyer commitments in each of the first three available quarters of the series.
Jun qtr 2020 – Mar qtr 2021
First home buyer lending moved ahead
Owner-occupier first home buyer commitments exceeded investor commitments from the June quarter of 2020 through the March quarter of 2021.
Jun qtr 2021 onward
Investor lending moved back ahead
Investor commitments moved back above owner-occupier first home buyer commitments in the June quarter of 2021 and remained higher in every subsequent quarter through to the March quarter of 2026.
Source: Australian Bureau of Statistics, Lending indicators, March quarter 2026, quarterly time series.
About the data
The ATO and ABS figures measure different populations and should not be added together. The ATO counts individuals with a rental property interest, while the ABS counts households owning residential property other than their usual residence.
Official data does not include:
- a single combined property investor figure
- a national count of negatively geared investors
- a deduplicated count of investment properties by location
- a Survey of Income and Housing update beyond 2019–20
Loan commitments measure new lending flows, not the total stock of mortgages, property sales or ownership transfers.
General information only
This article is based on published data from the Australian Bureau of Statistics and the Australian Taxation Office. It is general information only and does not constitute financial, investment, taxation or legal advice. Where an official measure was not available, the article notes the gap rather than estimating a figure.
References
- ABS, Housing Occupancy and Costs, 2019–20 financial year
- ABS, Survey of Income and Housing results will not be released, media statement, 17 July 2025
- ABS, Lending indicators, March quarter 2026
- ATO, Taxation statistics 2023–24, Individuals detailed tables (Tables 26, 27A, 27C)
- ATO, Rental properties 2025 guide, other tax considerations
Chart Snapshots