

Published
- Mean dwelling price, Australia, June quarter 2026
- $1,100,400
- ABS Total Value of Dwellings, preliminary; all dwellings in the stock
- Average house price, Malaysia, June quarter 2026
- RM506,317
- About A$178,000; preliminary NAPIC average for all house types
- Average transaction price, existing flats, Warsaw, Q2 2026, per m²
- 16,723 zł
- About A$6,236 per m²; National Bank of Poland, March to May 2026
- Annual change in nominal residential property prices, Australia, June quarter 2026
- 8.3%
- BIS index; Thailand 2.4%, Malaysia 0.9%, Poland 6.0% to the March quarter
 How does housing affordability in Australia compare internationally?Price-to-income and rent-to-income ratios for Australia and comparable economies, and how affordability has changed since 2000.
 Cost of living overseas vs AustraliaWorld Bank price levels for household spending in Thailand, Malaysia and Poland, and how exchange rates have moved since 2021.
Section 01 · Australian prices
What is the average dwelling price in Australia?
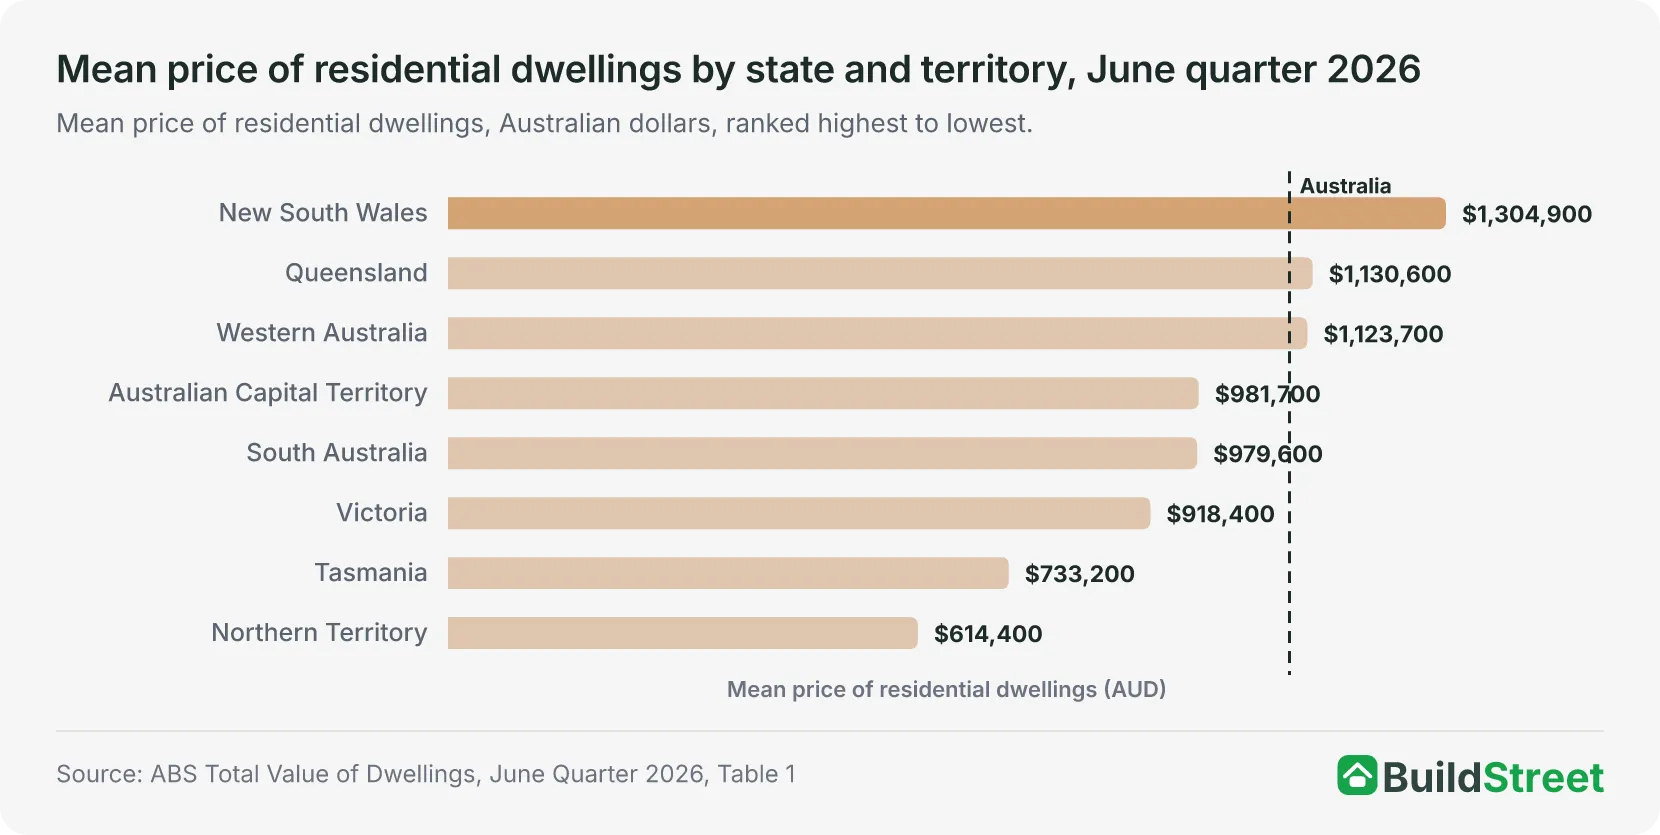
Australia's mean price of residential dwellings was $1,100,400 in the June quarter 2026, according to the Australian Bureau of Statistics (ABS) Total Value of Dwellings data1. The mean price fell by $8,200 from $1,108,600 in the March quarter 2026, which was the highest mean price recorded since the data began in September 2011.
The June quarter 2026 estimates are preliminary and subject to revision. The next release, for the September quarter 2026, is due on 1 December 20261.
Over the year to the June quarter 2026, the mean price rose by $70,500, or 6.8 per cent, from $1,029,900 in the June quarter 20251.
The mean price in the June quarter 2026 was 2.24 times the $490,800 recorded in September 20111.
The ABS calculates the mean price by dividing the total value of residential dwellings, $12,688.9 billion, by the number of dwellings, 11,531,1001. This includes all dwellings in Australia, not just homes sold during the quarter.
The ABS also publishes median sale prices for capital cities and the rest of each state, but not a national median. A small number of expensive properties can raise the average above the middle price.
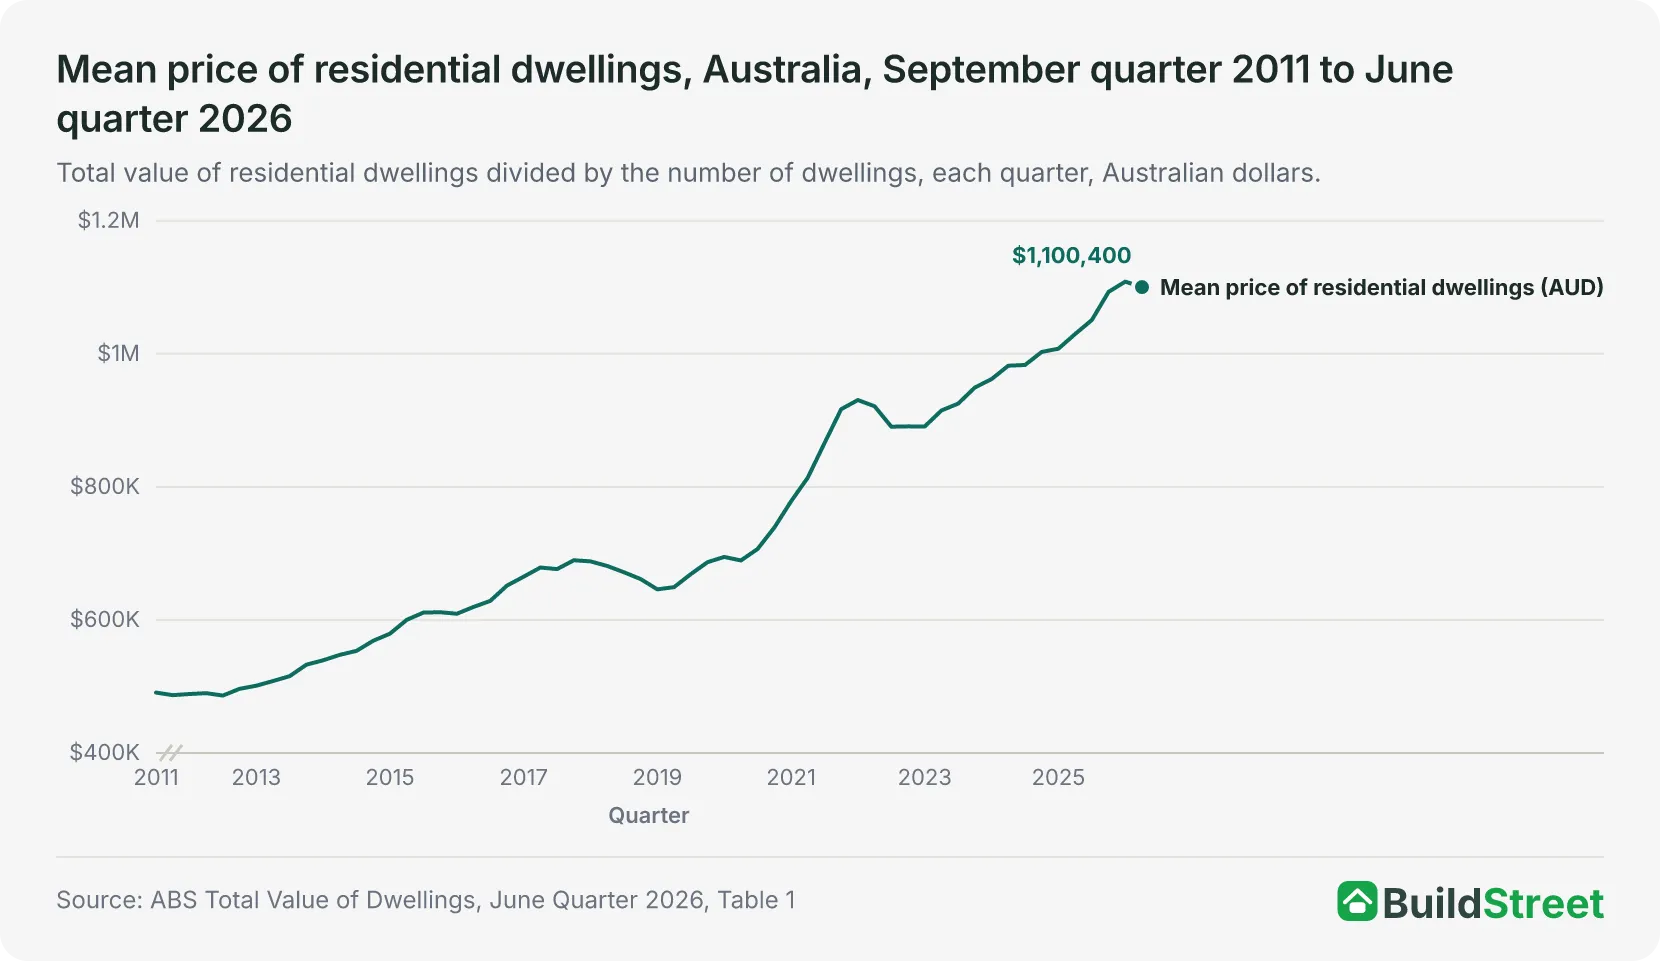
New South Wales recorded the highest mean dwelling price of any state or territory in the June quarter 2026, at $1,304,900, followed by Queensland, at $1,130,600, and Western Australia, at $1,123,7001. The Northern Territory recorded the lowest mean dwelling price of any state or territory, at $614,400.
Section 02 · Overseas prices
What are average home prices in Thailand, Poland and Malaysia?
Malaysia's average house price was RM506,317, or about A$178,000, in the June quarter 2026, according to preliminary National Property Information Centre (NAPIC) data2. Kuala Lumpur recorded the highest average house price of any Malaysian state or federal territory, at RM825,282, or about A$290,000.
In Kuala Lumpur, high-rise units averaged RM562,326, or about A$197,000, in the June quarter 2026, and terraced houses averaged RM977,286, or about A$343,0002.
Existing flats in Warsaw sold for an average of 16,723 złoty per square metre, or about A$6,236, in the second quarter of 2026, according to the National Bank of Poland3. New flats in Warsaw averaged 16,783 złoty, or about A$6,258, per square metre. Across the National Bank of Poland's seven-city average, which includes Warsaw, Kraków and Gdańsk, existing flats averaged 13,657 złoty, or about A$5,093, per square metre.
The Bank of Thailand publishes residential property price indexes rather than average home prices. These cover detached houses and townhouses across Thailand, as well as houses, townhouses and condominiums in Bangkok and surrounding areas4. No official average price or price per square metre is published for Bangkok.
| Official average home prices in Australia, Malaysia and Poland, 2026 | |||
|---|---|---|---|
| Place and measure | Period | Local currency | A$ equivalent |
| Australia, mean dwelling price | June quarter 2026 | $1,100,4001 | $1,100,400 |
| Malaysia, average house price | June quarter 2026 | RM506,3172 | $178,000 |
| Kuala Lumpur, average house price | June quarter 2026 | RM825,2822 | $290,000 |
| Kuala Lumpur, average high-rise unit | June quarter 2026 | RM562,3262 | $197,000 |
| Warsaw, existing flats, per m² | March to May 2026 | 16,723 zł3 | $6,236 |
| Warsaw, new flats, per m² | March to May 2026 | 16,783 zł3 | $6,258 |
| Seven-city average (Gdańsk, Gdynia, Kraków, Łódź, Poznań, Warsaw, Wrocław), existing flats, per m² | March to May 2026 | 13,657 zł3 | $5,093 |
| Thailand and Bangkok | No official average price | n/a | n/a |
Source · ABS Total Value of Dwellings; NAPIC Malaysian House Price Index Q2 2026p; National Bank of Poland residential property price database; RBA Table F11.1; NBP Table A
Section 03 · Worked example
What does Australia's average dwelling price buy in Bangkok, Kuala Lumpur and Warsaw?
At the Reserve Bank of Australia exchange rate on 30 September 2026, Australia's mean dwelling price of $1,100,400 for the June quarter 2026 converted to RM3,133,6095. That was 3.8 times Kuala Lumpur's average house price of RM825,282.2
This is an illustrative price comparison using June quarter 2026 property prices and exchange rates from 30 September 2026.
Worked example · $1,100,400 in Kuala Lumpur, Warsaw and Bangkok
In Kuala Lumpur, RM3,133,609 was 5.6 times the average price of a high-rise unit, at RM562,326, and 3.2 times the average terraced house price, at RM977,2862. Across Malaysia, RM3,133,609 was 6.2 times the national average house price of RM506,317.
The National Bank of Poland's exchange rate was 2.6818 złoty per Australian dollar on 30 September 20266. At that rate, $1,100,400 converted to 2,951,053 złoty, equivalent to the average price of 176 square metres of an existing Warsaw flat, at 16,723 złoty per square metre3. At the National Bank of Poland's seven-city average of 13,657 złoty per square metre for existing flats, 2,951,053 złoty was equivalent to the average price of 216 square metres.
In Thailand, $1,100,400 converted to about 25.8 million baht at 23.41 baht per Australian dollar5. Thailand does not publish an official average home price or price per square metre for Bangkok, so a direct price comparison is not available.
The calculation does not include stamp duty, legal fees or other transaction costs, taxes or foreign property ownership rules.
| What $1,100,400 converts to in Kuala Lumpur, Warsaw and Bangkok, 2026 | ||||
|---|---|---|---|---|
| Place | Exchange rate (per A$1) | $1,100,400 converts to | Comparison price | Equivalent |
| Kuala Lumpur | RM2.8477 | RM3,133,609 | Average house, RM825,282 | 3.8 homes |
| Kuala Lumpur | RM2.8477 | RM3,133,609 | Average high-rise unit, RM562,326 | 5.6 units |
| Warsaw | 2.6818 zł | 2,951,053 zł | Existing flats, 16,723 zł per m² | 176 m² |
| NBP seven-city average | 2.6818 zł | 2,951,053 zł | Existing flats, 13,657 zł per m² | 216 m² |
| Bangkok | 23.41 baht | 25,760,364 baht | No official average price | n/a |
Source · ABS Total Value of Dwellings; RBA Table F11.1; NBP Table A; NAPIC Malaysian House Price Index Q2 2026p; National Bank of Poland residential property price database
Property ownership rules for Australians in each country are covered in Can Australians buy property in Thailand, Malaysia or Poland?
Section 04 · Price growth
How has house price growth in Australia compared with Thailand, Malaysia and Poland?
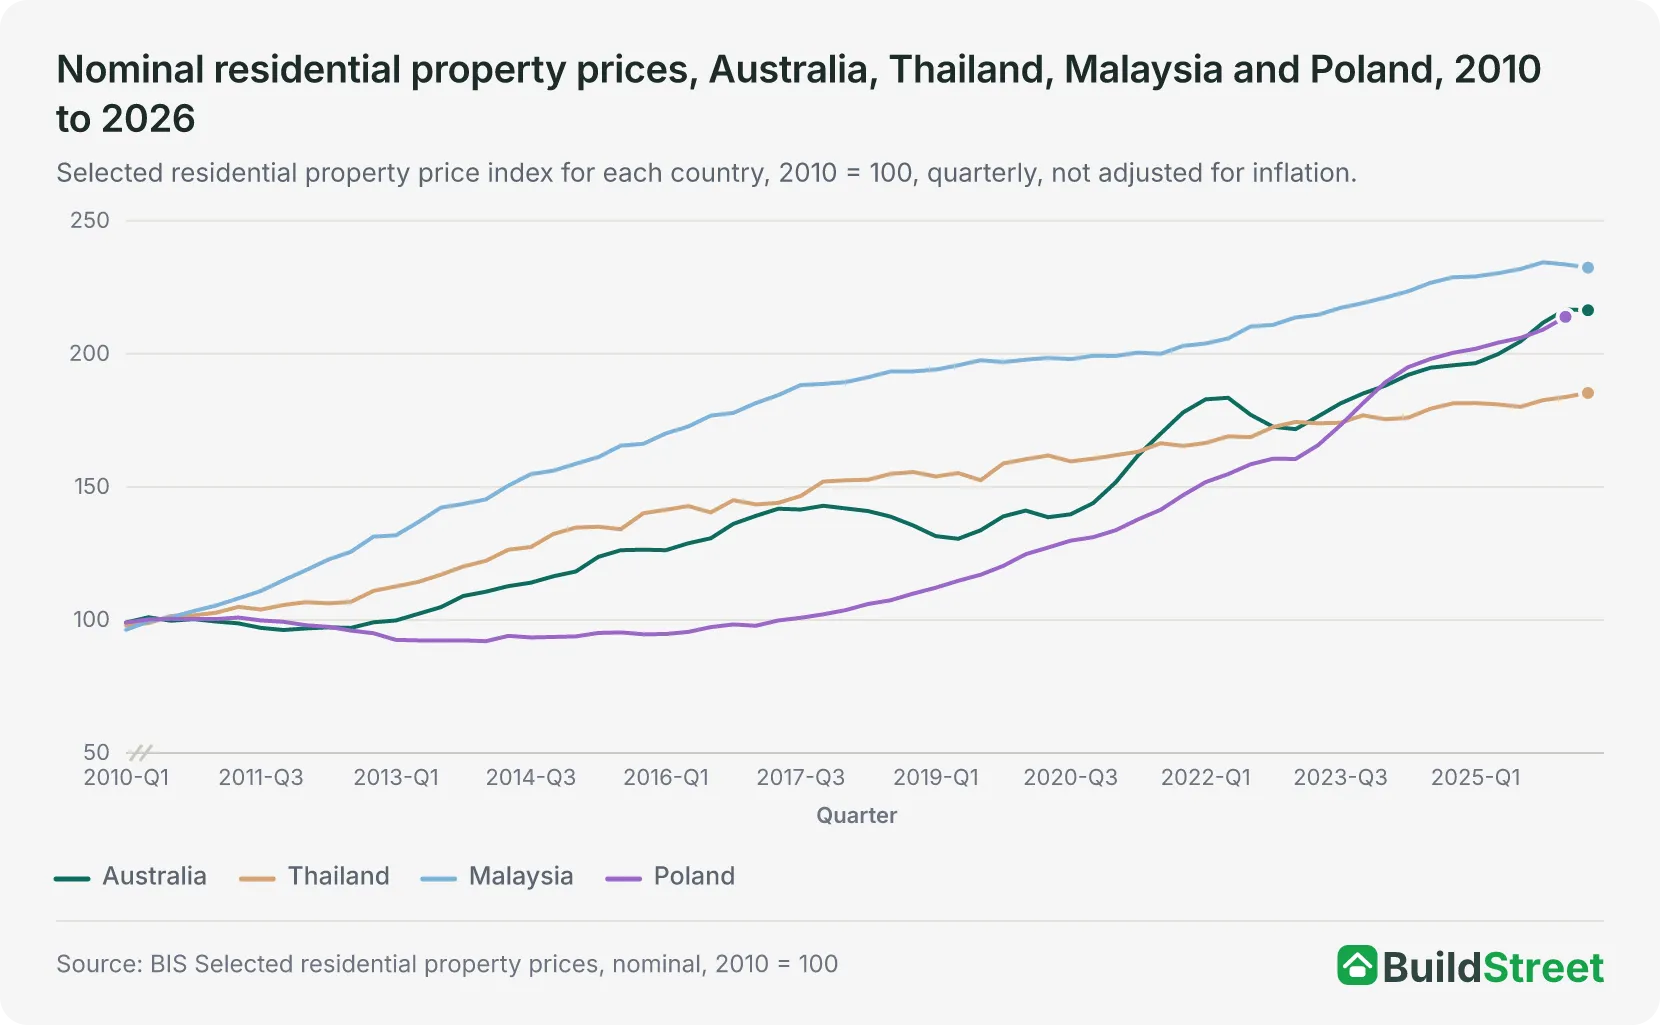
Australia recorded the highest annual growth in residential property prices of the four countries, at 8.3 per cent over the year to the June quarter 2026, according to Bank for International Settlements (BIS) data7.
In Poland, residential property prices rose 6.0 per cent over the year to the March quarter 20267. Prices in Thailand and Malaysia rose 2.4 per cent and 0.9 per cent respectively over the year to the June quarter 2026.
The BIS index for Australia, which uses ABS and CoreLogic data8, rose faster than the ABS mean price of residential dwellings, which increased 6.8 per cent over the same year97.
Statistics Poland reported that residential property prices were 6.3 per cent higher in the second quarter of 2026 than a year earlier. Prices rose 6.5 per cent for new flats and 6.1 per cent for existing flats.10 The BIS figures for Poland do not yet cover this quarter7.
Malaysia recorded the largest increase in residential property prices of the four countries since 2010, at 2.32 times its 2010 average in the June quarter 20267. Australian prices were 2.16 times their 2010 average, Polish prices were 2.14 times their 2010 average in the March quarter 2026, and Thai prices were 1.85 times their 2010 average.
After adjusting for inflation, prices fell over the year to the June quarter 2026 in Malaysia, by 1.0 per cent, and in Thailand, by 0.3 per cent7. Inflation-adjusted prices rose 4.2 per cent in Australia over the year to the June quarter 2026 and 3.5 per cent in Poland over the year to the March quarter 2026.
| Annual change in residential property prices, Australia, Thailand, Malaysia and Poland, 2026 | ||||
|---|---|---|---|---|
| Country | Latest quarter | Nominal change % | Real change % | Nominal index (2010 = 100) |
| Australia | June quarter 2026 | 8.37 | 4.27 | 216.47 |
| Poland | March quarter 2026 | 6.07 | 3.57 | 213.97 |
| Thailand | June quarter 2026 | 2.47 | -0.37 | 185.37 |
| Malaysia | June quarter 2026 | 0.97 | -1.07 | 232.47 |
Source · BIS Selected residential property prices
House price changes since 2010 are compared in House prices since 2010: Australia vs Thailand, Malaysia and Poland.
Section 05 · Rents
How fast are rents rising in Australia, Malaysia and Poland?
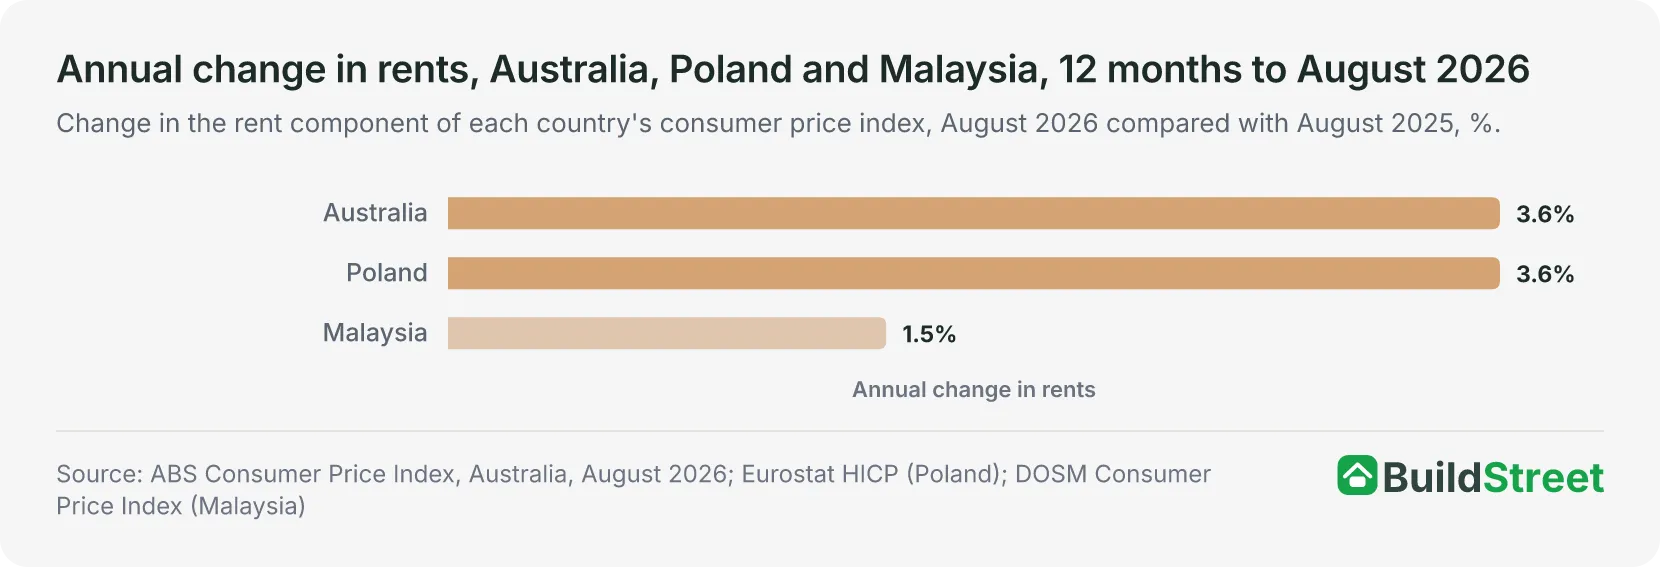
Rents rose 3.6 per cent in both Australia and Poland in the 12 months to August 2026, according to Australian Bureau of Statistics (ABS) and Eurostat consumer price data1112. In Malaysia, rents paid by tenants rose 1.5 per cent over the same 12 months, according to the Department of Statistics Malaysia (DOSM)13.
Polish rents rose faster than Australian rents over the longer period, according to Organisation for Economic Co-operation and Development (OECD) data. Poland's rent price index was 75.0 per cent above its 2015 level in the September quarter 2025, compared with 23.9 per cent in Australia14. Malaysian rents paid by tenants were 21.8 per cent higher in August 2026 than in August 201513.
These measures track changes in rents paid by existing and new tenants, rather than how much rent costs. They show where rents are rising fastest, not where renting is most expensive.
Rent levels in the four countries are compared in Renting overseas vs renting in Australia: how rents compare.
Section 06 · Incomes
How do house prices compare with incomes in Australia, Malaysia and Poland?
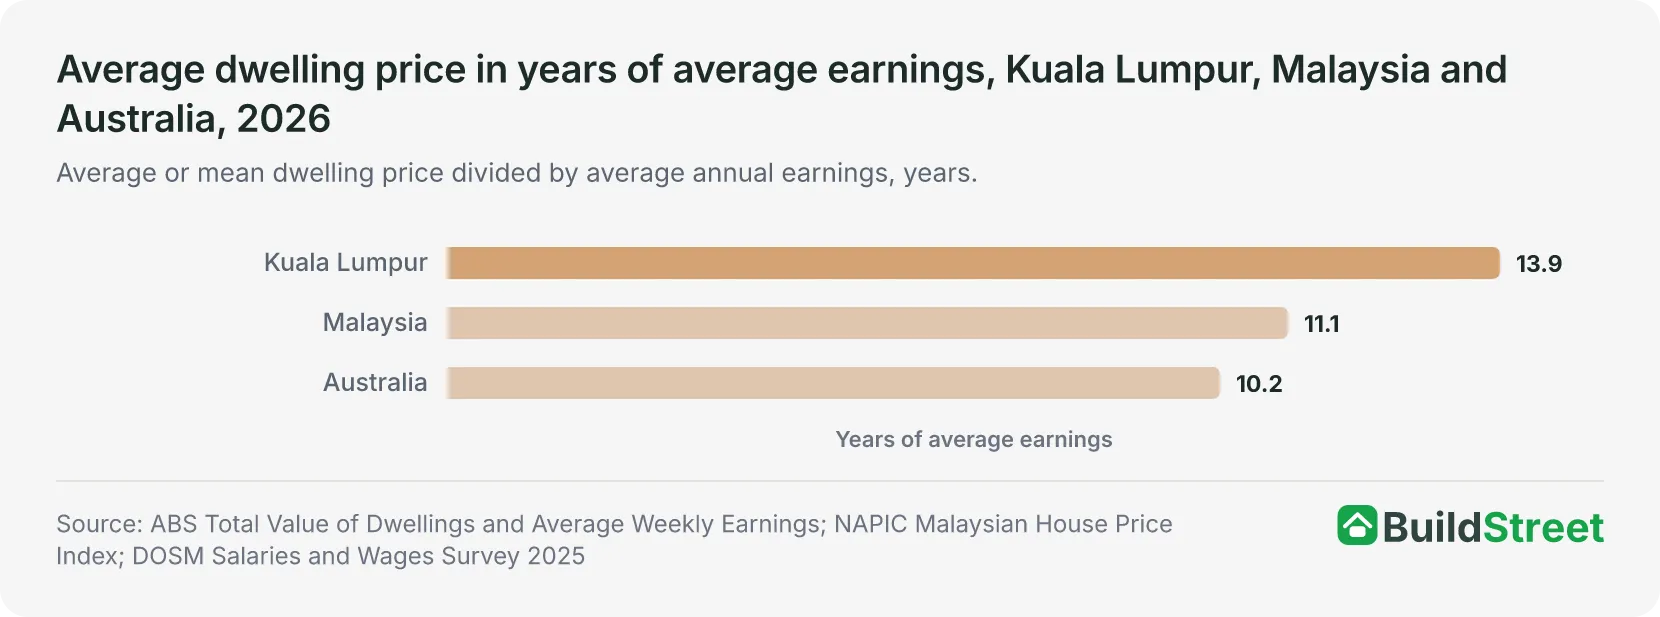
Australia's mean dwelling price of $1,100,400 in the June quarter 2026 was equal to 10.2 years of average earnings for a full-time adult employee in May 202615. Those earnings were $2,083.70 a week, or $108,352 a year, according to Australian Bureau of Statistics (ABS) Average Weekly Earnings data.
Malaysia's average house price of RM506,317 in the June quarter 2026 was equal to 11.1 years of average earnings for Malaysian citizens working full-time, based on average monthly earnings of RM3,803 in 2025, according to the Department of Statistics Malaysia (DOSM)16.
In Kuala Lumpur, the average house price of RM825,282 was equal to 13.9 years of average earnings of RM4,955 a month for Malaysian citizens working full-time in the federal territory in 202516.
In Poland, one square metre of an existing Warsaw flat cost the equivalent of 1.81 months of the national average monthly wage of 9,233.13 złoty in the second quarter of 2026, according to Statistics Poland17. The flat price covers the National Bank of Poland's March to May quarter, while the wage covers April to June.
Across the seven cities in the National Bank of Poland's seven-city average3, a square metre of an existing flat cost the equivalent of 1.48 months of the national average monthly wage17. The wage is a national average, not a Warsaw average.
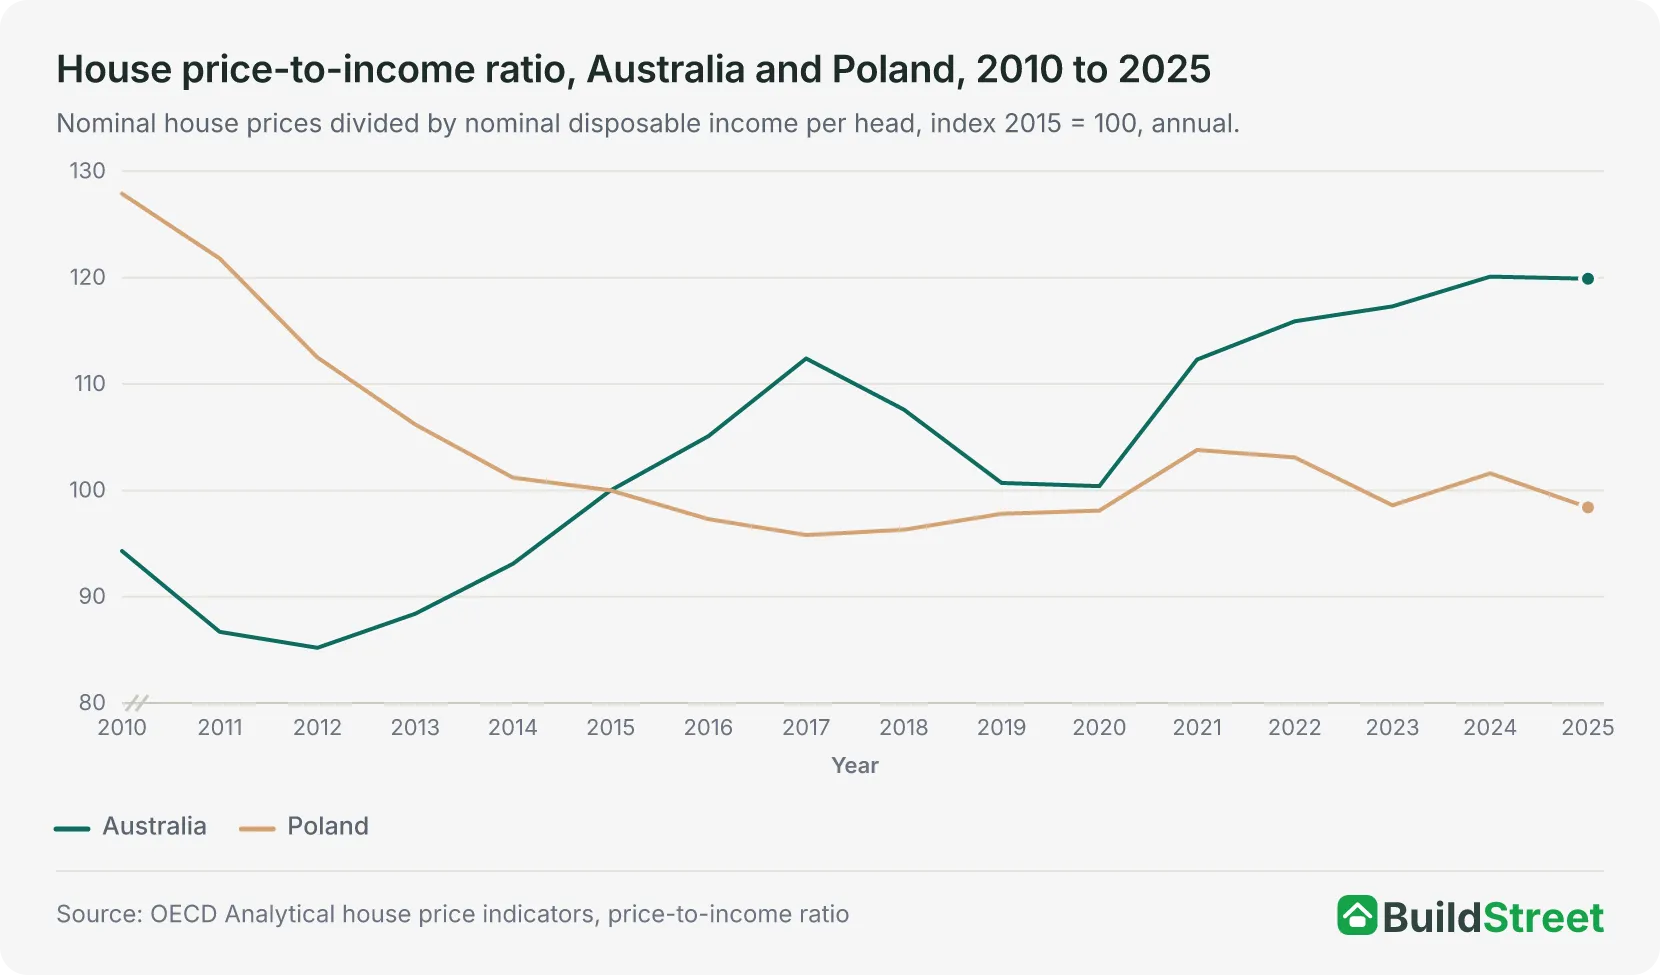
The Organisation for Economic Co-operation and Development (OECD) house price-to-income index for Australia was 119.9 in 2025, which was 19.9 per cent above its 2015 base level of 10014. Poland's index fell from 127.9 in 2010 to 98.4 in 2025.
The index compares changes in house prices with changes in average disposable income per person. The OECD does not publish it for Thailand or Malaysia.
Section 07 · Comparability
Why are house price figures for Australia, Thailand, Malaysia and Poland not directly comparable?
The official house price figures for Australia, Malaysia and Poland measure different things, so comparisons in Australian dollars are indicative only.
The ABS mean price covers all residential dwellings in Australia, whether sold or not1. NAPIC publishes average Malaysian house prices by property type2, and the National Bank of Poland publishes average prices per square metre of flats in 17 cities3.
The National Bank of Poland's second quarter covers March, April and May, while the Australian and Malaysian June quarter figures cover April to June3.
The BIS house price indexes use data from national sources, including CoreLogic and the ABS for Australia, the Bank of Thailand, Bank Negara Malaysia and Statistics Poland8. The BIS uses the measure that comes closest to covering all types of residential property nationwide in each country. This makes the indexes more suitable for comparing price changes than actual property prices.
Exchange rates change the Australian dollar equivalents from day to day. On 30 September 2026, one Australian dollar bought 2.8477 ringgit, 23.41 baht and 2.6818 złoty56.
| House price measures used for each country, 2026 | |||
|---|---|---|---|
| Country | Measure | Coverage | Publisher |
| Australia | Mean price of residential dwellings | All dwellings in the stock, sold or not | Australian Bureau of Statistics |
| Malaysia | Average house price | All house types, national and by state and federal territory | National Property Information Centre |
| Poland | Average transaction price per m² | Flats in 16 regional capitals and Gdynia | National Bank of Poland |
| Thailand | Price indexes only | Houses and townhouses nationwide and in Bangkok and vicinities, condominiums in Bangkok and vicinities | Bank of Thailand |
Source · ABS Total Value of Dwellings; NAPIC Malaysian House Price Index Q2 2026p; National Bank of Poland residential property price database; Bank of Thailand EC_EI_008_S3
Section 08 · Common questions
Frequently asked questions
How much does an average house cost in Malaysia?
The average house price in Malaysia was RM506,317 in the June quarter 2026, according to preliminary National Property Information Centre (NAPIC) data. That was about A$178,000 at the Reserve Bank of Australia exchange rate on 30 September 2026, and Kuala Lumpur's average was RM825,282, or about A$290,000.
How much does a flat cost per square metre in Warsaw?
Existing flats in Warsaw sold for an average of 16,723 złoty per square metre in the second quarter of 2026, according to the National Bank of Poland. The bank's second quarter covers March to May. That was about A$6,236 per square metre at the bank's mid rate of 2.6818 złoty per Australian dollar on 30 September 2026.
What is the average house price in Bangkok?
No official average house price or price per square metre is published for Bangkok. Instead, the Bank of Thailand publishes residential property price indexes. The Bank for International Settlements (BIS) index of residential property prices for Thailand rose 2.4 per cent in nominal terms over the year to the June quarter 2026.
Are house prices rising faster in Australia than in Thailand, Malaysia and Poland?
Yes. Australia recorded the highest annual growth in residential property prices among the four countries, at 8.3 per cent over the year to the June quarter 2026, according to the Bank for International Settlements (BIS). Thai and Malaysian prices rose 2.4 per cent and 0.9 per cent respectively over the same year, and Polish prices rose 6.0 per cent over the year to the March quarter 2026.
How many years of earnings does a home cost in Australia compared with Malaysia?
Australia's mean dwelling price of $1,100,400 in the June quarter 2026 was equal to 10.2 years of full-time adult average weekly ordinary time earnings in May 2026. Malaysia's average house price of RM506,317 was equal to 11.1 years of average annual earnings for Malaysian citizens working full-time in 2025. The Australian figures come from an employer survey, while the Malaysian figures come from a household survey, so the comparisons are indicative only.
Are rents rising faster in Australia or Poland?
Rents rose 3.6 per cent in both Australia and Poland in the 12 months to August 2026, according to Australian Bureau of Statistics (ABS) and Eurostat consumer price data. Over a longer period, Poland recorded a larger increase. According to Organisation for Economic Co-operation and Development (OECD) data, rents in Poland were 75.0 per cent above their 2015 level in the September quarter 2025, compared with 23.9 per cent for Australia.
References
- ABS Total Value of Dwellings, June quarter 2026 (Cat. 6432.0) · Australian Bureau of Statistics ↑ b c d e f g h
- NAPIC — Malaysian House Price Index report, Q1 to Q2 2026p · napic.jpph.gov.my ↑ b c d e f g h
- National Bank of Poland — Ceny mieszkań (housing prices database) · static.nbp.pl ↑ b c d e f g h
- Bank of Thailand, EC_EI_008_S3 Residential Property Price Index and Land Price Index · app.bot.or.th ↑
- Reserve Bank of Australia, Exchange Rates, Statistical Table F11.1 · Reserve Bank of Australia ↑ b c
- National Bank of Poland, Table A of average exchange rates, AUD, 30 September 2026 · api.nbp.pl ↑ b
- BIS, Selected residential property prices · data.bis.org ↑ b c d e f g h i j k l m n o p q r
- BIS, Selected residential property prices: data documentation · bis.org ↑ b
- ABS Total Value of Dwellings, June Quarter 2026 — Table 1. Total value of dwellings, all series · Australian Bureau of Statistics ↑
- Statistics Poland (GUS) — Wskaźniki cen lokali mieszkalnych w 2 kwartale 2026 r. · stat.gov.pl ↑
- ABS, Consumer Price Index, Australia, August 2026 · Australian Bureau of Statistics ↑
- Eurostat, HICP (ECOICOP ver. 2) monthly indices and rates of change, prc_hicp_minr: actual rentals paid by tenants (CP0411), Poland · ec.europa.eu ↑
- Department of Statistics Malaysia, Monthly CPI by Class (4-digit), OpenDOSM data catalogue · open.dosm.gov.my ↑ b
- OECD Analytical house price indicators: price-to-income ratio and rent price index, Australia and Poland · sdmx.oecd.org ↑ b
- ABS Average Weekly Earnings, Australia, May 2026 · Australian Bureau of Statistics ↑
- Department of Statistics Malaysia, Salaries and Wages Survey Report 2025 · dosm.gov.my ↑ b
- Statistics Poland (GUS), Communication on the average wage in the second quarter of 2026 · stat.gov.pl ↑ b
