

Published
- Australia, increase on 2010 average
- 116.7%
- BIS nominal index 216.7 in the March quarter 2026, where the 2010 average is 100
- Malaysia, increase on 2010 average
- 133.6%
- BIS nominal index 233.6 in the March quarter 2026, the largest increase among the four countries
- Poland, increase on 2010 average
- 113.9%
- BIS nominal index 213.9 in the March quarter 2026, for flats only
- Thailand, increase on 2010 average
- 83.8%
- BIS nominal index 183.8 in the March quarter 2026, the smallest increase among the four countries
 How does housing affordability in Australia compare internationally?House prices measured against incomes and rents, and how Australia ranks among comparable countries.
 How do price-to-income ratios compare internationally?How many years of earnings a home costs in Australia and other countries, on the OECD's price-to-income measure.
Section 01 · Since 2010
How much have house prices risen in Australia, Poland, Malaysia and Thailand since 2010?
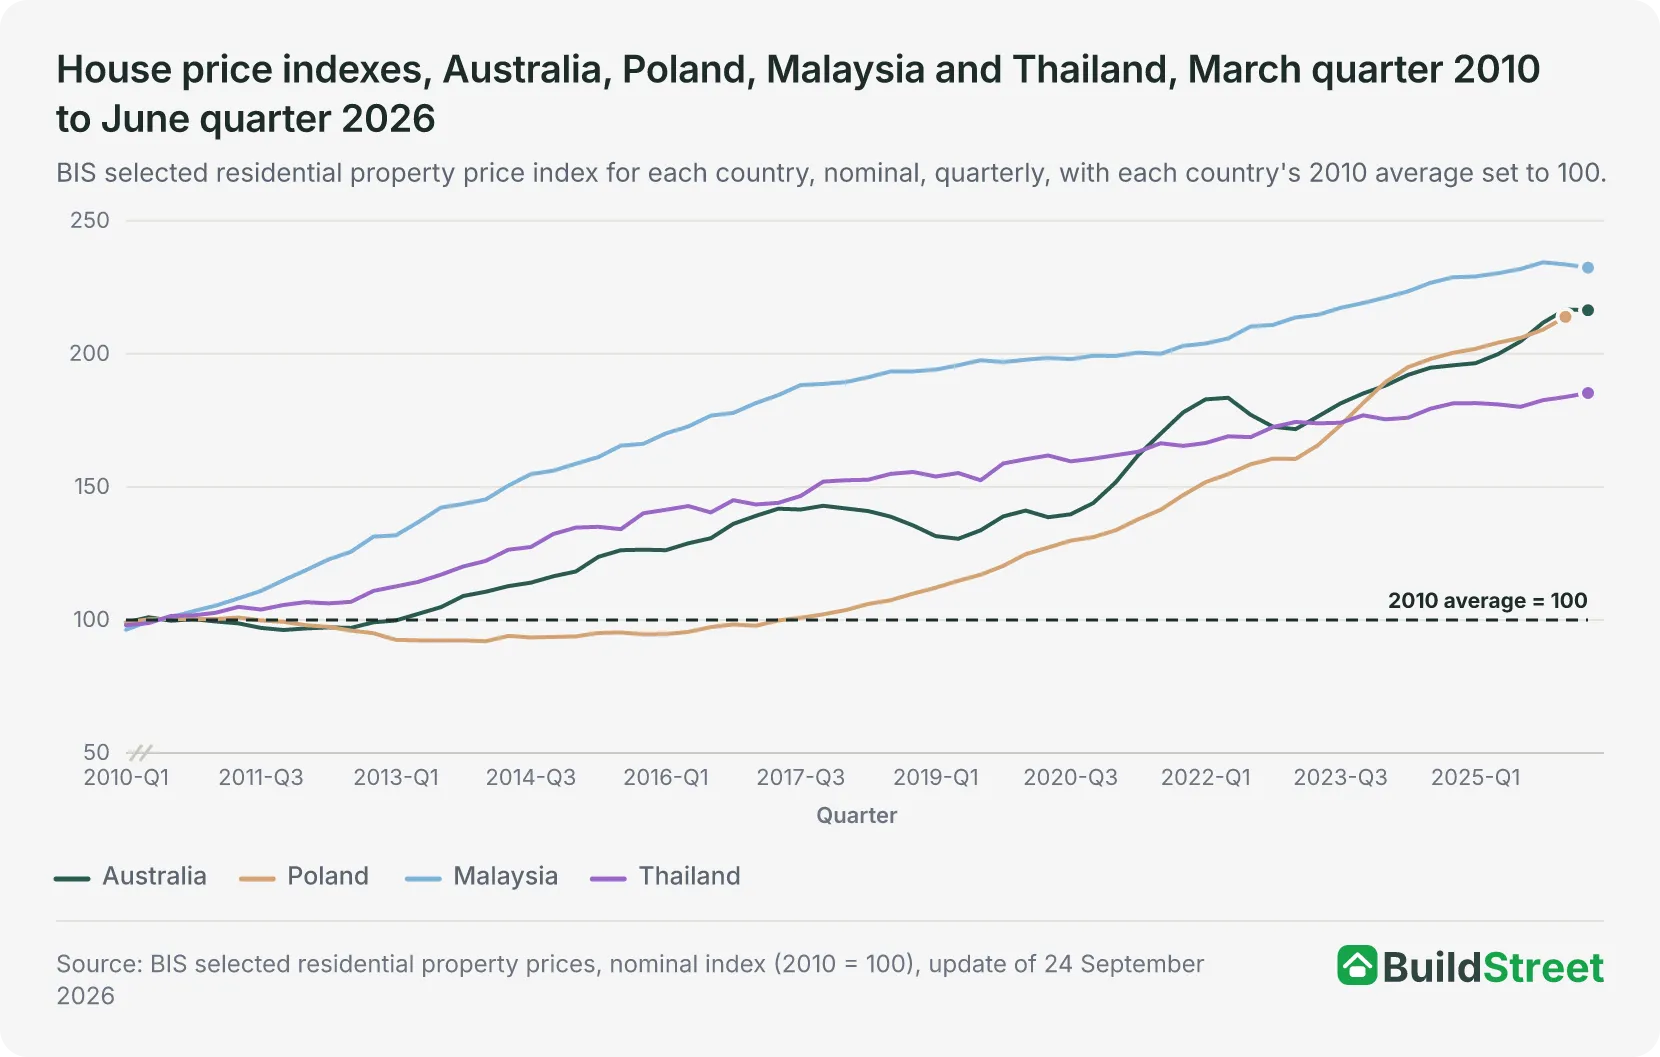
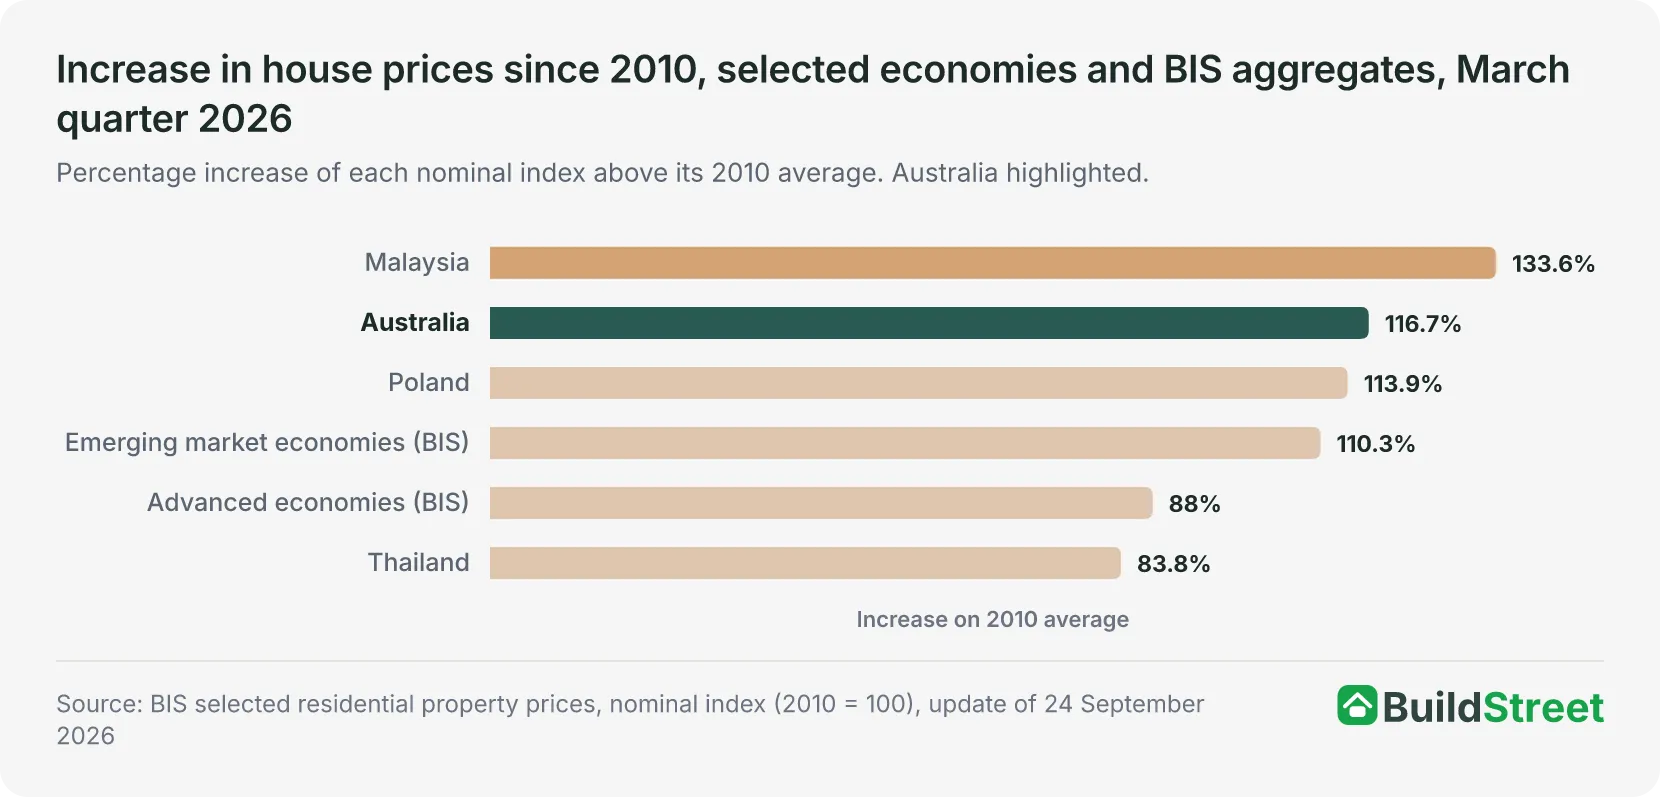
Malaysia recorded the largest increase in house prices since 2010 among the four countries, at 133.6 per cent above its 2010 average in the March quarter 2026, according to data from the Bank for International Settlements (BIS)1.
Australian house prices were 116.7 per cent higher, compared with 113.9 per cent in Poland and 83.8 per cent in Thailand1.
The comparison uses the March quarter 2026, the latest quarter with data available for all four countries.
| House price indexes and growth, Australia, Poland, Malaysia and Thailand, 2026 | ||||
|---|---|---|---|---|
| Country | Index, Mar qtr 2026 | Increase on 2010 average | Index, Jun qtr 2026 | Annual growth, latest quarter |
| Australia | 216.7 | 116.7% | 216.4 | 8.3% |
| Poland | 213.9 | 113.9% | not yet published | 6.0% |
| Malaysia | 233.61 | 133.6% | 232.4 | 0.9% |
| Thailand | 183.81 | 83.8% | 185.3 | 2.4% |
Source · BIS selected residential property prices, update of 24 September 2026.
Section 02 · Australia
How does Australia's house price growth since 2010 compare internationally?
Australia recorded the 24th-largest increase in house prices since 2010 among the 56 economies with BIS data for the March quarter 2026, at 116.7 per cent1. The increase was larger than the overall increase for advanced economies, at 88.0 per cent, and emerging market economies, at 110.3 per cent, as measured by the BIS.
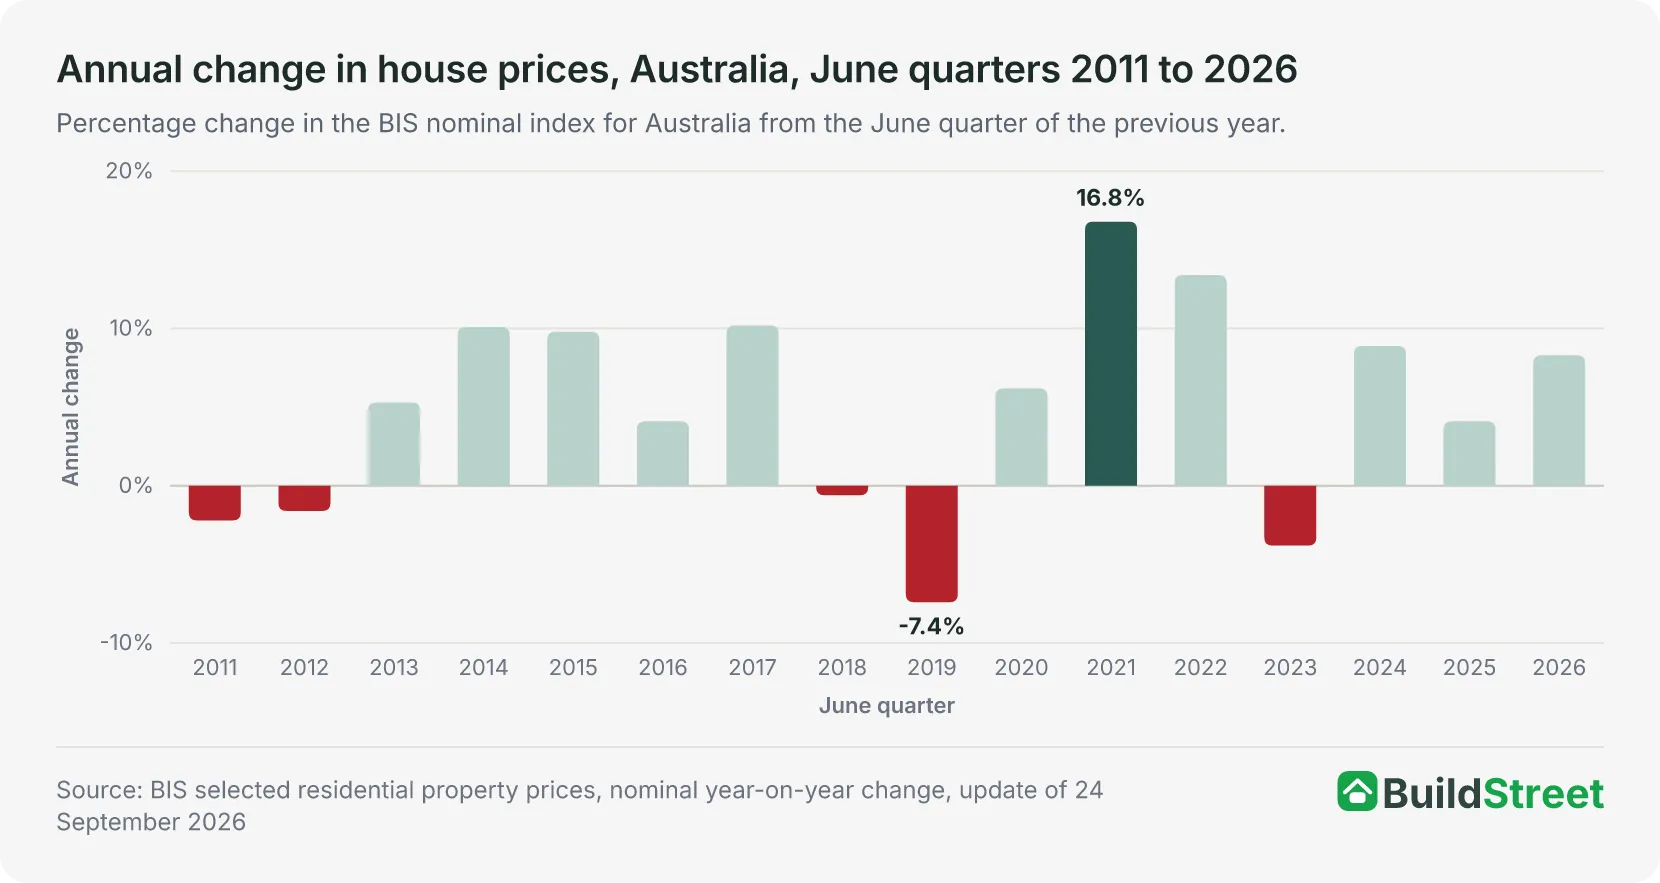
Australian house prices were lower than a year earlier from the June quarter 2011 to the June quarter 2012, from the June quarter 2018 to the September quarter 2019, and from the December quarter 2022 to the June quarter 20231. Between the June quarter 2022 and the March quarter 2023, Australia's index fell 6.4 per cent, from 183.5 to 171.7.
Australian house prices were 8.3 per cent higher in the June quarter 2026 than a year earlier1. Australia's index fell from 216.7 in the March quarter 2026 to 216.4 in the June quarter 2026.
The mean price of residential dwellings in Australia fell by $8,200 in the June quarter 2026, to $1,100,400, according to the Australian Bureau of Statistics (ABS)2.
A comparison of house prices relative to incomes is in How does housing affordability in Australia compare internationally?
Section 03 · Poland
How have Poland's house prices changed since 2010?
Prices of flats in Poland were 113.9 per cent above their 2010 average in the March quarter 20261. The BIS index for Poland covers flat prices across the country, using data from Statistics Poland3.
Poland's index was lower than a year earlier in every quarter from the September quarter 2011 to the March quarter 2014, and fell to its lowest level since 2010, at 92.0, in the March quarter 20141. In the December quarter 2016, the index was 98.3, below its 2010 average.
Poland's index rose 45.6 per cent between the December quarter 2021 and the March quarter 2026, from 146.9 to 213.91. In the March quarter 2026, Poland's index was 6.0 per cent higher than a year earlier.
Statistics Poland reported that prices of residential premises in the June quarter 2026 were 6.3 per cent higher than a year earlier and 1.5 per cent higher than in the March quarter 20264.
The annual increases were 6.5 per cent for new properties and 6.1 per cent for existing properties4.
Section 04 · Malaysia
How much have Malaysian house prices risen since 2010?
Malaysia's house prices were 132.4 per cent above their 2010 average in the June quarter 2026, down from 133.6 per cent in the March quarter 20261. Malaysia's index measures the price per square metre across all types of homes3.
Malaysia's index reached 177.8 in the December quarter 2016 and 203.0 in the December quarter 2021, then rose 14.5 per cent to 232.4 in the June quarter 20261.
Malaysia's index recorded its highest level since 2010, at 234.4, in the December quarter 2025, and fell in each of the next two quarters1. Its annual growth rate slowed to 0.9 per cent in the June quarter 2026.
The average price per dwelling in Malaysia was RM506,317 in the June quarter 2026, compared with RM825,282 in Kuala Lumpur, according to National Property Information Centre (NAPIC) data published by the BIS5.
A separate NAPIC index, also published by the BIS, was 234.7 for Malaysia in the June quarter 2026 and 207.8 for Kuala Lumpur, where 100 is the 2010 average5. It differs from the BIS index used elsewhere in this article, which was 232.4, and shows that prices in Kuala Lumpur have risen less since 2010 than across Malaysia as a whole.
Section 05 · Thailand
How much have house prices in Thailand risen since 2010?
Thailand recorded the smallest increase in house prices since 2010 among the four countries, at 83.8 per cent in the March quarter 2026, according to Bank for International Settlements (BIS) data1.
Thailand's index rose to 185.3 in the June quarter 2026, which was 85.3 per cent above its 2010 average and its highest level since 20101.
Thailand's house prices were lower than a year earlier in only one quarter between 2010 and the June quarter 2026, the September quarter 2019, when they were 1.5 per cent lower1. In the June quarter 2026, Thailand's house prices were 2.4 per cent higher than a year earlier.
The Bank of Thailand's nationwide index, which uses 2011 as its starting point of 100, was 178.5 in June 20267. Among Thailand's five regions, the North recorded the highest index in June 2026, at 194.4, and the South recorded the lowest, at 166.0.
By type of home, the nationwide index in June 2026 was 162.7 for detached houses and 184.1 for townhouses, while the index for apartments in Bangkok and surrounding areas was 204.17.
| Residential property price indexes by region and dwelling type, Thailand, June 2026 | |
|---|---|
| Region or dwelling type | Index (2011 = 100) |
| All dwellings, nationwide | 178.5 |
| All dwellings, Bangkok and vicinities | 171.77 |
| All dwellings, Central (excluding Bangkok and vicinities) | 189.97 |
| All dwellings, North | 194.4 |
| All dwellings, Northeast | 187.37 |
| All dwellings, South | 166.0 |
| Single-detached houses, nationwide | 162.7 |
| Town houses, nationwide | 184.1 |
| Condominiums, Bangkok and vicinities | 204.1 |
Source · Bank of Thailand, Residential Property Price Index (EC_EI_008_S4).
Section 06 · After inflation
How much have inflation-adjusted house prices risen since 2010?
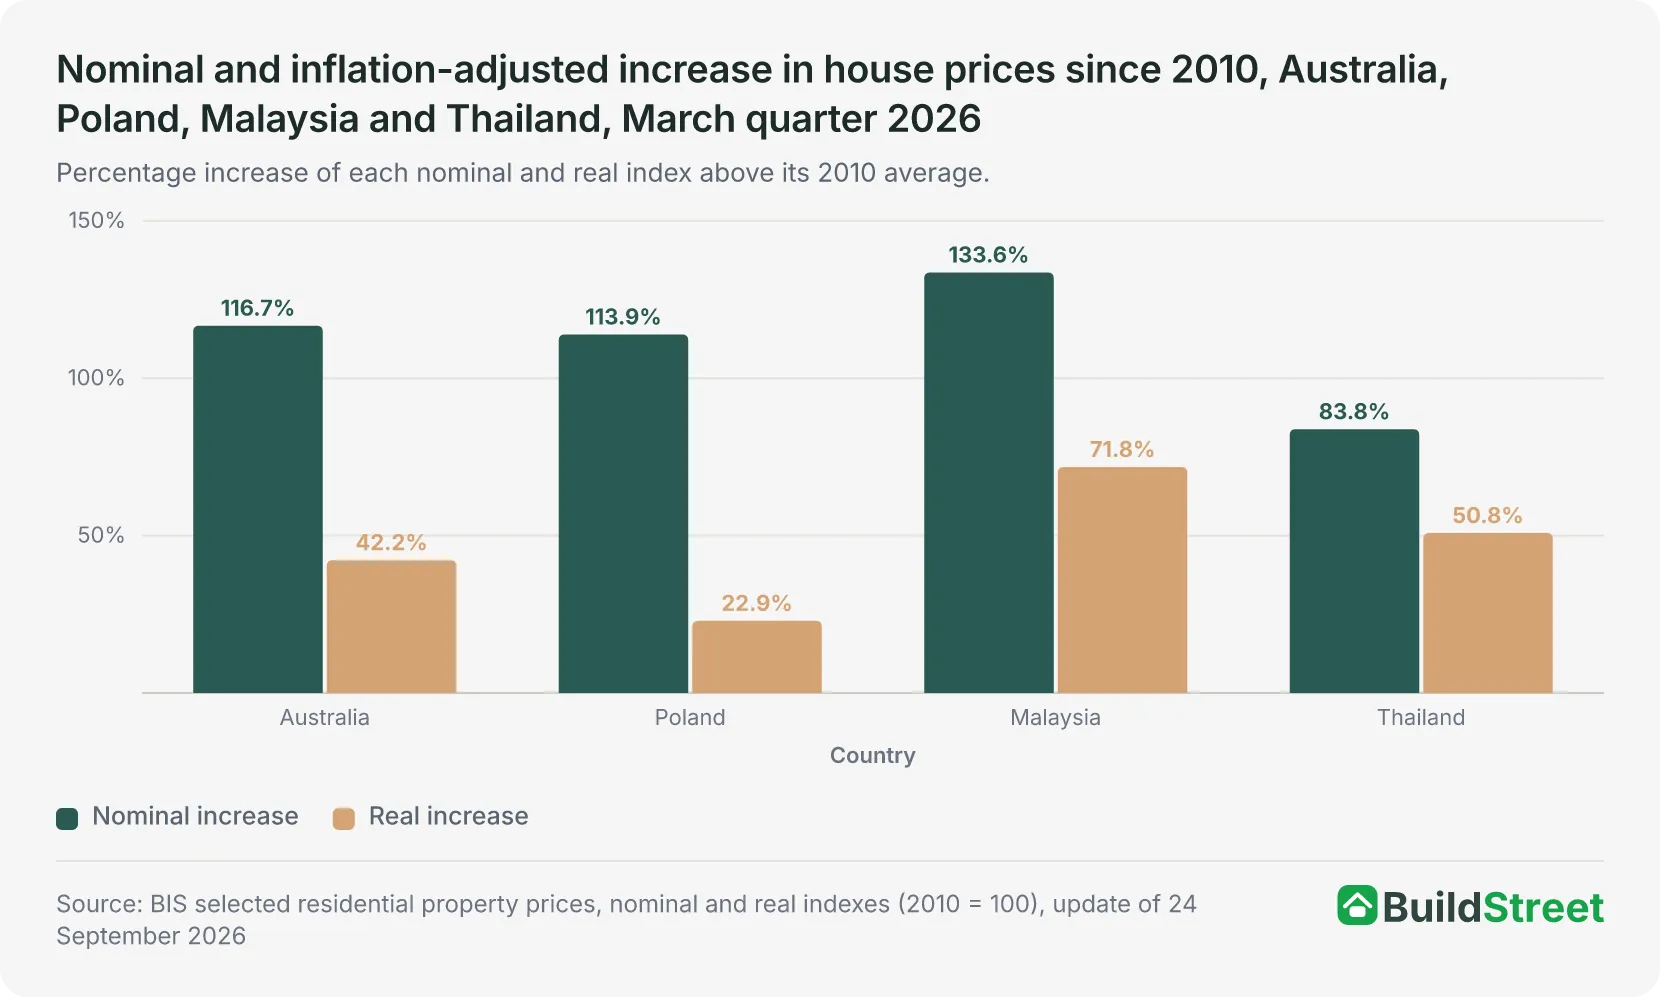
Malaysia recorded the largest increase in inflation-adjusted house prices among the four countries, at 71.8 per cent above its 2010 average in the March quarter 2026, according to Bank for International Settlements (BIS) data1.
The inflation-adjusted increase was 50.8 per cent in Thailand, compared with 42.2 per cent in Australia and 22.9 per cent in Poland1.
Thailand's inflation-adjusted increase was larger than Australia's, although its increase before inflation was taken into account was smaller, at 83.8 per cent compared with 116.7 per cent1.
Consumer prices rose by about 74 per cent in Poland between 2010 and the March quarter 2026, compared with about 52 per cent in Australia, 36 per cent in Malaysia and 22 per cent in Thailand. These figures are implied by dividing each country's house price index before inflation by its inflation-adjusted index: for Australia, 216.7 divided by 142.2 is 1.52, a rise of about 52 per cent1.
In the June quarter 2026, inflation-adjusted house prices were 1.0 per cent lower than a year earlier in Malaysia and 0.3 per cent lower in Thailand, while in Australia they were 4.2 per cent higher1. Poland's June quarter 2026 inflation-adjusted index was not yet published.
Section 07 · Comparability
How does the BIS make house price indexes comparable across countries?
The Bank for International Settlements (BIS) selects a house price index for each country that comes closest to covering all new and existing homes nationwide. It makes these selections from more than 300 housing price measures in its detailed data3. It chose the indexes with national central banks, following the international handbook on residential property price indexes.
Each index uses its country's 2010 average as a starting point of 100. This allows house price growth to be compared across countries, but does not show the actual price of a home3.
Coverage and methods of measuring prices differ between the four countries.
| Coverage of the BIS house price indexes, Australia, Poland, Malaysia and Thailand | ||||
|---|---|---|---|---|
| Country | Dwellings and area covered | Earlier coverage | Price measure | Supplied by |
| Australia | All dwellings, whole country, from the March quarter 2022 | All dwellings, eight capital cities, September quarter 2003 to December quarter 2021 | Price changes excluding differences in property characteristics to December quarter 2021; not stated by the BIS for the nationwide index | CoreLogic, ABS and Real Estate Institute of Australia data |
| Poland | New and existing flats, nationwide, from the March quarter 2010 | None before 2010 | Transaction prices, adjusted for differences in the types of flats sold | Statistics Poland |
| Malaysia | All dwellings, from the March quarter 1999 | Historical all-dwellings index, 1988 to 1998 | Price per square metre | Central Bank of Malaysia |
| Thailand | All dwellings, nationwide, from the March quarter 2011 | Detached houses, Greater Bangkok, 1991 to 2010 | Prices adjusted for differences between properties, using mortgage loan data | Bank of Thailand |
Source · BIS, Selected residential property prices: data documentation (31 July 2026); BIS detailed residential property prices; Bank of Thailand, Residential Property Price Index.
Section 08 · Common questions
Frequently asked questions
How much have house prices increased in Australia since 2010?
Australian house prices were 116.7 per cent higher in the March quarter 2026 than their 2010 average, according to the Bank for International Settlements (BIS) index. After consumer price inflation, they were 42.2 per cent higher.
Have house prices risen more in Malaysia or Australia?
Malaysian house prices have risen more since 2010, with the BIS index 133.6 per cent above its 2010 average in the March quarter 2026, compared with 116.7 per cent in Australia. Over the year to the June quarter 2026, Australian prices rose faster, increasing by 8.3 per cent compared with 0.9 per cent in Malaysia.
Are house prices in Poland rising?
Yes, Statistics Poland reported that prices of residential premises were 6.3 per cent higher in the June quarter 2026 than a year earlier and 1.5 per cent higher than in the March quarter 2026. The BIS index for Poland, which covers flats only, was 113.9 per cent above its 2010 average in the March quarter 2026.
What is the annual house price growth rate in Thailand?
Thai house prices were 2.4 per cent higher in the June quarter 2026 than a year earlier, according to the BIS index. After consumer price inflation, they were 0.3 per cent lower than a year earlier.
Why can BIS house price indexes be compared across countries?
The BIS selects a house price index for each country that comes closest to covering all new and existing homes nationwide. Each index uses its country's 2010 average as a starting point of 100, allowing price changes to be compared. Coverage still differs between countries, and Poland's index, for example, covers flats only.
How much does a house cost in Malaysia in Australian dollars?
The average price per dwelling in Malaysia was RM506,317 in the June quarter 2026, according to National Property Information Centre (NAPIC) data published by the BIS. At the Reserve Bank of Australia's exchange rate for 30 June 2026, that was equivalent to about A$181,100.
References
- BIS, Selected residential property prices · data.bis.org ↑ b c d e f g h i j k l m n o p q r s t u
- ABS Total Value of Dwellings, June quarter 2026 (Cat. 6432.0) · Australian Bureau of Statistics ↑
- BIS, Selected residential property prices: data documentation · bis.org ↑ b c d e f
- GUS, Price indices of residential premises in the second quarter of 2026 · stat.gov.pl ↑ b
- BIS, Detailed residential property prices (WS_DPP), Australia, Poland, Malaysia and Thailand · stats.bis.org ↑ b c
- Reserve Bank of Australia, Exchange Rates, Statistical Table F11.1 · Reserve Bank of Australia ↑
- Bank of Thailand, EC_EI_008_S4 Residential Property Price Index · app.bot.or.th ↑ b c d e
