Australian dwelling mix statistics: how houses, apartments and emerging home types have changed
Detached houses made up 73.3% of all new dwellings approved nationally in 1990. By 2015, that share had fallen to 50.4%, while apartment approvals accounted for a larger share of the national total. By 2025, it had recovered to 57.8%, but Australia's dwelling approval mix remained very different from that of the early 1990s.
House share, 1990
73.3%
Of 131,267 total approvals
House share, lowest point
50.4%
2015, the highest-volume year in the 1990–2025 series (237,167 approvals)
House share, 2025
57.8%
Of 195,684 total approvals
Peak apartment share
36.1%
2015, representing 85,695 apartment approvals
Emerging home types in Australia
What counts as an emerging home type, how alternative dwelling types are growing, and why national data on non-traditional construction methods remains limited.
Read more →Modular home statistics in Australia
How many modular homes are built each year, what they cost compared to a traditional build, and how government programmes are using modular construction.
Read more →SECTION 01 · THE LONG VIEW
How Australia's dwelling approval mix has changed since 1990
Detached houses made up 73.3% of all new dwelling approvals in 1990. By 2025, that share had fallen to 57.8%, while apartments and townhouses accounted for a larger share of the national total. Total approvals also grew over this period, from 131,267 in 1990 to 195,684 in 2025. The shift reflects a change in what is being built, not a shrinking approval pipeline.
The change was not uniform. Detached houses accounted for around 70% of approvals through much of the 1990s, before their share fell more sharply from 2010 as higher-density apartment approvals increased. The 2021 HomeBuilder period coincided with a temporary reversal, with the detached house share rising to 65.1% before falling again.
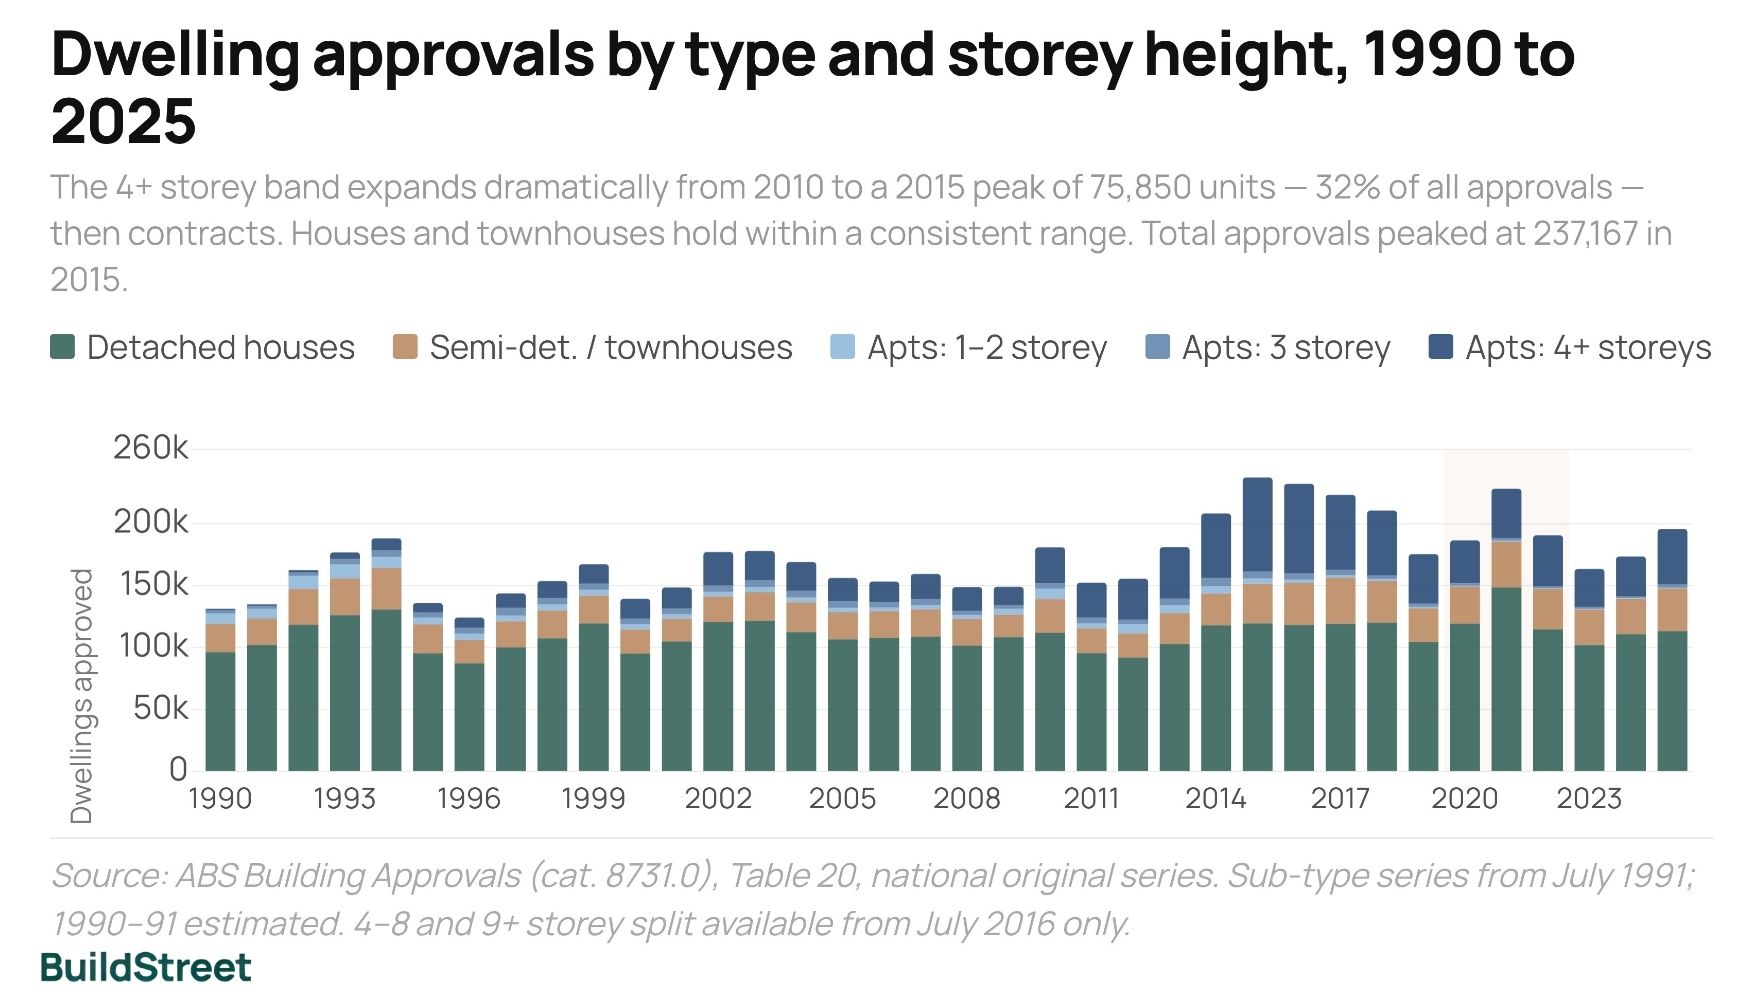
Annual dwelling approvals by type, Australia, 1990–2025
Houses were the largest category throughout the period, but their share fell from 2010. The 4+ storey apartment segment increased over the same period and peaked in 2015.
- Detached houses
- Semi-detached / townhouses
- Apartments
1990
Note: Semi-detached and apartment series available from July 1991; 1990–1991 estimates are derived from total “other residential” using the 1992 type ratio as a proxy. Source: ABS Building Approvals, Australia (cat. 8731.0), Table 20, national original series.
Total approvals followed a cyclical pattern, falling to 148,922 in 2009 during the GFC, rising to 228,119 in 2021 during the HomeBuilder programme, and settling at 195,684 in 2025. In 2021, 148,493 detached houses were approved, the highest annual count in the 1990–2025 series. The detached house share was 65.1% that year, reflecting the larger role of apartment and townhouse approvals in the national total. The decline in the house share reflects growth in other types, not a fall in house construction.
SECTION 02 · HOUSES
Detached house approval share in Australia has declined since the 1990s
The detached house share fell 18.4 percentage points over roughly twenty years, from 72.3% of all new approvals in the 1990–1994 period to 53.9% in 2015–2019. This was the longest sustained decline in the series. The share reached its lowest point at 50.4% in 2015, before recovering to 57.8% by 2025.
Fall in the house share across two decades
Detached houses accounted for 72.3% of all approvals in 1990–1994 on a weighted basis. By 2015–2019 that share had fallen to 53.9%, a drop of 18.4 percentage points over roughly twenty years.
Before the GFC, the house share generally held between 65% and 72%. From 2009, it fell each year, reaching its lowest point at 50.4% in 2015. The COVID-19 HomeBuilder grant temporarily lifted detached house approvals, with activity rising from late 2020 through early 2022 as the grant targeted new house construction. By 2025, the share had fallen back to 57.8%.
Several factors may have contributed to the longer-term decline in the detached house share. Rising land values in major capital cities may have made large suburban lots more expensive relative to other housing options. Planning changes in some inner and middle-ring suburbs of Sydney and Melbourne also allowed more medium- and higher-density development on sites previously zoned mainly for houses.
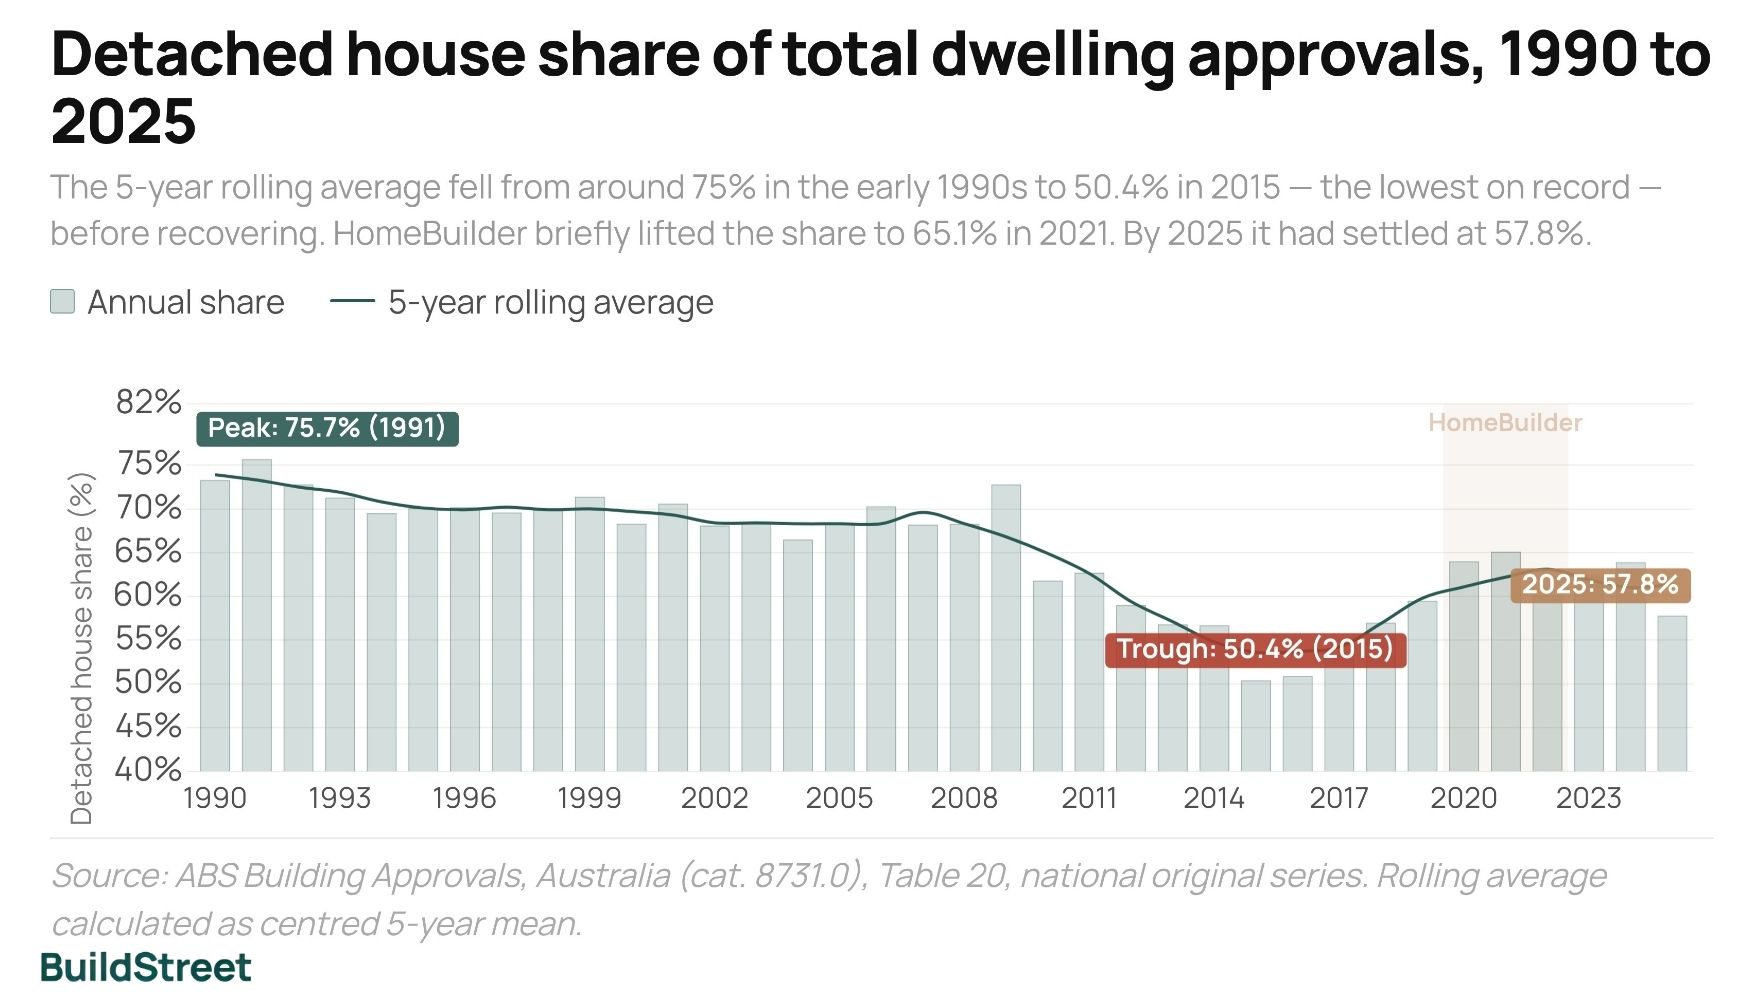
Detached house share of total approvals, 1990–2025
The rolling average fell from around 75% in the early 1990s to below 55% by 2015, then recovered to 58% by 2025. The HomeBuilder period shows a temporary upward movement in 2020 and 2021, before the share eased again.
Source: ABS Building Approvals, Australia (cat. 8731.0), Table 20, national original series. Rolling average calculated as centred 5-year mean.
At 57.8% in 2025, the house share sits at the lower end of its historical range. It remains above the 2014–2018 trough but well below the levels typical in the 1990s and early 2000s.
HomeBuilder lifted detached house approvals in 2021
The HomeBuilder grant coincided with 148,493 detached house approvals in 2021, the highest annual count in the 1990–2025 series. Even at that volume, detached houses accounted for 65.1% of total approvals, reflecting the larger role of apartments and townhouses compared with the 1990s.
Detached house approval volumes have been more stable than their share
In absolute terms, house construction volumes have held within a consistent range. Annual approvals ranged between 95,000 and 130,000 through most of the 1990s and 2000s, and returned to that range in 2023 to 2025. The share decline reflects growth in other dwelling types, not a fall in house building.
SECTION 03 · MEDIUM DENSITY
How have apartments and townhouses changed Australia's dwelling mix?
Apartments and townhouses together grew from about 27% of all new approvals in 1990 to over 42% in 2025. Most of that growth came from higher-density apartment approvals in the 2010s. Townhouses grew at a lower rate, but by 2025 they held a larger share of new dwelling approvals than at any point in the past decade.
Townhouse and semi-detached approvals rose from around 23,000 per year in the early 1990s to a peak of 37,410 in 2017, an increase of 63% over that period. By 2025 they had reached 34,488, representing 17.6% of all new dwellings. Year-to-year variation in townhouse approvals has been lower than for apartments across the full series.
The 4+ storey apartment segment rose from 1,702 approvals in 1992 to 75,850 in 2015, growing from 1% to 32% of the national total. Since that 2015 peak, approvals in this segment fell for five consecutive years, then recovered in 2021 and 2022 before falling again to 30,705 in 2023.
Dwelling type volumes: 2025 approvals
113,088
Detached houses
57.8% of total
34,488
Semi-detached / townhouses
17.6% of total
44,698
Apartments: 4+ storeys
22.8% of total (32.0% at the 2015 peak)
The apartment data splits into three sub-types by storey height. The 1-to-3 storey segment was smaller and fell over time, especially after the late 2010s. The 4+ storey segment drove much of the change in the overall mix, rising from 1,702 approvals in 1992 to 75,850 in 2015, then falling for five consecutive years to 34,471 in 2020. It recovered in 2021 and 2022, fell again to 30,705 in 2023, and reached 44,698 in 2025. That was the highest annual figure since 2018, but still 41% below the 2015 peak.
Within the 2025 recovery, buildings of nine or more storeys accounted for 28,679 approvals, compared with 16,019 for the 4-to-8 storey segment. The taller end of the market accounted for most 4+ storey apartment approvals in 2025.
Dwelling approvals by type and apartment storey height, 1990–2025
The 4+ storey band is narrow through the 1990s and widens from 2010 to a peak in 2015, then narrows again. Houses and townhouses remain within a consistent range throughout.
Note: Sub-type series available from July 1991; 1990–1991 estimates derived from total “other residential” using 1992 type ratios as a proxy. The separate 4–8 storey and 9+ storey series began July 2016; before that, only the combined 4+ storey series is available. Source: ABS Building Approvals, Australia (cat. 8731.0), Table 20, national original series.
How have low-rise apartment approvals changed over time?
One-to-two storey apartment approvals fell from around 10,000 per year in the early 1990s to around 800 by 2025, a fall of more than 90% over the period. Combined with three-storey buildings, the low-to-mid-rise apartment segment peaked at around 16,000 annually in the early 1990s, held between 5,000 and 12,000 through most of the 2000s and 2010s, then fell below 5,000 from 2018 onwards.
Townhouse and semi-detached approvals followed a more stable path, with gradual growth, lower year-to-year variation, and 34,488 approvals in 2025. That was the highest annual figure since 2021 and below the 2017 peak.
Low-rise apartment approvals by storey height, 1990–2025
One-to-two storey apartments fell from around 10,000 per year in the early 1990s to under 800 by 2025. Three-storey approvals also fell, and the combined segment has been below 5,000 per year since 2018.
Note: Sub-type series available from July 1991; 1990–1991 estimates derived from total “other residential” using 1992 type ratios as a proxy. Source: ABS Building Approvals, Australia (cat. 8731.0), Table 20, national original series.
The table below shows dwelling approvals for selected years. The highlighted row marks 2015, when total apartment approvals reached their highest share of the national total.
| Year | Houses | Semi-detached | Apartments | Total | House share | Apt share |
|---|---|---|---|---|---|---|
| 1990 | 96,204 | 22,931 | 12,132 | 131,267 | 73.3% | 9.2% |
| 1995 | 95,220 | 23,581 | 17,064 | 135,865 | 70.1% | 12.6% |
| 2000 | 95,123 | 19,290 | 24,925 | 139,338 | 68.3% | 17.9% |
| 2005 | 106,668 | 21,785 | 27,662 | 156,115 | 68.3% | 17.7% |
| 2010 | 111,815 | 27,309 | 41,684 | 180,808 | 61.8% | 23.1% |
| 2015 | 119,431 | 32,041 | 85,695 | 237,167 | 50.4% | 36.1% |
| 2020 | 119,227 | 29,966 | 37,207 | 186,400 | 64.0% | 20.0% |
| 2021 | 148,493 | 36,877 | 42,749 | 228,119 | 65.1% | 18.7% |
| 2023 | 101,972 | 28,619 | 32,798 | 163,389 | 62.4% | 20.1% |
| 2024 | 110,790 | 28,546 | 34,146 | 173,482 | 63.9% | 19.7% |
| 2025 | 113,088 | 34,488 | 48,108 | 195,684 | 57.8% | 24.6% |
Selected years shown. Full annual series available from ABS. Source: ABS Building Approvals, Australia (cat. 8731.0), Table 20, national original series.
2015 stands out across the full series: total apartments accounted for 36.1% of all approvals, and 2016 also exceeded one-third at 34.5%. By 2025, the apartment share had recovered to 24.6% and townhouse approvals had risen to 34,488. The detached house share, at 57.8%, remained well below the 70%+ levels typical of the 1990s and the high-60s to low-70s levels common through the 2000s.
SECTION 04 · EMERGING METHODS
How are modular and prefab housing methods being used in Australia?
The federal government committed $54 million to prefabricated and modular housing in March 2025, citing a government claim that prefab homes can be built up to 50% faster than traditional site-built homes. Of that total, $49.3 million goes to states and territories to grow their programmes, and $4.7 million funds a voluntary national certification process for offsite construction. No national dataset exists to track how many homes are being built using these methods.
That funding followed a sequence of policy steps. In March 2024, Building Ministers from all jurisdictions directed the Australian Building Codes Board to reduce compliance barriers for prefab and modular construction. Three months later, the Industry and Science Minister convened a dedicated industry roundtable linked to the 1.2 million homes target, visiting a Victorian facility using robotics to produce prefabricated walls, floors, and roofs. The Australian Building Codes Board handbook on prefab and offsite construction followed in November 2024.
Australian government prefab and modular housing funding, programmes and data limits
Key figures from announced federal and state programmes, as at early 2026.
Federal funding
$54M
Announced March 2025 to accelerate prefab and modular programmes
State and territory grants
$49.3M
To grow state-level prefab and modular housing programmes
National certification
$4.7M
Voluntary certification process for offsite construction systems
Speed advantage (government claim)
50%
Faster to build than a traditional site-built home
Sources: Department of Industry, Science and Resources, March 2025; Queensland Government Ministerial Media Statements; see References below. Speed claim is government-stated rationale, not independently verified.
Individual government programmes show modular construction being used at the project level. Queensland's Woree project targets 490 social, affordable, and specialist disability homes and has been described as Australia's largest residential modular development. A separate Queensland Budget programme funded up to 600 new modular homes. In New South Wales, Homes NSW has identified modern methods of construction as a way to deliver social homes faster than traditional builds, and legislative reforms have streamlined approvals for these projects.
One barrier to broader adoption is the project-by-project reassessment requirement. Under current National Construction Code provisions, the same wall system used across multiple projects must be reassessed for compliance on each one. The $4.7 million national certification process in the March 2025 package is intended to streamline offsite construction approvals and may help address this barrier. Construction sector productivity has fallen over thirty years, and the government has cited reducing per-project compliance costs as part of its rationale for the certification programme.
SECTION 05 · CURRENT DRIVERS
What is influencing Australia's shift toward apartments, townhouses and modular housing?
Total approvals reached 195,684 in 2025, up 19.8% from the post-pandemic low of 163,389 in 2023. From 2024 to 2025, the apartment share rose from 19.7% to 24.6%, townhouse approvals rose from 28,546 to 34,488, and the house share fell from 63.9% to 57.8%.
Australia needs around 240,000 completed homes per year to meet the National Housing Accord target of 1.2 million over five years from July 2024. Recent approvals averaged around 177,500 annually across 2023 to 2025. NHSAC's early-2026 modelling estimated that around 980,000 new homes could have been expected over the Accord period, approximately 82% of target, before later downside scenarios were factored in.
Planning reform may influence the dwelling mix over time. Transport-oriented development policies in New South Wales, Victoria, and Queensland allow higher-density building near train and bus corridors. Where these policies apply, they may create more capacity for medium- and higher-density approvals, although the approval impact varies by location and timing.
Construction costs have affected all dwelling types, but high-rise construction is more sensitive to cost movements than detached houses. Rising material and labour costs through 2022 and 2023 may have weighed on apartment towers in particular. Townhouse approvals recovered faster in 2024 and 2025, which may partly reflect lower cost sensitivity compared with large apartment projects. The 4+ storey segment reached 44,698 approvals in 2025, the highest since 2018, but still 41% below the 2015 peak of 75,850.
NCC pre-certification proposal
Building 4.0 CRC's 2026 submission to Treasury argues for pre-certified building systems that can be reused without full reassessment per project. The submission contends this would reduce compliance costs for modern methods of construction, particularly in high-volume social and affordable housing delivery.
State variations still apply
The National Construction Code is a national framework, but state and territory variations to planning controls, approval processes, and inspection regimes create different conditions across jurisdictions. A building system assessed in one state may require re-assessment under different conditions in another.
Supply chain and workforce constraints may also affect the dwelling mix. Detached house construction draws on a broad trade base across metro and regional markets. High-density construction is more concentrated and may be more exposed to supply chain disruptions. Townhouse approvals have recovered faster than large apartment projects, which may partly reflect these differences.
Prefab and modular construction is the government's stated response to some of those pressures. Backed by $54 million in federal funding and a government claim of up to 50% faster build times, it is positioned as a tool for accelerating delivery toward the 1.2 million homes target. The pace of uptake is not measurable from the approvals series, which does not capture construction method.
SECTION 06 · OUTLOOK
What could Australia's dwelling approval mix look like over the next decade?
The house share averaged around 62% from 2020 to 2025, above the 2015–2019 average of 53.9% but about 10 percentage points below its level in the early 1990s. Recent approvals averaged around 177,500 per year across 2023 to 2025. This is a pipeline indicator, not a completion measure. Government housing policy has identified medium- and high-density delivery as central to meeting the target, particularly in land-constrained markets.
National Housing Accord target
The Accord calls for 1.2 million new homes over five years from July 2024, equal to around 240,000 completed homes per year. Recent approvals are a pipeline indicator, not a completion measure.
Apartment approvals reached 48,108 in 2025, the highest since 2018, but still 44% below the 2015 peak of 85,695. How far they recover will depend on conditions in New South Wales and Victoria, which have historically accounted for the majority of high-density approvals nationally.
Townhouse and semi-detached approvals reached 34,488 in 2025, up 21% from 28,546 in 2024, after holding flat in 2022 and 2023. Medium-density rezoning in several states could support further growth in this segment, although those policies are at different stages of implementation across jurisdictions.
Prefab and modular uptake is not visible in the approvals series. What is on record is $54 million in federal funding, a government commitment to reduce compliance barriers, and individual programmes delivering hundreds of modular homes. Whether that translates to a structural shift in how homes are built will require data that does not yet exist.
General information only. This article draws on publicly available data from the Australian Bureau of Statistics, the Department of Industry, Science and Resources, the Australian Building Codes Board, state government housing announcements, Building 4.0 CRC and the National Housing Supply and Affordability Council. It is general information only and does not constitute financial, investment, legal, building or planning advice. All approval figures are sourced from official ABS Building Approvals data. Government funding figures and policy announcements are drawn from official Australian government and state government sources. Projection-based housing supply estimates are drawn from NHSAC modelling and may change as new data becomes available.
References
- Australian Bureau of Statistics – Building Approvals, Australia (catalogue 8731.0), Table 20, number of dwelling units approved in new residential buildings
- Department of Industry, Science and Resources – Building more homes more quickly, March 2025
- Department of Industry, Science and Resources – Building ministers progress on modular housing and new National Construction Code, March 2024
- Department of Industry, Science and Resources – Roundtable to support growth of pre-fabrication construction industry, June 2024
- Australian Building Codes Board (ABCB), Prefabricated, Modular and Offsite Construction Handbook, NCC 2022 edition, November 2024
- Queensland Government – Record investment to deliver a place to call home for more in Cairns (Woree project, 490 homes)
- Queensland Government – Homes for Queenslanders: Budget delivers plan, 600 modular homes
- NSW Government / Homes NSW – Modern methods of construction for social housing
- NSW Government – New building laws for a new era of approvals and modern methods of construction
- Building 4.0 CRC – Streamlining and Modernising the National Construction Code, submission to Treasury, February 2026
- National Housing Supply and Affordability Council – State of the Housing System 2026, April 2026
Chart Snapshots