Home insurance costs by state in Australia: where premiums are highest
Home insurance premiums vary dramatically by location. Official ACCC data compares 330 published regions, but does not provide a state-wide average for every jurisdiction.
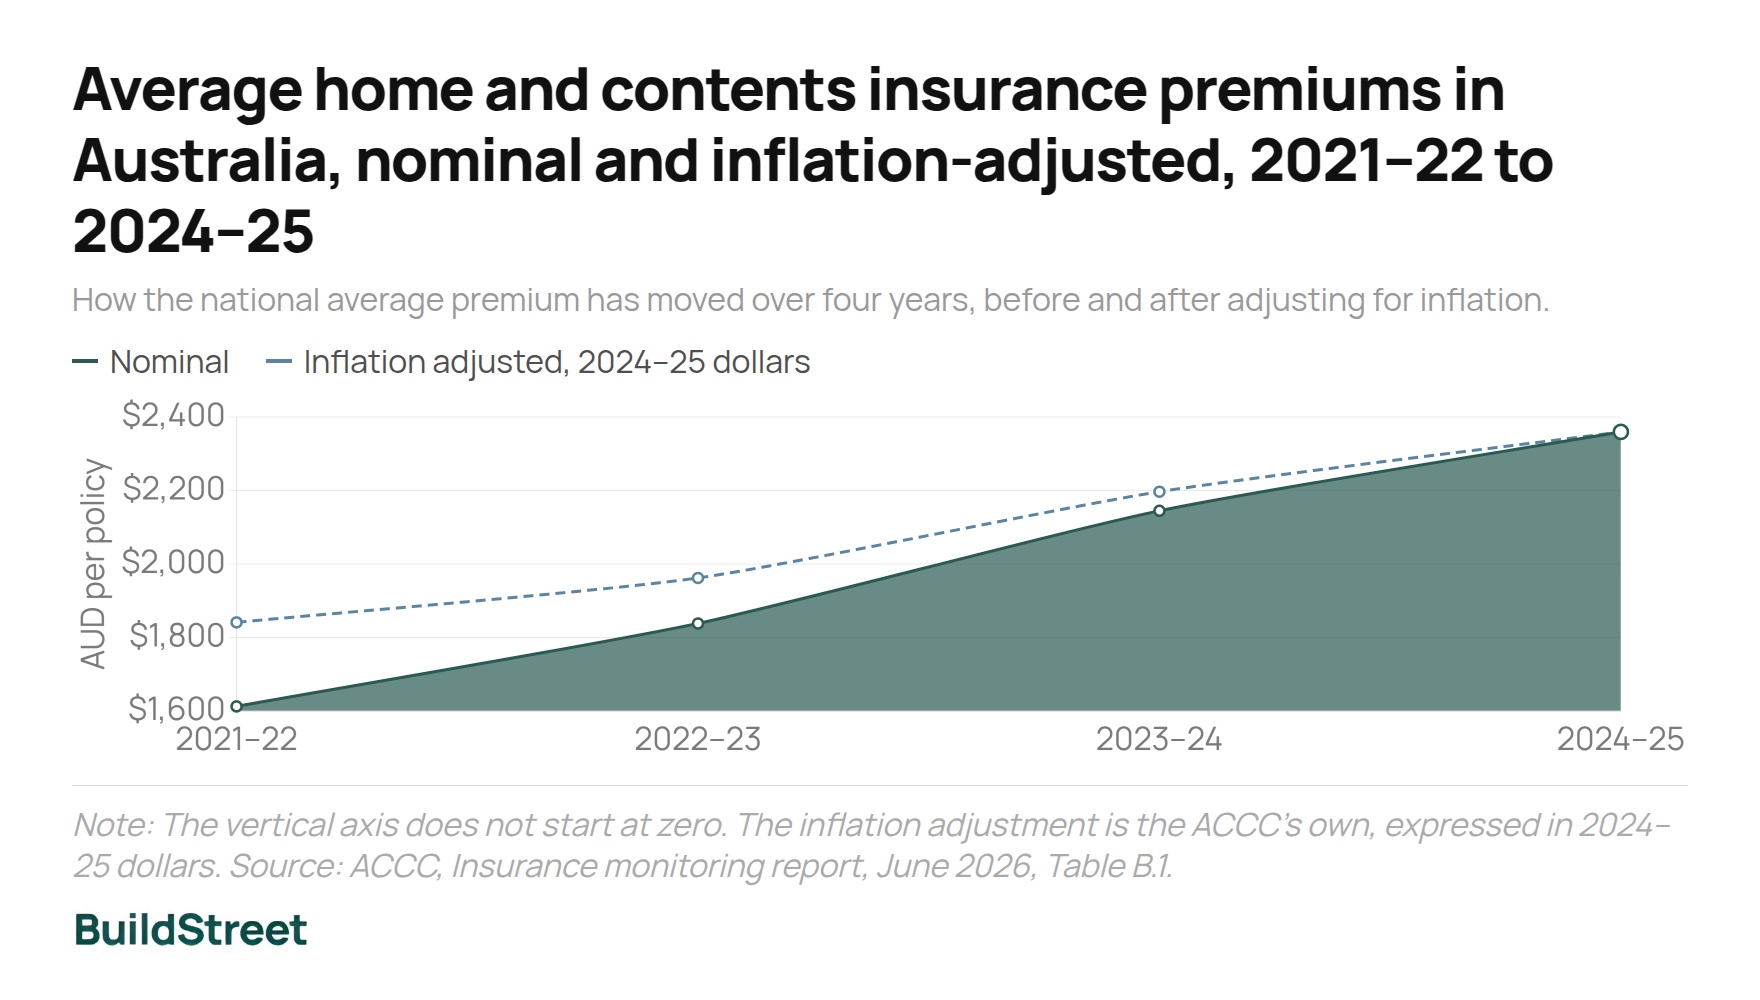
West Pilbara was the only published region where the average combined home and contents premium reached $6,250 or more in 2025. The national mean premium was $2,360 per policy in 2024–25.
Highest premium band
$6,250+
West Pilbara, 2025
National mean
$2,360
Combined cover, 2024–25
Real increase
+28.2%
Since 2021–22
Regions at $5,000+
10 of 330
Across five jurisdictions
Northern Australia mean
$3,233
$923 above the rest
Regions under $3,750
89.4%
295 published regions
Source: Premium bands are ranges rather than exact averages. Region counts describe published regions, not policies or households. ACCC Insurance monitoring report and supplementary data, June 2026.
Home insurance costs in Australia
National premiums, location risk and the forces pushing prices higher.
Read full article →Underinsurance in Australia
How sums insured can fall behind rebuilding costs.
Read full article →SECTION 01 · NATIONAL PICTURE
Which Australian regions have the highest home insurance premiums?
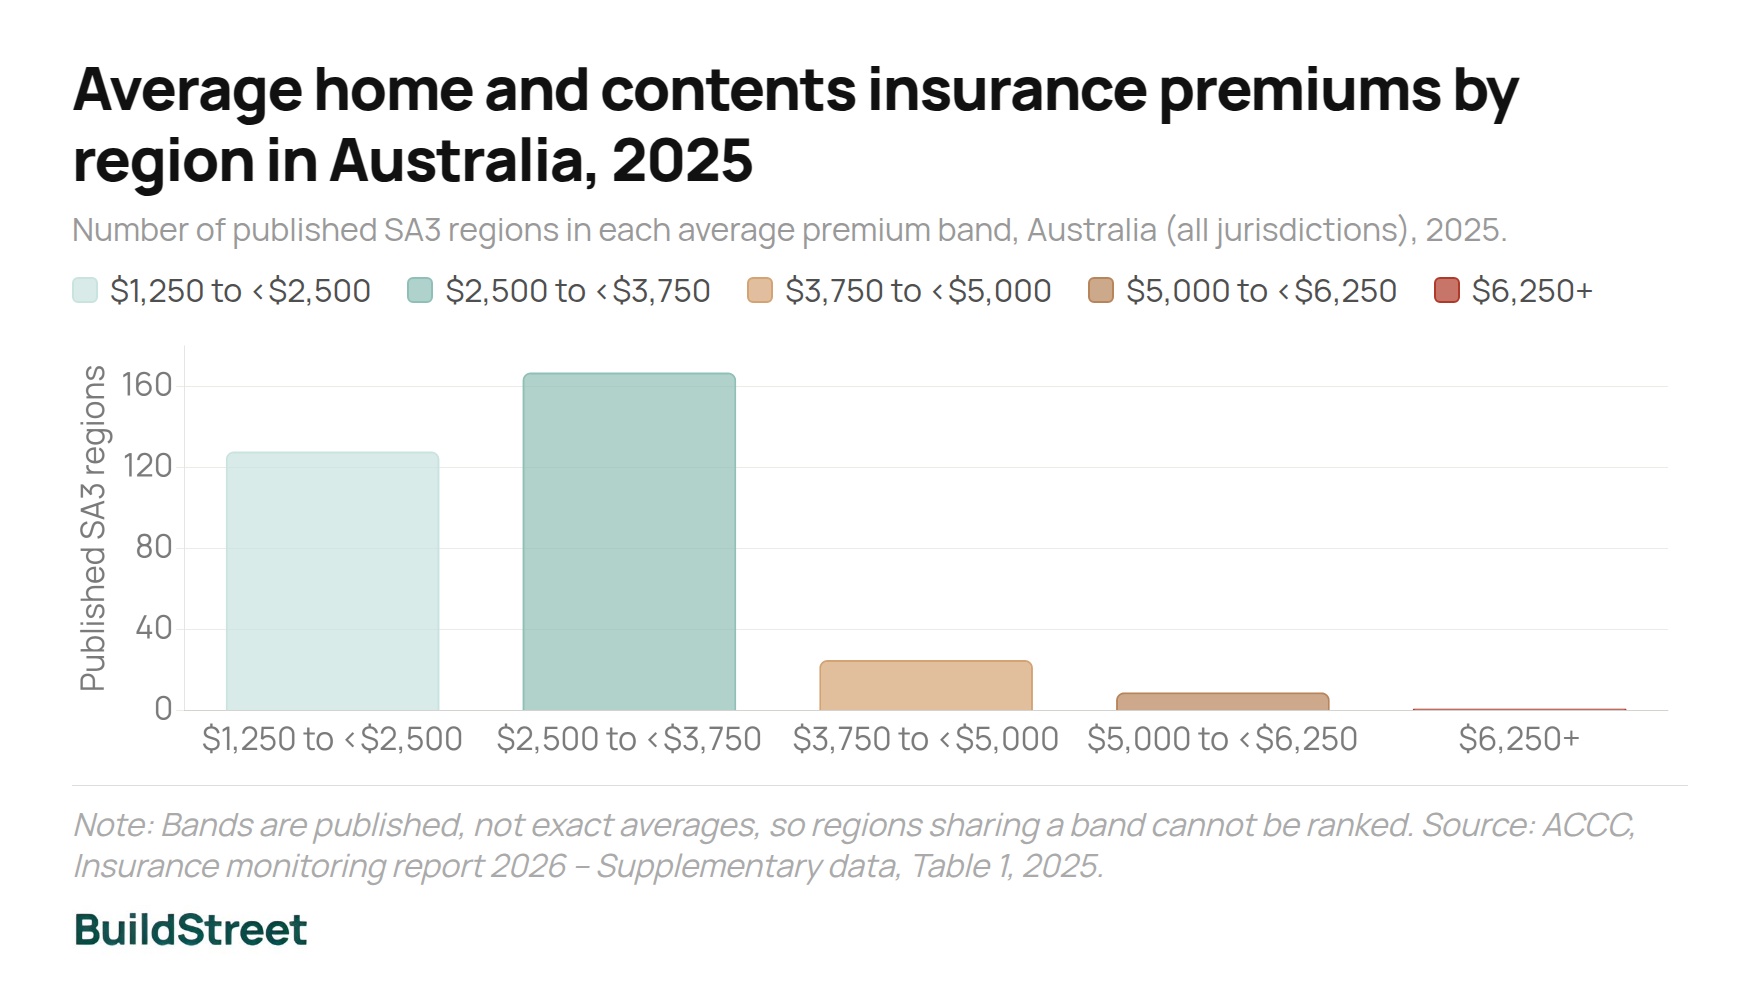
Ten published regions have an average premium of $5,000 or more. Six are in north Western Australia and the Northern Territory. At the other end, 295 regions sit below $3,750.
Regions sharing a band cannot be ranked, and a band midpoint is not an average.
Published regions
330
At $3,750+
35 (10.6%)
Highest band
$6,250+
Regions in the selected jurisdiction's highest published ranges
West Pilbara — $6,250+ · Dural – Wisemans Ferry — $5,000–<$6,250 · Eastern Suburbs – North — $5,000–<$6,250 · Darwin City — $5,000–<$6,250 · East Arnhem — $5,000–<$6,250 · Surfers Paradise — $5,000–<$6,250 · Stonnington – West — $5,000–<$6,250 · East Pilbara — $5,000–<$6,250 · Gascoyne — $5,000–<$6,250 · Kimberley — $5,000–<$6,250
Published premium bands: Australia
Number of published SA3 regions in each annual average premium band.
$1,250 to <$2,500
Bands are ranges, not exact averages. Source: ACCC supplementary data, 2025.
Average home and contents insurance premiums in Australia, 2021–22 to 2024–25
National mean premium, nominal and inflation-adjusted in 2024–25 dollars.
The inflation adjustment is the ACCC's own. Both series are means per policy. Source: ACCC Insurance monitoring report, June 2026.
Distribution of home insurance premium bands by state and territory, 2025
Share of each jurisdiction's published SA3 regions in each premium band.
Published regions: NSW 89, Qld 81, Vic 66, WA 34, SA 28, Tas 15, NT 9 and ACT 8. Source: ACCC supplementary data, 2025.
| ACCC monitoring region | 2023–24 | 2024–25 | Calculated change |
|---|---|---|---|
| North Western Australia | $4,618 | $4,966 | +7.5% |
| Northern Territory | $3,337 | $3,546 | +6.3% |
| North Queensland | $3,006 | $3,117 | +3.7% |
| Rest of Australia | $2,094 | $2,310 | +10.3% |
The ACCC insurance monitoring programme has concluded
The June 2026 report ended the monitoring role tied to the cyclone reinsurance pool. Unless another agency reproduces these SA3 bands, the 2025 data remains the latest official regional picture.
SECTION 02 · NEW SOUTH WALES
Home insurance premiums in New South Wales
Two of 89 published NSW regions are in the state's highest band of $5,000 to under $6,250: Dural–Wisemans Ferry and Eastern Suburbs–North. Nine more sit between $3,750 and $5,000.
New South Wales, 2025
Published
89
$3,750+
11 (12.4%)
Top band
$5,000 to <$6,250
Highest listed areas: Dural – Wisemans Ferry · Eastern Suburbs – North · Clarence Valley · Hawkesbury · Ku-ring-gai · Manly · Moree – Narrabri · North Sydney – Mosman · Pittwater · Richmond Valley – Coastal · Tweed Valley
The higher bands span high-value Sydney districts, northern coastal regions and inland areas, showing that raw premiums reflect insured value as well as risk.
SECTION 03 · VICTORIA
Home insurance premiums in Victoria
Stonnington–West is Victoria's only region in the $5,000 to under $6,250 band. Manningham–East is the only other Victorian region at $3,750 or more.
Victoria, 2025
Published
66
$3,750+
2 (3%)
Top band
$5,000 to <$6,250
Highest listed areas: Stonnington – West · Manningham – East
Most Victorian regions are in the lowest band: 43 of 66, or 65.2%, average below $2,500.
SECTION 04 · QUEENSLAND
Home insurance premiums in Queensland
Queensland has the largest number of higher-cost regions. Thirteen of 81 published regions are at $3,750 or more. Surfers Paradise is the only one above $5,000.
Queensland, 2025
Published
81
$3,750+
13 (16%)
Top band
$5,000 to <$6,250
Highest listed areas: Surfers Paradise · Brisbane Inner – East · Brisbane Inner – North · Brisbane Inner – West · Broadbeach – Burleigh · Coolangatta · Gold Coast – North · Kenmore – Brookfield – Moggill · Mudgeeraba – Tallebudgera · Noosa · Sherwood – Indooroopilly · Townsville · Whitsunday
The higher-cost areas are split between Brisbane and the south-east coast, and Townsville and Whitsunday in the tropical north. North Queensland's separately published mean was $3,117 in 2024–25.
SECTION 05 · WESTERN AUSTRALIA
Home insurance premiums in Western Australia
West Pilbara is the country's only published region in the $6,250+ band. East Pilbara, Gascoyne and Kimberley are between $5,000 and $6,250, while Cottesloe–Claremont is between $3,750 and $5,000.
Western Australia, 2025
Published
34
$3,750+
5 (14.7%)
Top band
$6,250+
Highest listed areas: West Pilbara · East Pilbara · Gascoyne · Kimberley · Cottesloe – Claremont
At the same time, 25 of WA's 34 published regions are below $2,500. North Western Australia's separate monitoring-region mean was $4,966 in 2024–25.
SECTION 06 · SOUTH AUSTRALIA AND TASMANIA
Home insurance premiums in South Australia and Tasmania
Neither jurisdiction has a published region at $3,750 or more. Six South Australian regions and two Tasmanian regions are in the $2,500 to under $3,750 band; all others are below $2,500.
South Australia, 2025
Published
28
$3,750+
0 (0%)
Top band
$2,500 to <$3,750
Highest listed areas: Adelaide City · Adelaide Hills · Burnside · Norwood – Payneham – St Peters · Prospect – Walkerville · Unley
Tasmania, 2025
Published
15
$3,750+
0 (0%)
Top band
$2,500 to <$3,750
Highest listed areas: Hobart Inner · Huon – Bruny Island
Tasmania has the country's largest share in the lowest band, at 86.7% of its 15 published regions.
SECTION 07 · THE TERRITORIES
Home insurance premiums in the ACT and Northern Territory
The ACT's eight regions split evenly between the two lowest bands. The Northern Territory shows the opposite pattern: four of nine regions are at $3,750 or more, and none is below $2,500.
Australian Capital Territory, 2025
Published
8
$3,750+
0 (0%)
Top band
$2,500 to <$3,750
Highest listed areas: Canberra East · North Canberra · South Canberra · Woden Valley
Northern Territory, 2025
Published
9
$3,750+
4 (44.4%)
Top band
$5,000 to <$6,250
Highest listed areas: Darwin City · East Arnhem · Darwin Suburbs · Litchfield
The NT is the only jurisdiction with a published territory-wide mean
Its boundary matches an ACCC monitoring region. The mean combined premium was $3,546 in 2024–25, up from $3,337.
SECTION 08 · LOCAL RISK
Why home insurance premiums vary by location
A raw premium reflects both the rate charged for risk and the amount insured. Standardised premiums per $100,000 sum insured were $304 nationally, $494 in northern Australia and $295 elsewhere in 2024–25.
Average premium per $100,000 sum insured by ACCC region, 2021–22 to 2024–25
Standardising for the amount insured narrows the regional gap but does not remove it.
Northern Australia is an ACCC monitoring region, not a state grouping. Source: ACCC Insurance monitoring report, June 2026.
Average premiums differ by insurance product
Combined, building-only and contents-only figures describe separate products, not components of one policy, and should not be added together.
| Product | 2021–22 | 2024–25 | Nominal change | Per $100,000 |
|---|---|---|---|---|
| Combined home and contents | $1,612 | $2,360 | +46.4% | $304 |
| Home building only | $1,248 | $1,852 | +48.4% | $331 |
| Home contents only | $442 | $531 | +20.1% | $636 |
Cyclone-risk premiums vary within the same category
For medium-to-high cyclone risk areas, the post-pool average was $628 per $100,000 insured, compared with $355 in low-risk areas and $300 where cyclone risk was nil. Within the medium-to-high category, the post-pool median was $551 and the 95th percentile was $1,220, or 2.21 times the median.
| Cyclone risk | Pre-pool premium | Post-pool premium | Pre-pool per $100k | Post-pool per $100k |
|---|---|---|---|---|
| Medium to high | $3,885 | $3,823 | $708 | $628 |
| Low | $2,233 | $2,458 | $345 | $355 |
| Nil | $2,091 | $2,320 | $283 | $300 |
Selected city premiums after pool entry
| City | State | Premium per $100,000 | Change |
|---|---|---|---|
| Karratha | Western Australia | $824 | −15% |
| Mackay | Queensland | $619 | −14% |
| Cairns | Queensland | $556 | −12% |
| Brisbane | Queensland | $352 | +2% |
| Sydney | New South Wales | $281 | +7% |
Premium averages also reflect taxes and address-level pricing
Published means include GST, stamp duty and applicable levies, so jurisdiction differences do not reflect risk alone. Means can also be pulled upward by expensive policies, while insurers increasingly price natural-peril risk at individual-address level.
The latest complete historical state comparison is from 2015–16
The ABS figures measure household spending, including households without a policy. They are not directly comparable with ACCC mean premiums. Very Remote areas were excluded, affecting about 22% of the Northern Territory population.
| State or territory | Weekly spending | Annualised | Relative standard error |
|---|---|---|---|
| Northern Territory | $22.27 | $1,158 | 8.3% |
| Queensland | $20.32 | $1,057 | 3.4% |
| Tasmania | $17.70 | $920 | 4.9% |
| New South Wales | $17.48 | $909 | 3.0% |
| Western Australia | $16.50 | $858 | 4.6% |
| Australian Capital Territory | $14.48 | $753 | 5.6% |
| South Australia | $13.93 | $724 | 3.3% |
| Victoria | $13.81 | $718 | 2.9% |
| Australia | $16.74 | $870 | 1.6% |
Methodology and data limitations
No government source publishes an average home insurance premium for every state and territory. The SA3 data reports bands, not exact averages. Twenty-nine of 359 SA3 regions were withheld for insufficient data. Premiums are means and include GST, stamp duty and applicable levies.
References
- ACCC, Insurance monitoring report and supplementary data, June 2026
- ABS, Household Expenditure Survey, 2015–16
- APRA, Quarterly general insurance performance statistics
Chart Snapshots