How many Australian households are underinsured?
Insurance premiums, rebuilding costs and climate-related disasters have all increased the potential for home insurance underinsurance in Australia.
Insurance prices rose 52.7% between December 2019 and March 2026, while house construction output prices rose 48.3%. A sum insured set in December 2019 and never adjusted would equal about 67.4% of the equivalent March 2026 index value, an index-based shortfall of 32.6%.
Insurance prices
+52.7%
December 2019 to March 2026
House construction prices
+48.3%
Over the same period
Index-based shortfall
32.6%
If a 2019 sum insured was never adjusted
Average approved new house
$514,782
12 months to May 2026, excluding land
Building underinsurance
7.8%
Self-reported by insured homeowners, 2023
House construction cost statistics in Australia
How build costs moved by state since 2019 and where pressure has been strongest.
Read full article →Are some Australian homes becoming harder to insure?
Premium trends, climate exposure and the difference between availability and affordability.
Read full article →SECTION 01 · DEFINITIONS
What is underinsurance and how does it differ from non-insurance?
Non-insurance means holding no building policy at all. Underinsurance means holding a policy, but the payout would fall short of the full cost of rebuilding or replacing what is covered. The two are often reported together, but they measure different things.
The ACCC estimated that about 20% of potentially insurable properties in Northern Australia and about 11% in the rest of Australia had no home building insurance. Separately, HILDA found that 7.8% of insured homeowners said their policy would not fund a full rebuild.
Underinsurance
Has a policy, sum insured too low
Current self-reported estimate: 7.8%
Verified administrative estimate: none
Non-insurance
Has no policy at all
Northern Australia: about 20%
Rest of Australia: about 11%
Cost pressure
Insurance prices: +52.7%
Construction prices: +48.3%
Period: Dec 2019 to Mar 2026
Source: ASIC, Getting home insurance right, 2005; ACCC Northern Australia Insurance Inquiry, 2019; ABS price indexes, March 2026.
SECTION 02 · NATIONAL PREVALENCE
Building and contents insurance cover falls short for some Australians
In 2023, 7.8% of Australian homeowners with building insurance said their policy would not fund a complete rebuild, while 15.1% of people with contents insurance said their cover would not replace all their contents. A further 3.7% of homeowners had no building insurance.
How the HILDA estimate should be read
The results come from yes-or-no questions and measure what households believe about their cover. They do not verify each policy against an independently assessed rebuild cost. Wave 23 interviewed 15,987 people.
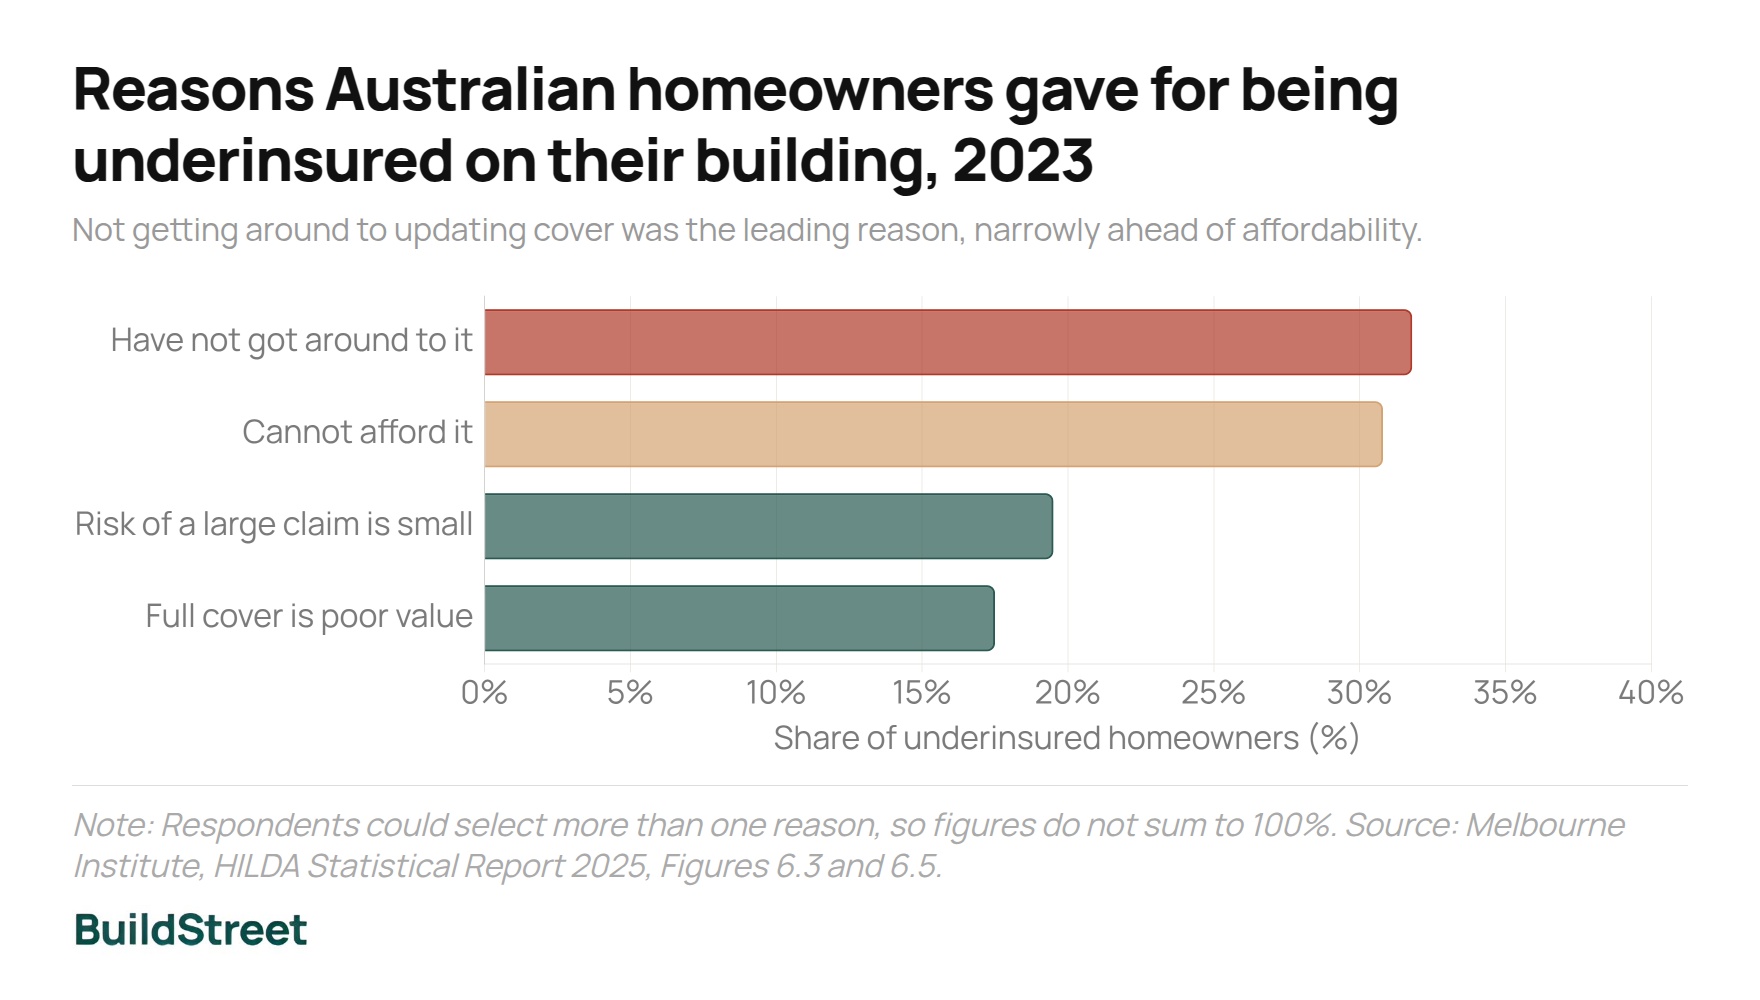
Why Australian homeowners report being underinsured
Not updating cover was the leading reason, narrowly ahead of affordability. Respondents could select more than one reason.
Reasons Australian homeowners gave for being underinsured on their building, 2023
Not getting around to updating cover was the leading reason, narrowly ahead of affordability.
Respondents could select more than one reason. A further 14.6% selected “other”. Source: Melbourne Institute, HILDA Statistical Report 2025.
Contents insurance shortfalls are more common than building insurance shortfalls
Contents insurance ownership varies sharply by tenure, although underinsurance among those who hold a policy is close to 15% for most groups.
| Housing tenure | Have contents insurance | Of those, underinsured |
|---|---|---|
| Owner outright | 90.4% | 15.0% |
| Owner with mortgage | 84.7% | 15.0% |
| Private rental | 30.6% | 15.1% |
| Social housing | 14.9% | 27.1% |
Why Australia has no official underinsurance statistic
No Australian source tests every policy against an individual rebuilding cost. The ACCC concluded that regional underinsurance could not be estimated with confidence, and APRA excluded underinsurance from its 2026 climate stress test because it was too complex to model.
A widely repeated statistic is not an APRA finding
A claim that APRA found 83% of Australian homes underinsured, with an average gap of 34%, appears on commercial websites. APRA published no such finding. The 83% figure came from a 2013 survey using a broader definition, while the 34% gap came from a separate 2000 study. Neither is comparable with HILDA’s 2023 estimate.
SECTION 03 · COSTS AND PREMIUMS
How insurance prices and rebuilding costs have changed since 2019
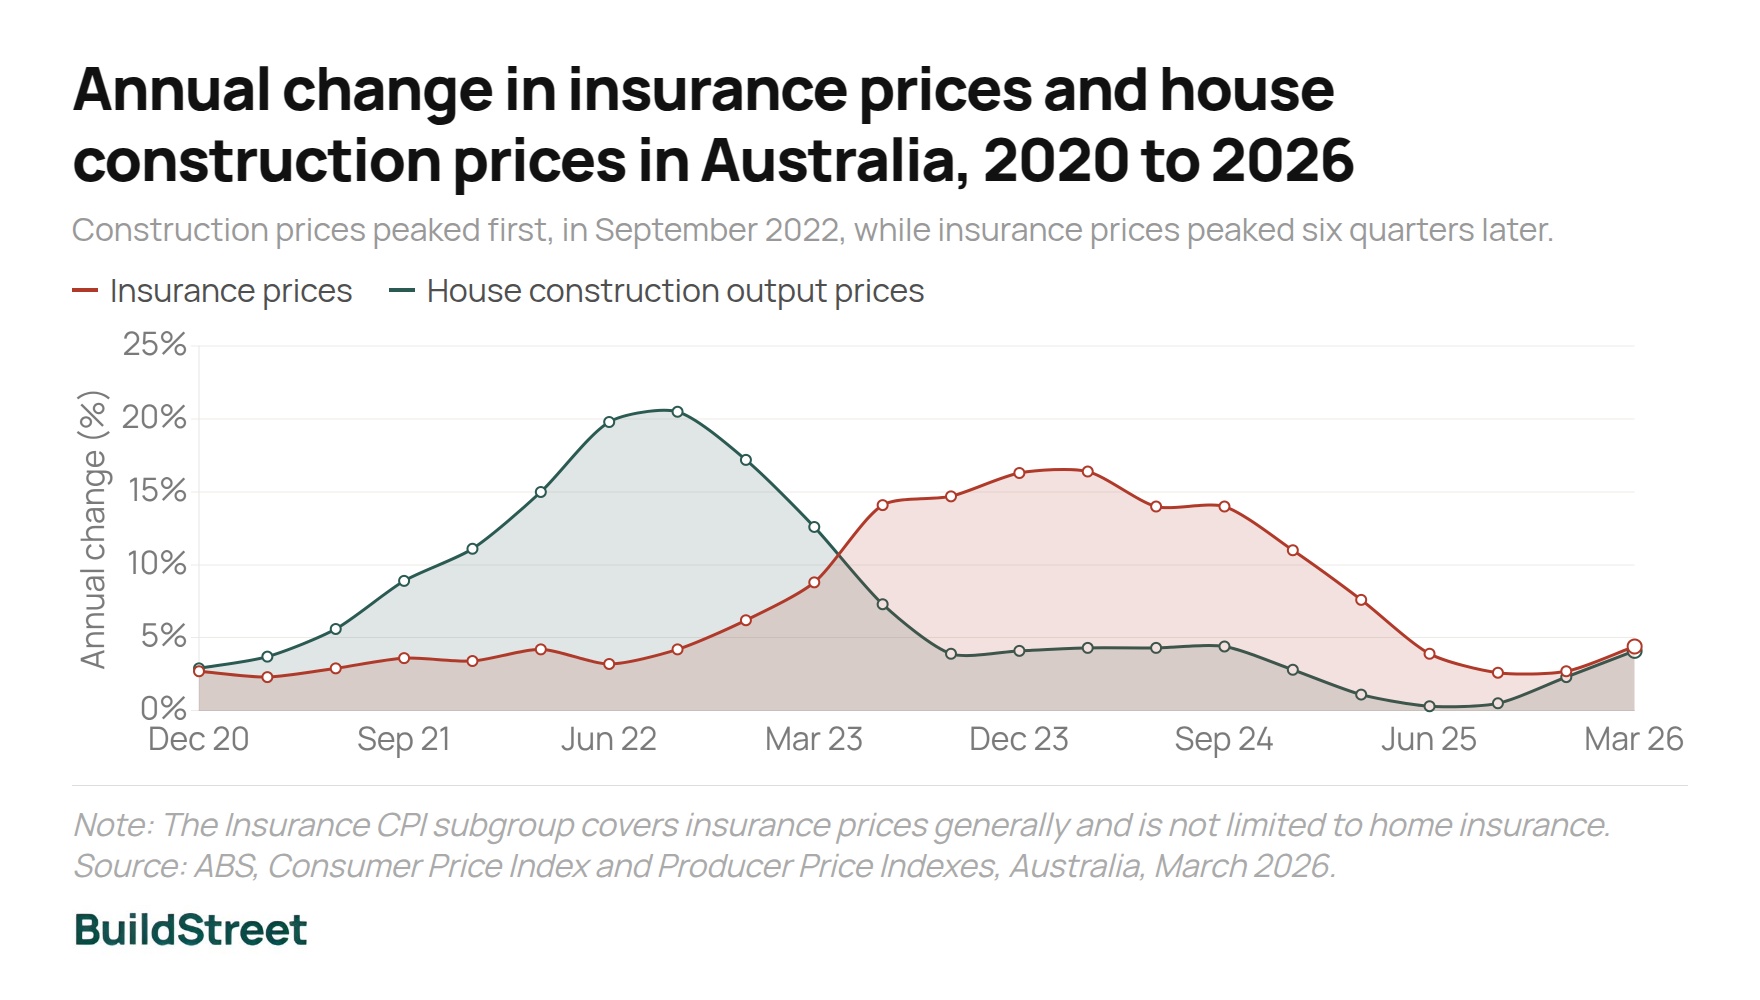
House construction prices rose first, peaking at an annual increase of 20.5% in September 2022. Insurance prices peaked six quarters later at 16.4% in March 2024. The overlapping pressures increased both the cover required and the cost of maintaining it.
Annual change in insurance prices and house construction prices in Australia, 2020 to 2026
Construction prices peaked first, in September 2022; insurance prices peaked six quarters later.
- Insurance prices
- House construction output prices
The insurance subgroup covers insurance prices generally. Source: ABS Consumer Price Index and Producer Price Indexes, March 2026.
In evidence to the 2024 flood inquiry, insurers reported that some policyholders were reducing sums insured to manage premium costs. In a Northern Australian survey, 17% of policyholders who sought calculator or call-centre help selected a lower amount than recommended, mainly because of cost. Neither figure can estimate national prevalence.
SECTION 04 · STATE COMPARISON
How rebuilding cost increases vary across Australian states and territories
Since December 2019, house construction prices have doubled in Western Australia and risen by less than a fifth in the Northern Territory. The resulting index-based shortfall depends on where a property is located and when its sum insured was last reviewed.
$500,000 in December 2019 tracks to $741,508 today
In Australia, prices rose 48.3%. An unchanged amount would equal 67.4% of the March 2026 index value, a 32.6% shortfall.
Sum insured shortfall by Australian state and territory, at March 2026 prices
Calculated from the selected base quarter; the selected region is highlighted.
This is an index calculation, not a rebuild quotation. Source: ABS Producer Price Indexes, March 2026, Table 17.
Average approved construction values across Australian states and territories
The average approved construction value of a new Australian house was $514,782 in the 12 months to May 2026. These values exclude land and are not insured rebuild quotations.
| State or territory | Price change | 2019 shortfall | Average approved value |
|---|---|---|---|
| Western Australia | +100.1% | 50.0% | $470,879 |
| Tasmania | +61.4% | 38.0% | $427,772 |
| South Australia | +60.0% | 37.5% | $436,687 |
| Queensland | +55.8% | 35.8% | $526,026 |
| Australian Capital Territory | +48.1% | 32.5% | $506,350 |
| New South Wales | +40.7% | 28.9% | $562,780 |
| Victoria | +34.0% | 25.4% | $527,289 |
| Northern Territory | +18.8% | 15.8% | $542,724 |
| Australia | +48.3% | 32.6% | $514,782 |
Source: ABS Producer Price Indexes, March 2026; ABS Building Approvals, May 2026.
SECTION 05 · DISASTER EVIDENCE
What Australia's 2022 floods show about underinsurance
Four declared flood events in 2022 produced 305,769 claims worth $7.73 billion. These figures show the number and cost of claims, not whether payouts were enough to rebuild or replace what was insured.
| Event | Claims lodged | Incurred cost | Closed |
|---|---|---|---|
| CAT 221, south-east Qld and northern NSW | 244,398 | $6.32b | 98.4% |
| SE 222 | 23,618 | $296.9m | 98.7% |
| CAT 223 | 22,890 | $859.6m | 96.0% |
| SE 224 | 14,863 | $257.0m | 97.9% |
| Total | 305,769 | $7.73b | 98.3% |
Historical disasters have increased rebuilding costs by up to 75%
When many homes are damaged in one area, demand for builders and materials can raise local costs. Historical evidence uses different methods and cannot be converted into a national estimate.
| Event | Year | Recorded effect |
|---|---|---|
| Cyclone Tracy, Darwin | 1974 | Rebuilding costs reportedly increased by 75% |
| Newcastle earthquake | 1989 | Rebuilding costs reportedly increased by 35% |
| ACT bushfires | 2003 | 488 homes destroyed; ASIC identified six homeowners with no building insurance |
| ACT bushfires, comparable rebuilds | 2003 | Average underinsurance shortfall of 27% across 19 rebuilds; another review reported 40% |
| Blue Mountains bushfires | 2013 | IAG reported 35% of affected residents were underinsured based on NRMA claims data |
SECTION 06 · RENTERS AND CONTENTS
Contents insurance remains uncommon among Australian renters
Around 40% of renters had no contents insurance, compared with roughly 6% to 7% of homeowners. In the ACCC survey, 59% of renters in Northern Australia and 58% elsewhere held contents cover.
Estimated home building non-insurance rate in Australia, by state and territory
The Northern Territory has the highest rate at 26%, more than three times South Australia’s 7%.
Northern Australia figures use 2016–17 data; the rest of Australia uses 2017–18. Source: ACCC Northern Australia Insurance Inquiry, 2019.
The building non-insurance estimates range from 26% in the Northern Territory to 7% in South Australia. They are historical non-insurance estimates, not measures of whether insured properties had adequate cover.
SECTION 07 · COST PRESSURE
How insurance costs can contribute to underinsurance
Higher insurance costs can increase affordability pressure. NSW Treasury estimates the Emergency Services Levy added an average of 18% to residential base premiums since 2017–18, including flow-on GST and stamp duty. Treasury states the levy contributes to underinsurance and non-insurance.
Home insurance affordability stress
The Actuaries Institute estimated 1.61 million households, or 15%, were home insurance affordability-stressed in the year to March 2024. They spent an average of 9.6 weeks of gross income on home insurance. This measures affordability, not cover adequacy.
How Northern Australians calculate their building insurance cover
Sixty-four per cent used an estimate of rebuilding costs, while some relied on purchase price, sale value or what they could afford. Respondents could select more than one method.
| Method used to set the sum insured | Share of respondents |
|---|---|
| An estimate of rebuilding cost | 64% |
| What they paid for the house | 25% |
| What they could sell it for | 17% |
| What they could afford | 14% |
| An online calculator | 12% |
| Advice from a broker | 12% |
| Advice from a call centre | 10% |
SECTION 08 · MEASUREMENT AND POLICY
Why home insurance rebuild estimates can vary
Estimates for rebuilding the same house have varied by as much as 169% between insurers’ calculators. CHOICE later found estimates for one property ranging from $601,000 to $753,000 across ten insurer brands.
Changes to building standards also matter. Rebuilds may need to meet newer energy-efficiency or livable-housing rules, but jurisdictions adopted these provisions on different dates.
| State or territory | General NCC 2022 | Energy efficiency | Livable housing |
|---|---|---|---|
| New South Wales | 1 May 2023 | 1 October 2023, Enhanced BASIX | Not adopted |
| Victoria | 1 May 2023 | 1 May 2024 | 1 May 2024 |
| Queensland | 1 May 2023 | 1 May 2024 | 1 October 2023 |
| South Australia | 1 May 2023 | 1 October 2024 | 1 October 2024 |
| Western Australia | 1 May 2023 | 1 May 2025 | Not adopted |
| Tasmania | 1 May 2023 | Not adopted | Staged from 1 October 2024 |
| Northern Territory | 1 May 2023 | 1 October 2023, 5-star housing only | 1 October 2023 |
| Australian Capital Territory | 1 May 2023 | 15 January 2024 | 15 January 2024 |
Key insurance recommendations from the 2024 flood inquiry
Recommendation 24
Clearer information about determining sums insured and factors needed for adequate total-loss cover.
Recommendation 25
Warn policyholders where cover may not fund a full rebuild and keep calculators current.
Recommendation 26
Allow more flexible rebuilds so size or scope can be traded for resilience and efficiency.
Status as at July 2026
A redrafted General Insurance Code of Practice was released for consultation from 24 June to 21 July 2026. It had not commenced, and no commencement date had been fixed.
References
- ABS, Producer Price Indexes, Australia, March 2026
- ABS, Consumer Price Index, Australia, March 2026
- APRA, Mind the Gap, March 2026
- ASIC, Getting home insurance right, September 2005
- ACCC, Northern Australia Insurance Inquiry, 2019
- Parliament of Australia, Flood failure to future fairness, 2024
- Melbourne Institute, HILDA Statistical Report 2025
- CHOICE, testing of insurer sum insured calculators
Chart Snapshots