How many Australians live in share housing? 2021 Census data
At the 2021 Census, 848,162 Australians were classified as group-household members — 3.6% of people in occupied private dwellings. A total of 361,822 group households were recorded, equal to 3.9% of all classified occupied private households.
Group households are two or more unrelated people aged 15 and over sharing a dwelling with no family relationship. Rates are highest among people aged 25 to 34 and in Greater Darwin.
Group-household members, 2021
848,162
3.6% of people in occupied private dwellings, counted at usual address
Highest capital-city rate
5.6%
Greater Darwin; group households as share of classified households
Growth among residents aged 55+
+53.8%
Increase in group-household residents aged 55 and over between 2011 and 2021
What is driving housing demand in Australia in 2026?
Population growth, migration and household formation data, and how they compare with new housing supply.
Read full article →Australia's average household size and what smaller households mean for housing demand
How changes in household size are reshaping dwelling demand across Australia.
Read full article →SECTION 01 · THE NATIONAL PICTURE
How many people in Australia live in group households?
At the 2021 Census, 848,162 people were classified as group-household members, counted at their usual address. Separately, 361,822 group households were recorded based on where people were on Census night, equal to 3.9% of all classified occupied private households. Group-household members accounted for 3.6% of all people living in occupied private dwellings nationally.
The ABS defines a group household as two or more unrelated people, all aged 15 or over, sharing a dwelling with no couple, parent-child or other family relationship. An unrelated boarder or flatmate living inside an otherwise family household is classified under that family's household type rather than as a group household.
What counts as a group household?
For dwellings that can be classified, the ABS sorts households into three main types on Census night. Homes with only visitors, or that cannot be classified, are left out of these percentages.
- Family households, based on a couple, parent-child or other family relationship
- Lone person households, one person living alone
- Group households, two or more unrelated people aged 15 and over
Household types in Australia, 2021
Family, lone person and group households as a share of all 9.28 million classified households.
Group households
Group households are the least common of the three main classified household types. Their share fell from 4.3% in 2016 to 3.9% in 2021, even as the number of group households and residents increased.
361,822
Group households, 2021
3.9%
Share, 2021
4.3%
Share, 2016
Source: ABS Census, Time Series Profile, Table T14, 2016 and 2021.
The person and household counts above use different counting methods: people are counted by usual address, while households are counted by Census-night location. A separate ABS estimate places the average at approximately 2.3 people per group household in 2021.
SECTION 02 · THE TWENTY-YEAR TREND
How group households in Australia have changed since 2001
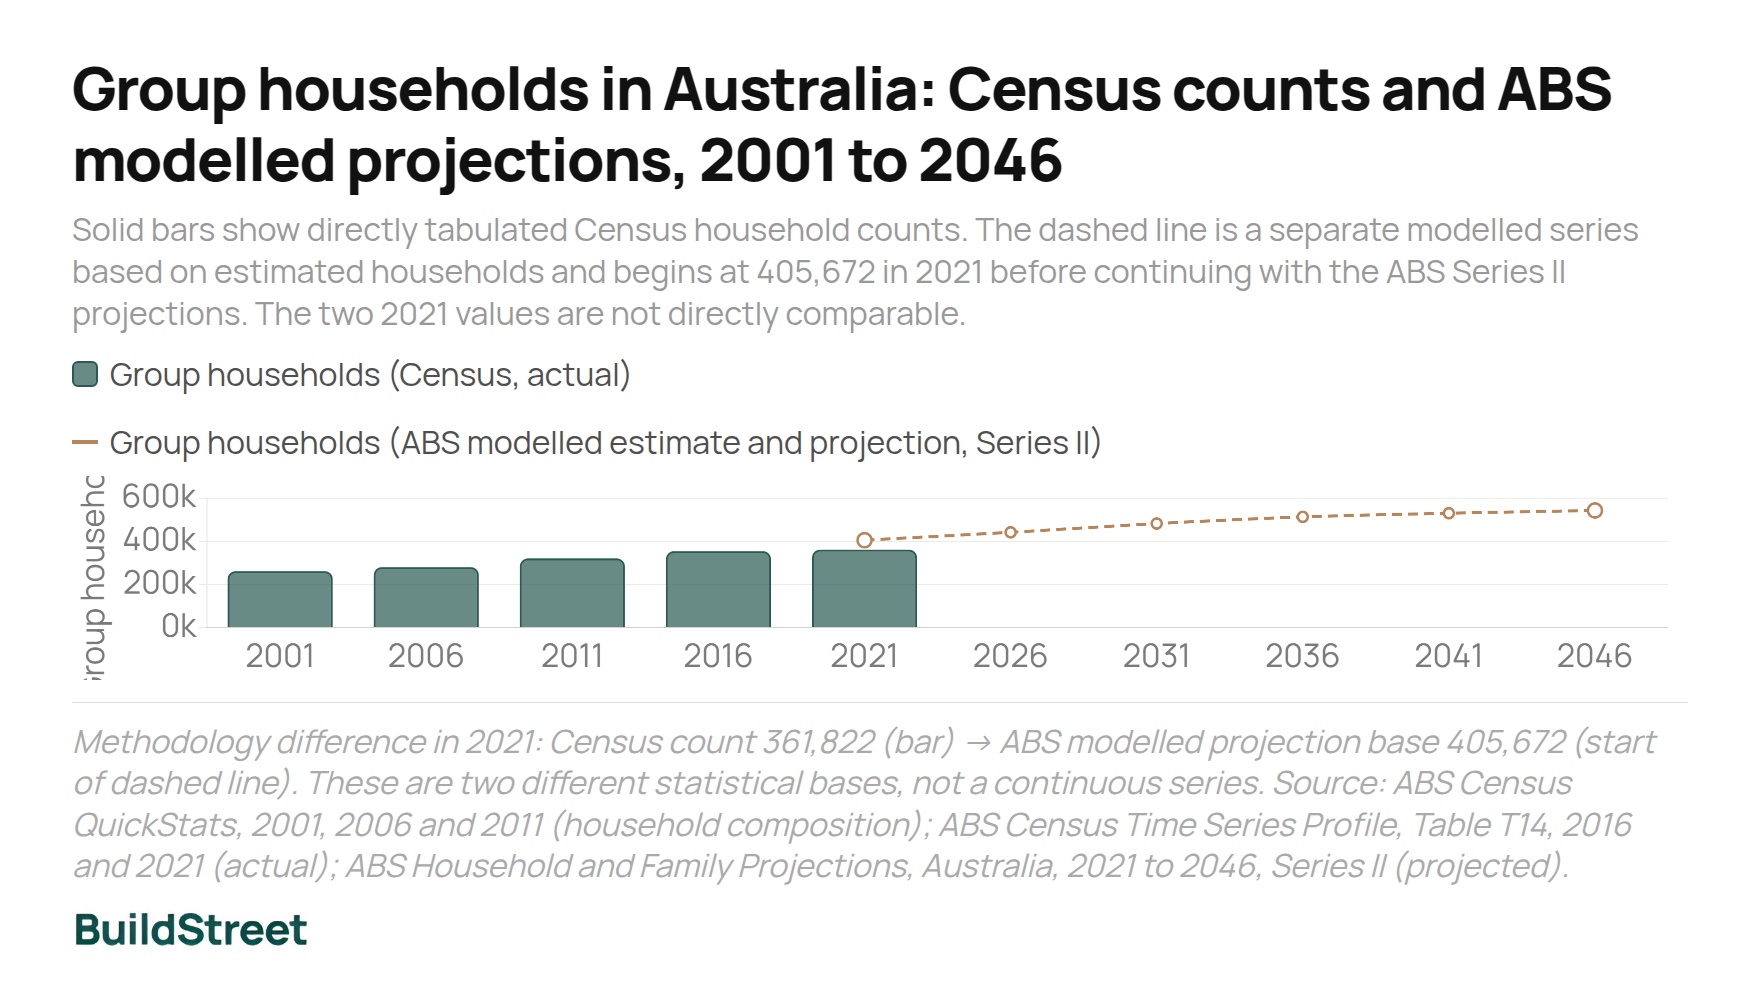
The number of group households has increased at every Census since 2001, from 262,551 that year to 280,856 in 2006, 321,007 in 2011, 354,911 in 2016 and 361,822 in 2021.
Using a consistent method, group households made up approximately 3.9% of all households in both 2001 and 2006. The share rose to 4.1% in 2011 and 4.3% in 2016, before falling to 3.9% in 2021.
Group households in Australia: Census counts and ABS modelled projections, 2001 to 2046
Solid bars show directly tabulated Census household counts. The dashed line is a separate modelled series that begins at 405,672 in 2021 before continuing with ABS Series II projections. The two 2021 values are not directly comparable.
Source: ABS Census 2001–2021; ABS Household and Family Projections, 2021 to 2046 (Series II).
Why do the chart and table show different figures for 2021?
The ABS builds its household projections from a different starting point from the Census count. Its modelled 2021 estimate is 405,672 group households, compared with the 361,822 households counted directly in the Census. The gap reflects different methods rather than an error.
Under the middle (Series II) projection, group households are expected to reach between 506,371 and 608,518 by 2046, equal to 3.6% to 4.6% of all modelled households.
Why did the share of group households rise and then fall?
Between 2016 and 2021, lone-person households grew by around 17%, while group households grew by roughly 2%. Family households also grew, adding more households in absolute terms than lone-person households. Growth in family and lone-person households pushed group households to a smaller share of the total, even as the number of group households continued to rise.
AHURI suggests COVID-19 may have contributed to the slow growth in group households between 2016 and 2021, though it describes this as "very possible" rather than a proven cause.
The next Census will be held on 11 August 2026, with results released in phases from June 2027.
SECTION 03 · AGE GROUPS
Which age groups are most likely to live in a group household?
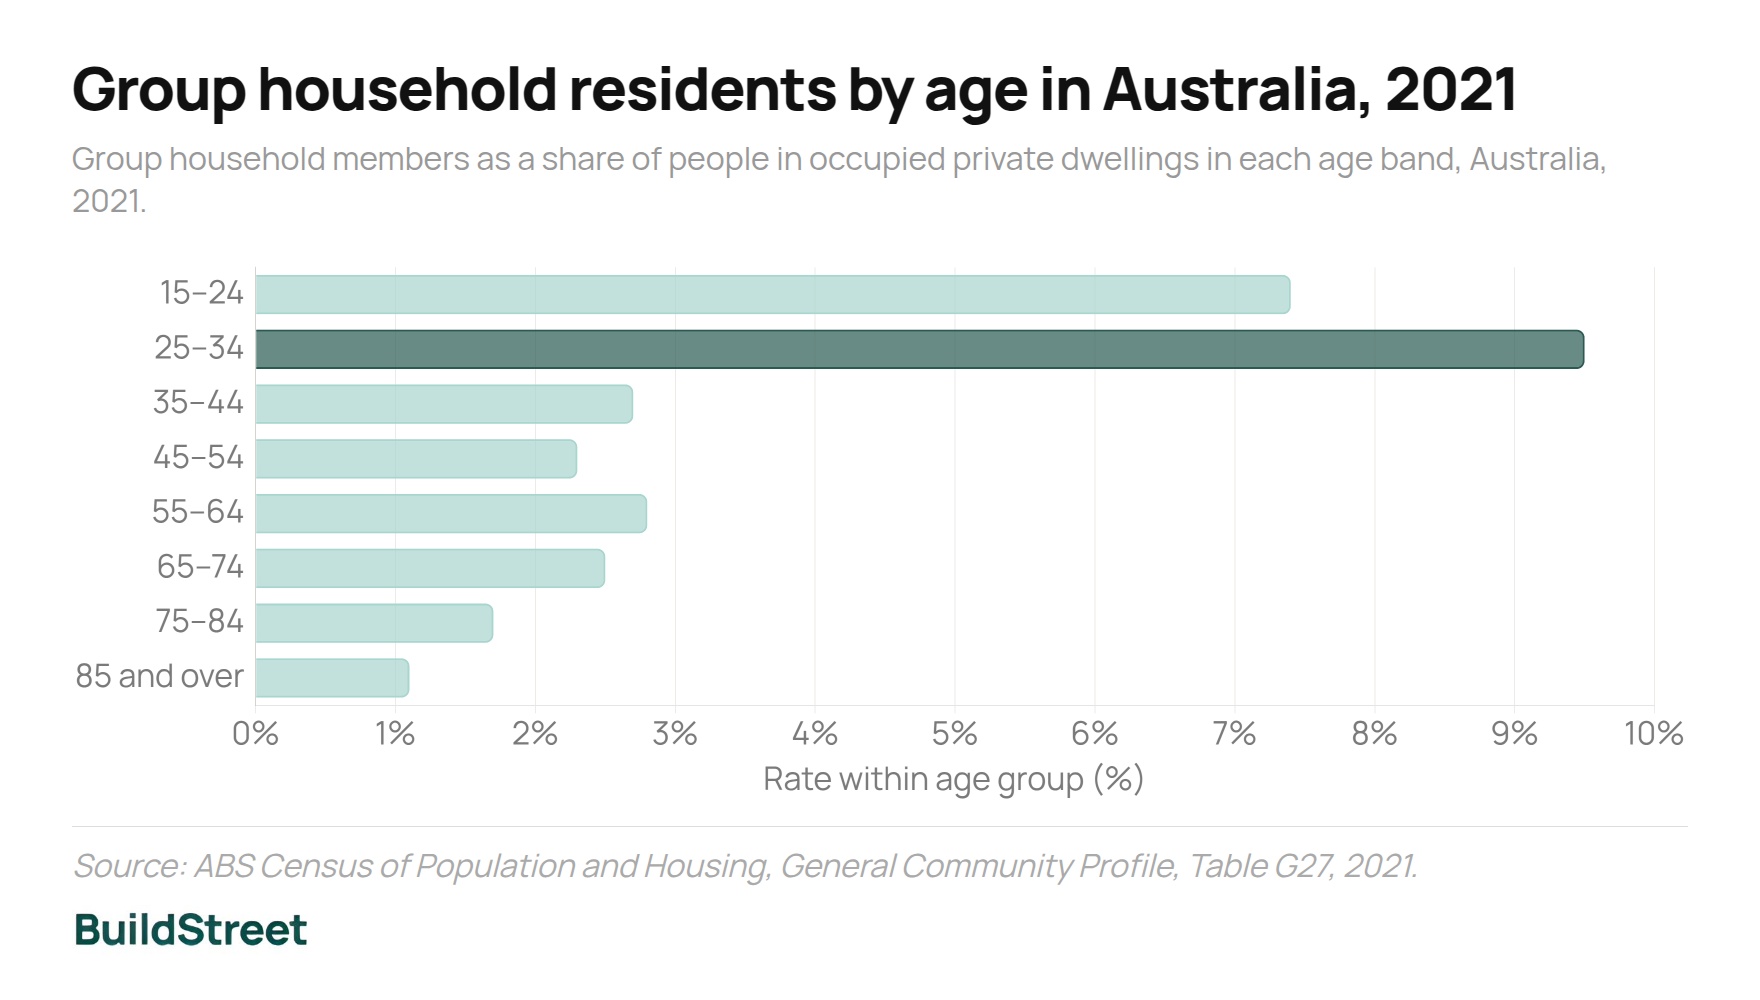
People aged 25 to 34 had both the largest number and the highest rate of group-household membership in 2021. A total of 318,009 people in that age band were group household members, equal to 9.5% of people aged 25 to 34 living in occupied private dwellings.
People aged 15 to 24 had the second-highest rate, at 7.4%. Together, people aged 15 to 34 accounted for 62.0% of group-household members, despite representing only about 26% of people in occupied private dwellings.
Group household residents by age in Australia, 2021
Group household members as a share of people in occupied private dwellings in each age band.
15–24
Source: ABS Census 2021, General Community Profile, Table G27.
| Age group | Residents, 2021 | Rate within group | Share of all |
|---|---|---|---|
| 15–24 | 208,052 | 7.4% | 24.5% |
| 25–34 | 318,009 | 9.5% | 37.5% |
| 35–44 | 88,732 | 2.7% | 10.5% |
| 45–54 | 70,926 | 2.3% | 8.4% |
| 55–64 | 79,331 | 2.8% | 9.4% |
| 65–74 | 57,200 | 2.5% | 6.7% |
| 75–84 | 21,374 | 1.7% | 2.5% |
| 85 and over | 4,528 | 1.1% | 0.5% |
| Total | 848,162 | 3.6% | 100% |
SECTION 04 · CAPITAL CITIES AND SA2 AREAS
Where are group households most common in Australia?
Greater Darwin had the highest group-household rate of any capital city in 2021, at 5.6% of classified occupied private households, followed by Greater Brisbane and the ACT, both at 4.7%. Greater Perth had the lowest rate among the capitals, at 3.5%.
In every state or territory with a separately defined rest-of-state area, the capital-city rate was higher than the rate outside the capital.
Group households as a share of classified households, by capital city, 2021
Greater Capital City Statistical Areas.
Source: ABS Census 2021, QuickStats, household composition.
Group households as a share of classified households, by state and territory, 2021
Source: ABS Census 2021, QuickStats, household composition.
| State / territory | Households 2021 | Rate 2021 | Rate 2016 |
|---|---|---|---|
| Northern Territory | 3,605 | 5.1% | 5.3% |
| ACT | 7,850 | 4.7% | 4.9% |
| Queensland | 80,576 | 4.3% | 4.7% |
| Victoria | 94,559 | 4% | 4.5% |
| New South Wales | 111,646 | 3.8% | 4.2% |
| South Australia | 23,542 | 3.4% | 3.6% |
| Western Australia | 32,591 | 3.4% | 3.8% |
| Tasmania | 7,429 | 3.4% | 3.3% |
How do capital cities compare with rest-of-state?
The gap between capital-city and rest-of-state group-household rates is widest in the Northern Territory, at 1.5 percentage points. Every jurisdiction with a separately defined rest-of-state area recorded a higher group-household rate in its capital city.
| State | Capital | Capital rate | Rest-of-state rate | Gap (pp) |
|---|---|---|---|---|
| Northern Territory | Greater Darwin | 5.6% | 4.1% | +1.5 |
| Tasmania | Greater Hobart | 4.2% | 2.8% | +1.4 |
| Victoria | Greater Melbourne | 4.3% | 2.9% | +1.4 |
| South Australia | Greater Adelaide | 3.7% | 2.4% | +1.3 |
| New South Wales | Greater Sydney | 4.2% | 3.3% | +0.9 |
| Western Australia | Greater Perth | 3.5% | 2.8% | +0.8 |
| Queensland | Greater Brisbane | 4.7% | 4% | +0.7 |
Which SA2 areas have the highest group-household rates?
Melbourne CBD – North had the highest group-household rate of any SA2 area with at least 3,000 residents in 2021, at 26.2%, followed by Clayton (North) – Notting Hill at 24.5% and Sydney's Haymarket at 24.4%.
Highest group-household rates by SA2 area, 2021
Top 15 SA2 areas by group-household members as a share of people in occupied private dwellings, limited to areas with at least 3,000 usual residents.
Source: ABS 2021 General Community Profile SA2 DataPack, Tables G01 and G27.
Group households are more common among First Nations households
Nationally, 5.4% of households with an Aboriginal and/or Torres Strait Islander resident were classified as group households in 2021, compared with 3.8% of households without one. Under the ABS definition, a group household contains only unrelated people; a household built around extended family or kinship ties is classified as a family household instead.
SECTION 05 · RENTAL AFFORDABILITY
How has rental affordability changed since the 2021 Census?
The share of gross annual household income a median-income household needed to pay for rent on a new lease increased from 31.3% in the December quarter of 2023 to 32.9% in the December quarter of 2024, reaching a record 33.1% in the December quarter of 2025.
Rental stress among lower-income renter households also increased from 47% in 2020 to 54% in 2023, measured using the 30/40 rule.
2020
2023
21%
Severe rental stress among lower-income renters reached 21% in 2023
Up from 17% in 2020. The share of people in rental stress who remained there for two or more consecutive years rose from 48% in 2022 to 60% in 2023.
SECTION 06 · OLDER RESIDENTS
How group-household living has increased among older Australians
The number of residents aged 55 and over living in a group household rose from 105,606 in 2011 to 162,433 in 2021, an increase of 53.8%. Among people aged 65 and over specifically, the number rose from 48,009 to 83,102, an increase of 73.1%.
Group household rate among older residents, 2011 vs 2021
Group household members as a share of people in occupied private dwellings, by age group.
Source: ABS Census, Tables B23 (2011) and G27 (2021).
| Age group | 2011 residents | 2021 residents | Change | 2011 rate | 2021 rate |
|---|---|---|---|---|---|
| 55–64 | 57,597 | 79,331 | +37.7% | 2.5% | 2.84% |
| 65–74 | 31,356 | 57,200 | +82.4% | 2.11% | 2.52% |
| 75–84 | 13,342 | 21,374 | +60.2% | 1.54% | 1.72% |
| 85 and over | 3,311 | 4,528 | +36.8% | 1.18% | 1.14% |
23%
Almost one in four group-household residents were aged 50 or over in 2021
Up from 16% in 2001. The ABS separately reports that average group-household size rose from 2.0 people in 2001 to 2.3 in 2021.
Data notes
About the data
Figures may differ slightly because of ABS random adjustment, different counting methods, geographic definitions and reference periods. The person and household counts use different Census counting methods (usual address vs Census night) and cannot be directly divided. The 2021 Census remains the latest benchmark until 2026 Census results are released from June 2027.
General information only
This article uses publicly available government data, primarily from the ABS Census of Population and Housing. It does not constitute financial, planning or investment advice.
References
Chart Snapshots