How home approvals compare in New Zealand and Australia
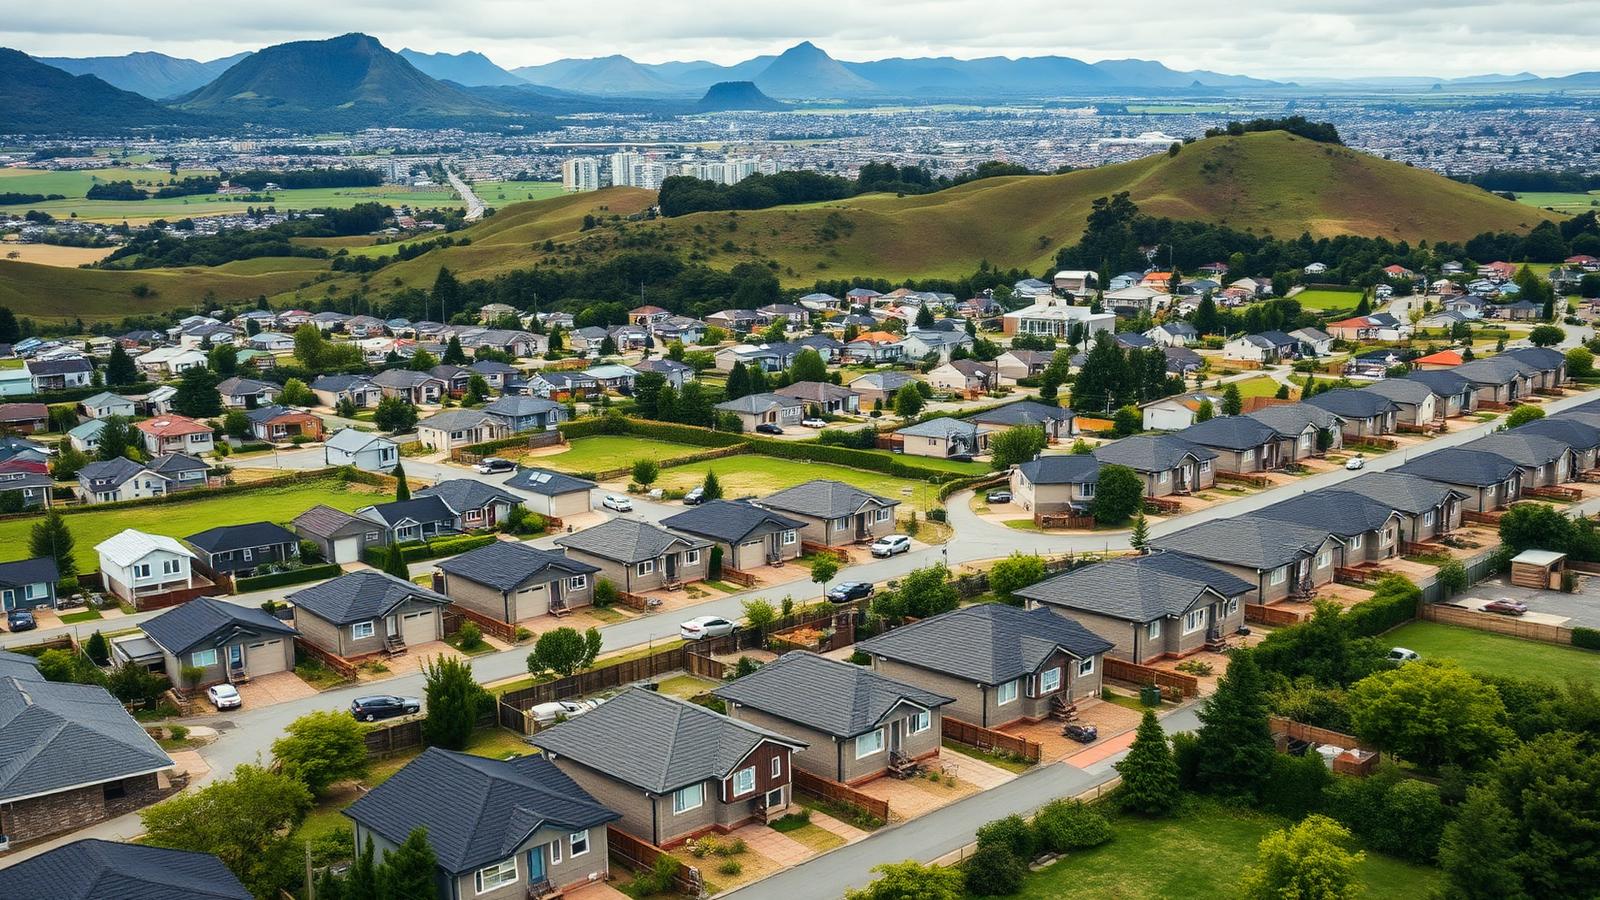
New Zealand approved more new homes per person than Australia from 2020 to 2024. Its widest lead came in the year ended January 2023, when New Zealand consented 9.7 dwellings per 1,000 residents, compared with Australia's calculated rate of 7.27.
The countries were approximately level in 2025. Australia then moved marginally ahead in 2026, at 6.99 approvals per 1,000 residents against New Zealand's provisional 6.9.
Auckland offers one explanation for part of New Zealand's growth: about 75% of its residential land was upzoned, and a 2025 working paper estimates that permits per person roughly doubled within five years.
Widest NZ lead
2.43
Per 1,000, 2023
Estimated extra permits
52,200
Auckland, 2017–2023
Auckland completions
95,300
2018–2024 total
Building approvals statistics in Australia
Monthly approvals by dwelling type, state and capital city.
Read full article →International home building rates
How Australia's completion rate compares with other countries.
Read full article →SECTION 01 · NATIONAL RATES
New Zealand and Australia home approval rates compared
New Zealand's consent rate first overtook Australia's calculated approval rate in 2020, at 7.5 against 6.89 dwellings per 1,000 residents. Australia had recorded the higher rate in every year from 2002 to 2019.
The measures are closely aligned but not identical. Stats NZ divides dwelling consents by estimated resident population; Australia's rate is calculated from original monthly approvals and the prior-December population. Small differences should not be treated as substantial leads.
About the 2025 comparison
New dwellings consented or approved per 1,000 residents, 2002 to 2026
Years ended January. New Zealand values are published consent rates; Australian values are calculated approval rates.
- New Zealand consents
- Australia approvals
Source: Stats NZ, Building consents issued: January 2026; ABS Building Approvals and population estimates.
Selected national approval rates
| Year | New Zealand | Australia | Difference | Higher rate |
|---|---|---|---|---|
| 2012 | 3.2 | 6.76 | −3.56 | Australia |
| 2016 | 5.8 | 9.94 | −4.14 | Australia |
| 2019 | 6.8 | 8.24 | −1.44 | Australia |
| 2020 | 7.5 | 6.89 | +0.61 | New Zealand |
| 2023 | 9.7 | 7.27 | +2.43 | New Zealand |
| 2024 | 7.0 | 6.14 | +0.86 | New Zealand |
| 2025 | 6.4 P | 6.45 | −0.05 | Approximately equal |
| 2026 | 6.9 P | 6.99 | −0.09 | Australia, marginally |
Australia's selected-year lead was widest in 2016 at 4.14 per 1,000. New Zealand's widest lead was 2.43 in 2023, showing separate national cycles rather than sustained divergence.
SECTION 02 · RECENT MOVEMENT
New Zealand's consent rate fell as Australia recovered
New Zealand's rate fell from 9.7 in 2023 to 6.4 in 2025, a 34.0% peak-to-trough fall, before recovering to 6.9 in 2026. Auckland fell 36.4% from 12.1 to 7.7 over the same peak-to-trough period.
New Zealand
−34.0%
2023 peak to 2025 trough
Auckland
−36.4%
2023 peak to 2025 trough
Australia
−38.2%
2016 peak to 2024 trough
New dwellings consented per 1,000 residents in Auckland, 2002 to 2026
Years ended January; 2024 to 2026 are provisional. The marker indicates timing, not causation.
Source: Stats NZ, Building consents issued: January 2026, Auckland region series BLDA.S20201.
Auckland's 2026 reading of 8.7 remained above its national rate and every Auckland reading between 2006 and 2018. The decline started before later planning changes, alongside rising interest rates and recession.
SECTION 03 · AUCKLAND PIPELINE
Auckland dwelling permits, construction starts and completions
How the Auckland Unitary Plan changed residential zoning
About 75% of Auckland's residential land was upzoned to medium or high density when the Auckland Unitary Plan took effect in November 2016. Before reform, 95% was zoned for low-density housing.
Before reform
95%
Residential land zoned low density
Under the plan
75%
Residential land upzoned
The reform covered most of the residential market rather than selected sites. Density varied with long-term growth plans, infrastructure capacity and transport access.
Auckland issued about 9,200 dwelling permits in 2015 and 21,000 by 2022. Per capita, the rate rose 111.3%. A synthetic-control study estimates that upzoning roughly doubled permits per person within five years.
Estimated reform effect
Code Compliance Certificates issued for new homes in Auckland, 2018 to 2024
Auckland Council's completion measure. Values transcribed from Figure 4 and total 95,300.
Source: Auckland Council Chief Economist Unit, Tracking Auckland's housing pipeline, June 2025.
Auckland recorded 95,300 Code Compliance Certificates from 2018 to 2024. Annual completions rose from 10,200 to 18,100 in 2023, then eased to 17,200. These completion years do not match the permit cohorts directly.
Share of consented projects that had started construction
| Year consented | Within 30 days | Within 180 days | Within 1 year | Within 2 years |
|---|---|---|---|---|
| 2018 | 28 | 74 | 86 | 90 |
| 2019 | 31 | 71 | 85 | 91 |
| 2020 | 25 | 73 | 85 | 88 |
| 2021 | 21 | 68 | 80 | 84 |
| 2022 | 16 | 54 | 70 | 79 |
| 2023* | 17 | 50 | 62 | 68 |
The 2023 cohort had an incomplete observation window. Among comparable cohorts, the two-year start rate fell from 90% in 2018 to 79% in 2022, while typical completion time increased from about 280 days in 2019 to 470 days in 2023. This points to slower delivery rather than simple project abandonment.
SECTION 04 · AUCKLAND HOUSING COSTS
What happened to Auckland rents after upzoning?
A 2024 University of Auckland paper estimates that Auckland rents in 2022 were 21.6% below a modelled no-reform level. The preferred specification excludes Rotorua; including it produces a larger 26.1% estimate.
What the estimate means
Preferred rent estimate
−21.6%
Against modelled counterfactual
2026 update cited
−23%
Productivity Commission
Site redevelopment premium
+22.2%
Vacant-land equivalent
The rent and land-value findings use different methods and outcomes. They cannot be added or used as estimates of changes in observed house prices or completions.
SECTION 05 · PLANNING FRAMEWORKS
Medium-density housing rules in New Zealand and Australia
New Zealand's 2022 Medium Density Residential Standards permitted up to three homes and three storeys per site without resource consent where standards were met. The baseline allowed 11 metres plus one metre for a pitched roof and 50% site coverage.
National planning frameworks compared
| Feature | New Zealand MDRS | Australian Blueprint |
|---|---|---|
| Instrument | National statute | National Cabinet agreement |
| Density standard | 3 units and 3 storeys | No uniform standard |
| Implementation | Tier 1 councils | States and territories |
| Direction | Compliant development | Well-located density |
Auckland's mix shifted heavily toward attached housing. Multi-unit consents rose from 4,038 in 2016 to 16,444 in 2023, while standalone houses fell from 5,229 to 4,719.
New dwellings consented in Auckland, by dwelling type, 2016 to 2026
Multi-unit homes include apartments, retirement village units, townhouses, flats and units.
- Standalone houses
- Multi-unit homes
Source: Stats NZ, Building consents issued: January 2026, Table 4, Auckland region.
Current at 6 August 2026
SECTION 06 · AUSTRALIAN APPLICATION
Australian application
The Australian Productivity Commission's July 2026 interim report proposes allowing developments up to three storeys across residential land, with benefit-cost-tested exceptions for environmental protection, hazards and heritage.
It finds broad upzoning is more likely to produce a larger supply response than reform limited to selected sites, but Auckland's effect size cannot be transferred directly. Lot sizes, redevelopment economics, infrastructure, hazards and market conditions differ.
What may transfer—and what requires local analysis
| Potentially portable design choices | Requires local evidence |
|---|---|
| Metropolitan-scale upzoning | Effect size |
| Low-rise attached forms | Lot sizes and feasibility |
| Predictable permitted-activity rules | Infrastructure capacity |
| Separate pipeline measurement | Hazard and heritage constraints |
No Australian supply estimate is included because the cited sources do not quantify the effect of applying Auckland-style reform to an Australian city. City-specific Commission analysis is expected in March 2027.
References
- Stats NZ — Building consents issued: January 2026
- Australian Bureau of Statistics — Building Approvals, Australia
- Australian Bureau of Statistics — National, state and territory population
- Auckland Council — Tracking Auckland's housing pipeline
- Auckland Council — Zoning reform in Auckland
- University of Auckland — Working Paper 017
- University of Auckland — Working Paper 016
- Australian Productivity Commission — Housing supply regulation
- NZ Ministry for the Environment — Medium Density Residential Standards
- Australian Treasury — National Planning Reform Blueprint