How Australia's home building rate compares to other countries
Australia completed 6.27 dwellings per 1,000 people in 2025, the lowest rate in 26 years and the seventh consecutive annual decline. That is 173,228 new homes for a population of 27.6 million.
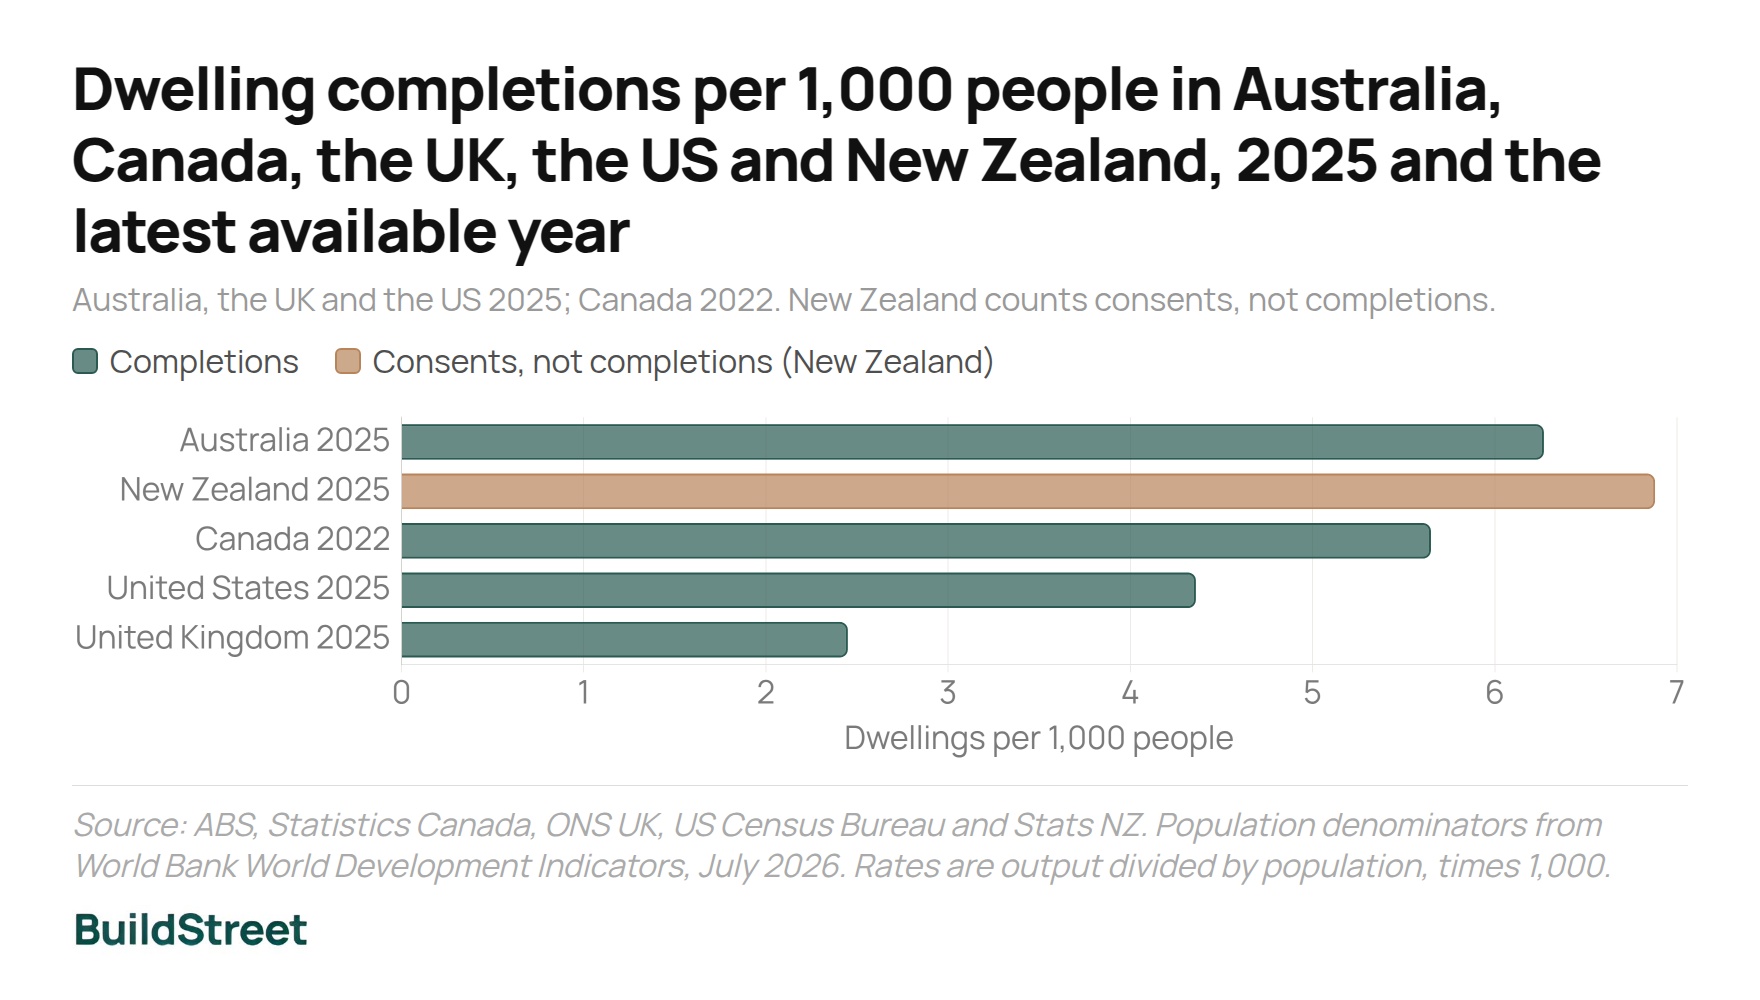
Canada completed 5.65 per 1,000 people in 2022, while the United States completed 4.36 and the United Kingdom completed 2.45 in 2025. Australia still builds more homes for the size of its population than any of the three.
Australia, 2025
6.27
Completions per 1,000
Dwellings completed
173,228
Calendar 2025
Change since 2000
−26.5%
Per-capita rate
Housing stock, 2022
420
Per 1,000 inhabitants
Australia's national housing target
How completions are tracking against the national commitment.
Read full article →How long it takes to build a house
Typical build times and where completion delays emerge.
Read full article →SECTION 01 · AUSTRALIAN RATE
How many homes does Australia build per 1,000 people?
Australia's rate was down 4.9% from 2024 and 26.5% below the 8.53 recorded in 2000. Dwelling output rose 6.7% across that period, but population growth was much faster.
How home building is measured
| Country | Measure | Scope and limits |
|---|---|---|
| Australia | Dwelling units completed | All sectors and building types |
| Canada | Dwelling units completed | National annual series ends in 2022 |
| United Kingdom | Permanent dwellings completed | 2020–2022 unavailable; 2025 provisional |
| United States | Housing units completed | Privately owned units only |
| New Zealand | New dwellings consented | Approval proxy, not completions |
About the comparison
Definitions, geographic scope and reference years differ. New Zealand's consent count is shown as a labelled proxy and not treated as a completion measure.
SECTION 02 · COUNTRY COMPARISON
How Australia's home building rate compares with Canada, the UK, the US and New Zealand
Australia's latest rate was 11% higher than Canada's, 44% higher than the United States' and about 156% higher than the United Kingdom's. New Zealand recorded 6.88 consents per 1,000, but that is not a like-for-like measure.
Dwelling completions per 1,000 people, latest available year
Australia, UK and US 2025; Canada 2022. New Zealand counts consents, not completions.
Source: ABS, Statistics Canada, ONS, US Census Bureau and Stats NZ; population from World Bank WDI, July 2026 vintage.
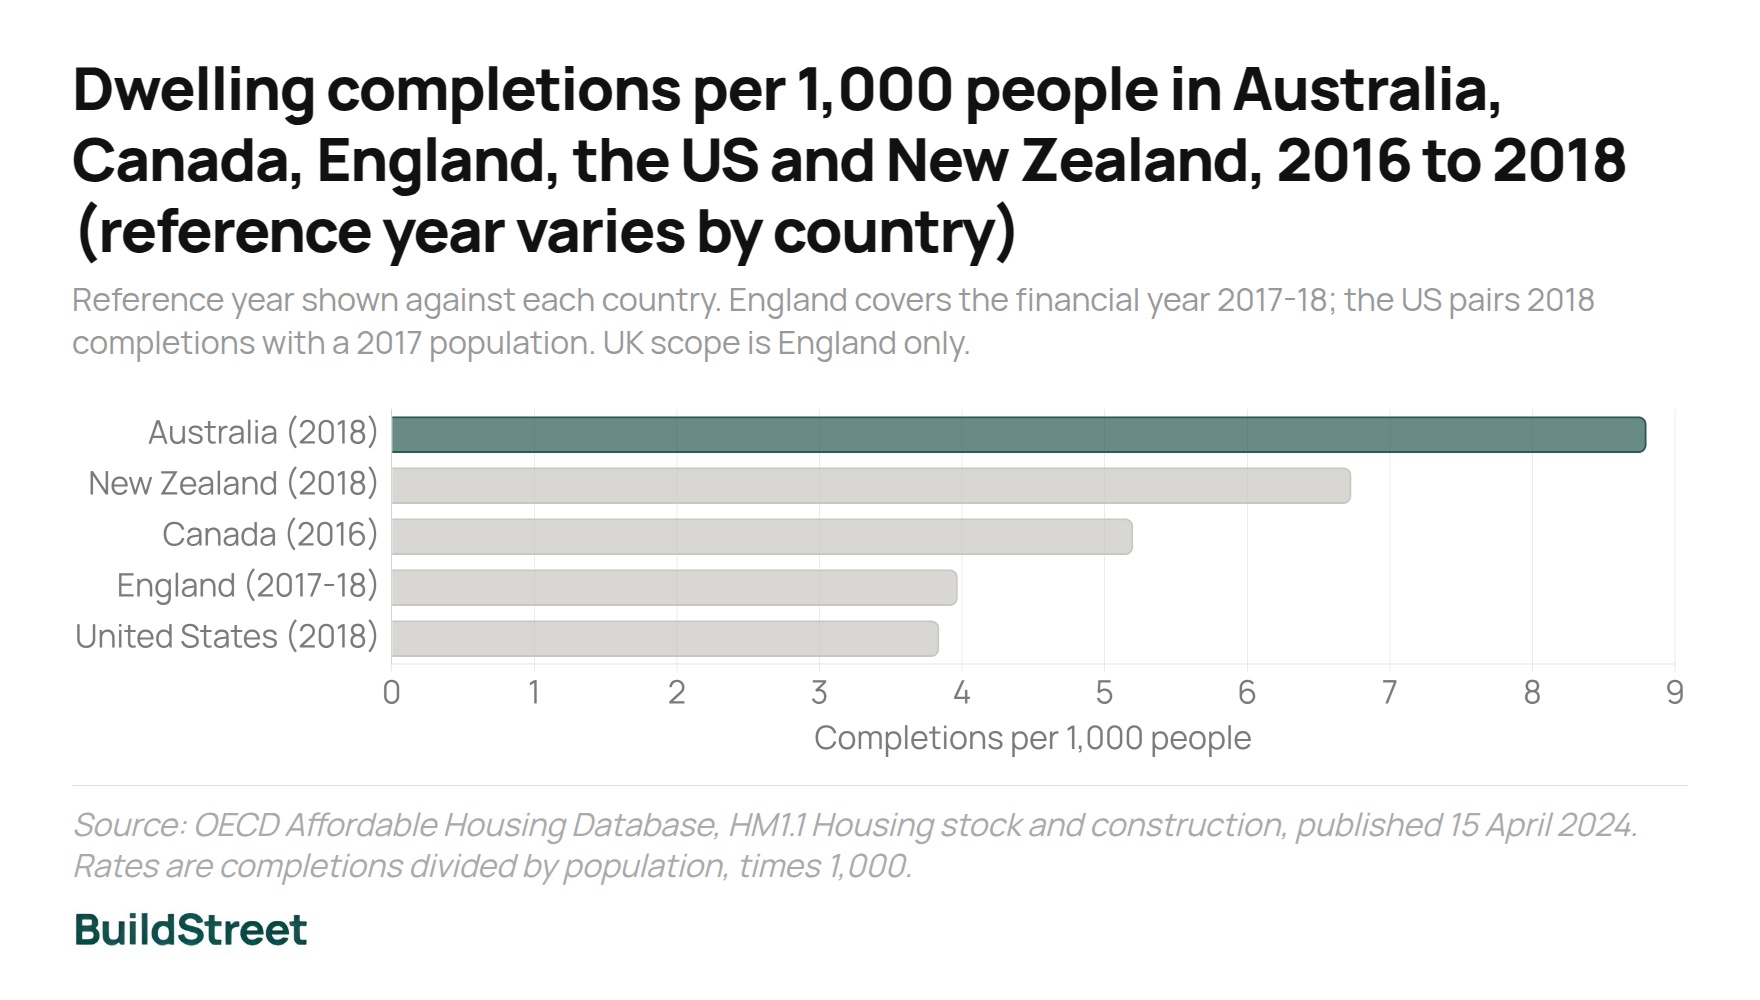
Dwelling completions per 1,000 people, 2016 to 2018
Historical OECD comparison; reference year varies and UK scope is England only.
Source: OECD Affordable Housing Database HM1.1, published 15 April 2024. Reference years vary by country.
Why two comparisons are used
The current comparison uses separate national series and mixed years. The OECD snapshot is older but uses completions for all five countries. Neither is fully harmonised.
SECTION 03 · OECD RANKING
How Australia ranks among OECD countries for home building
Australia ranked sixth of 32 OECD members with available data, completing homes equal to 1.58% of its existing housing stock in 2022. That was 0.54 percentage points above the 1.04% median.
Completions as a share of housing stock: top 15 OECD countries
Australia highlighted. The line marks the 1.04% median across 32 members with data.
Source: OECD Affordable Housing Database HM1.1, published 15 April 2024. Reference years vary by country.
Australia's share fell from 1.71% around 2011 to 1.58% in the latest observation, moving from second to sixth. Mixed reference years mean this is a direction-of-travel comparison.
Completions as a percentage of housing stock: then and latest
Reference years differ by country and period; this indicates direction rather than fixed-period change.
- Around 2011
- 2016–2022
Source: OECD Affordable Housing Database HM1.1, published 15 April 2024. Reference years vary by country.
SECTION 04 · PER-CAPITA VS TOTALS
How per-capita building rates differ from total dwelling numbers
Australia and the UK completed almost the same number of homes in 2025—173,228 and 170,390—but the UK population was 2.52 times larger. Their per-capita rates were therefore 6.27 and 2.45.
Australia
173,228
6.27 per 1,000
United Kingdom
170,390
2.45 per 1,000
United States
1,488,500
4.36 per 1,000
Does a higher building rate mean more homes per person?
No. Annual completions measure one year's output; housing stock counts everything already standing. Australia ranked fourth of these five countries for existing dwellings per person.
Existing dwellings per 1,000 inhabitants
Housing stock at a point in time, not annual output. Reference year varies; UK scope is England only.
Source: OECD Affordable Housing Database HM1.1, published 15 April 2024. Reference years vary by country.
SECTION 05 · POPULATION GROWTH
How home building rates compare with population growth across countries
Australia had both the highest average completion rate among the four completion countries and the highest average population growth. The countries appear in the same order on both measures, which is a pattern rather than proof of causation.
Average housing output rate and population growth, 2000 to 2025
Canada ends in 2022; UK output excludes 2020–2022; New Zealand counts consents.
- Output per 1,000
- Population growth %
Source: ABS, Statistics Canada, ONS, US Census Bureau and Stats NZ; population from World Bank WDI, July 2026 vintage.
Average output and population growth
| Country | Output per 1,000 | Population growth | Period |
|---|---|---|---|
| Australia | 7.41 | 1.50% | 2000–2025 |
| New Zealand | 6.16 consents | 1.30% | 2000–2025 |
| Canada | 5.61 | 1.09% | 2000–2022 |
| United States | 4.13 | 0.77% | 2000–2025 |
| United Kingdom | 2.83 | 0.66% | Output excludes 2020–2022 |
SECTION 06 · TREND SINCE 2000
How has Australia's building rate changed since 2000?
Australia's rate fell from 8.53 per 1,000 people in 2000 to 6.27 in 2025, the steepest fall of the four completion countries. It nevertheless recorded the highest completion rate whenever comparable observations were available.
Dwelling completions per 1,000 people, 2000 to 2025
Canada ends in 2022; UK data are absent for 2020–2022; New Zealand counts consents.
- Australia
- New Zealand
- Canada
- United States
- United Kingdom
Source: ABS, Statistics Canada, ONS, US Census Bureau and Stats NZ; population from World Bank WDI, July 2026 vintage.
The Australian rate peaked at 8.83 in 2016, then fell in eight of the next nine years. The United States' rate was 21.9% below its 2000 level and the UK's about 18.3% lower, while Canada's rose 18.8% by 2022.
What completion rates do not measure
Completions per 1,000 people measure housing output, not affordability. They do not account for household formation, vacancy, second homes, dwelling type, quality, location, tenure or demolitions.
References
- Australian Bureau of Statistics — Building Activity, Australia
- Office for National Statistics — UK house building
- US Census Bureau — New residential construction
- Statistics Canada — housing completions
- Stats NZ — Building consents issued
- OECD Affordable Housing Database
- World Bank — Population, total
Chart Snapshots