Australia's 1.2 million homes target: progress, funding, and who is responsible
Australia is behind the straight-line pace needed to build 1.2 million new homes by June 2029. The target requires an average of 60,000 completions per quarter over five years. Over the first six quarters of the Accord period, 262,592 homes were completed nationally, leaving Australia about 97,400 completions below the straight-line pace needed to meet the target. Progress is uneven across states, and no single level of government controls delivery.
National target
1.2M
New homes by 30 June 2029
Required pace
60,000
Completions needed per quarter
National share built (Sep 2025)
18%
Of the 1.2 million target, to September 2025
Expected national completion
Jun 2030
Model estimate; 12 months past the June 2029 deadline
Is Australia on track to build 1.2 million homes by June 2029?
Live quarterly tracker showing national and state-level progress against the Accord target, updated each ABS Building Activity release.
Read full article →How many homes are built in Australia each year?
Annual and quarterly dwelling completions data for Australia, with state breakdowns and historical trends from 2000 to the latest ABS release.
Read full article →Section 01 · The Accord
What is Australia's 1.2 million homes target?
Australia's 1.2 million homes target is a National Housing Accord commitment to build 1.2 million new well-located homes between 1 July 2024 and 30 June 2029. This requires an average of 60,000 completed dwellings per quarter.
The National Housing Accord was originally agreed in 2022 with an aspirational target of one million new homes over five years. National Cabinet updated that figure on 16 August 2023, raising it to 1.2 million new well-located homes from 1 July 2024 to 30 June 2029. The higher target followed stronger population growth and elevated net overseas migration from 2022.
At 1.2 million homes over 20 quarters, the required pace is 60,000 completions every quarter. Australia has not sustained that level of completions over the past five years. The best financial year on recent record was 191,881 completions in 2019–20, with a historical peak of approximately 219,000 in the year to September 2018.
The target was set against a period of worsening housing affordability as at 2025:
- The share of household income required to service a new mortgage remained elevated at 45.9%.
- The median time to save a 20% deposit reached 11.2 years.
The 1.2 million homes target counts gross completions, not net supply
The 1.2 million target counts gross dwelling completions only. It does not subtract demolished dwellings or other losses from the housing stock. Net housing supply is therefore a lower figure and should not be compared directly with the Accord target. NHSAC notes that the ABS quarterly dwelling completions series is the official tracking measure.
Who signed the National Housing Accord?
The Accord was signed by 25 parties across government, the superannuation sector, institutional investment, and the construction industry.
Government
- Commonwealth
- New South Wales
- Victoria
- Queensland
- South Australia
- Western Australia
- Tasmania
- Northern Territory
- Australian Capital Territory
- Australian Local Government Association
Superannuation & investment
- AustralianSuper
- Australian Retirement Trust
- HESTA Super Fund
- Aware Super
- Cbus Super
- Colonial First State
- UniSuper
- RestSuper
- Insignia
- TelstraSuper
- BlackRock
- IFM Investors
Industry
- Master Builders Australia
- Housing Industry Association
- Property Council of Australia
Key Commonwealth commitments
- $3.5B Housing Support Programme
- $3B New Home Bonus
- $2B Social Housing Accelerator
- $350M for 10,000 affordable homes
- Concessional loans via Housing Australia
Section 02 · Target allocation
How NHSAC tracks the homes target across states
Western Australia is the only large state where NHSAC's estimated Accord-period supply matches its population-implied share of the target. NSW has the largest projected shortfall, with an estimated 118,000-home gap against an implied target of 376,000 homes. Nationally, NHSAC estimates 980,000 gross completions over the Accord period, leaving a projected gap of 220,000 against the 1.2 million target.
NHSAC apportioned the 1.2 million target using each jurisdiction's share of national population as at December 2022, the latest figures available when the updated target was agreed.
These figures are not formal state and territory quotas. They are NHSAC benchmarking shares used to compare expected supply with each jurisdiction's population share.
| State or territory | Pop. share | Target (homes) | Prior 5-yr supply | Est. Accord supply | Ratio to target |
|---|---|---|---|---|---|
| New South Wales | 31.4% | 376,000 | 251,000 | 258,000 | 69% |
| Victoria | 25.5% | 306,000 | 306,000 | 287,000 | 94% |
| Queensland | 20.5% | 246,000 | 166,000 | 204,000 | 83% |
| Western Australia | 10.8% | 129,000 | 75,000 | 129,000 | 100% |
| South Australia | 7.0% | 84,000 | 54,000 | 66,000 | 78% |
| Tasmania | 2.2% | 26,000 | 16,000 | 13,000 | 51% |
| Australian Capital Territory | 1.8% | 21,000 | 24,000 | 22,000 | 103% |
| Northern Territory | 1.0% | 11,000 | 3,000 | 4,000 | 34% |
Source: NHSAC, State of the Housing System 2026 (Table 4.1). Population shares are December 2022 ABS Estimated Resident Population. Estimated Accord period supply figures reflect NHSAC's early 2026 "no conflict" outlook. Target shares do not reflect formal agreement between the Australian Government and state and territory governments. All supply figures are rounded to the nearest thousand.
The ACT's estimated full-period supply sits above 100% of its implied target, reflecting its prior construction record and current approvals pipeline. That 103% figure refers to NHSAC's estimated supply over the full Accord period, not homes already completed: the ACT had built 23% of its implied share as at September 2025.
At the other end, the Northern Territory built only 3,000 homes in the five years before the Accord, yet its population-implied target of 11,000 is more than three times its recent pace. NSW carries the largest individual share at 376,000 homes, and its estimated Accord-period supply of 258,000 would leave a gap of 118,000 against its implied target, the largest absolute shortfall of any jurisdiction.
Section 03 · State progress
How each state and territory is tracking against the target
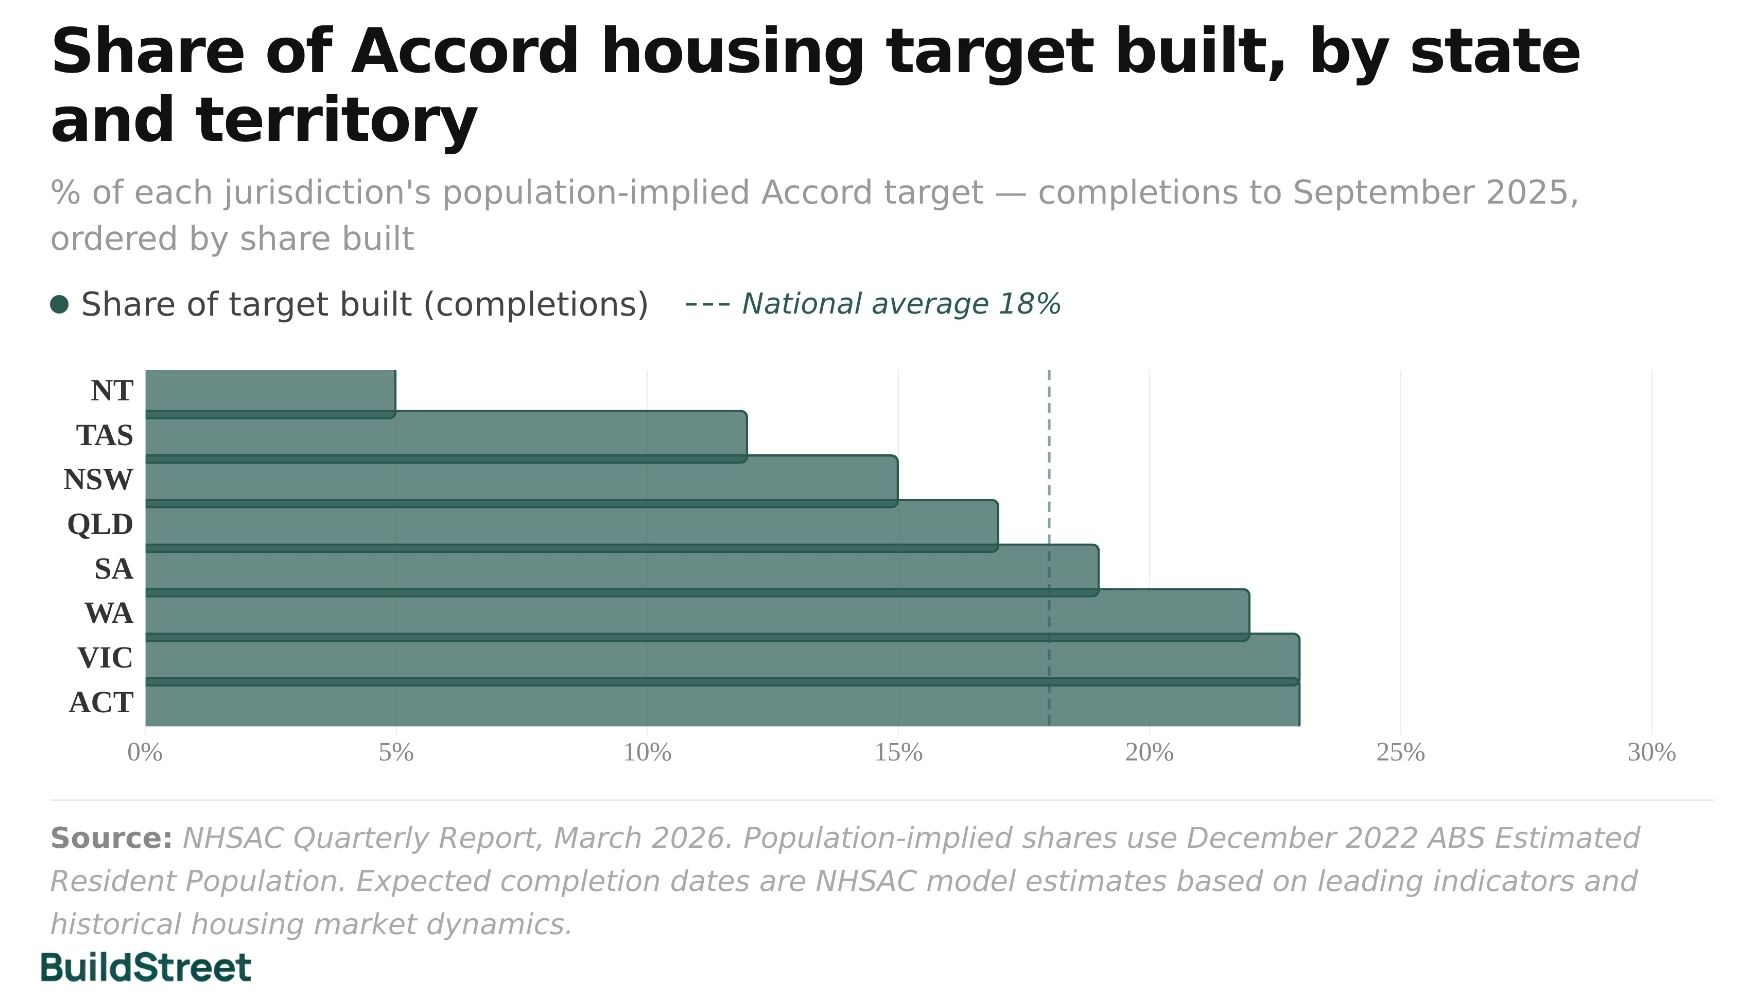
Nationally, 18% of the 1.2 million target had been built as at September 2025.
Approvals and commencements had each risen 17% since the Accord started. Victoria and the ACT each recorded 23% of their implied target shares built, the highest of any jurisdiction; the Northern Territory has completed just 5%.
Progress is measured across three indicators: approvals, commencements and completions. Completions are the only measure that directly counts toward the 1.2 million homes target. Approvals and commencements show future pipeline activity, but they do not represent finished homes.
National housing progress since the Accord started
Building approvals and commencements had both risen 17% since the start of the Accord. Over the first five Accord quarters, 219,000 homes had been completed. Construction costs were 0.9% lower in real terms, and new houses were being completed 10% faster than at the start of the Accord.
+17%
Quarterly approvals since Accord start
+17%
Quarterly commencements since Accord start
219K
Completions over first 5 Accord quarters
−0.9%
Real construction costs since Accord start
+10%
Faster house build times since Accord start
NHSAC Quarterly Report, March 2026. Approvals data to January 2026; completions to September 2025 quarter. Later ABS Building Activity data brings national completions to 262,592 over the first six Accord quarters.
Share of Accord housing target approved and built, by state and territory in Australia
% of each jurisdiction's population-implied Accord target; completions to September 2025, approvals to January 2026. States are ordered by share built; the approval view uses the same order for comparison.
Source: NHSAC Quarterly Report, March 2026. Approvals data are seasonally adjusted for states and in original terms for territories. The ACT's +117% approval surge partly reflects the impact of the Missing Middle Housing reforms. Expected completion dates are NHSAC model estimates reflecting expected future activity based on leading indicators and historical housing market dynamics.
Victoria had the highest share built among the three largest states, at 23%. Its estimated completion date was September 2029, three months after the national target deadline. Completions fell 12% in the rolling 12 months to September 2025, the steepest decline among the larger states. Its forecast remains closer to the target date than most jurisdictions because prior delivery was substantial. The state built 306,000 homes in the five years before the Accord, exactly matching its implied Accord target.
Western Australia had built 22% of its implied target share by September 2025, with approvals at 29%. Its estimated completion date was also September 2029. WA is the only large state where estimated full-period supply matches its implied target, at 100%.
New South Wales had built 15% of its implied target share by September 2025. Its estimated completion date was June 2031, two years after the target deadline. NSW also has the largest projected shortfall, with estimated Accord-period supply of 258,000 homes against an implied target of 376,000.
The Northern Territory had built 5% of its implied target share by September 2025, the lowest of any jurisdiction. Its estimated completion date was after 2034. The territory's implied target of 11,000 homes is more than three times the 3,000 homes built there in the five years before the Accord.
Expected Accord completion dates by state and territory
NHSAC model estimates as at March 2026. Target deadline: June 2029.
Victoria
Sep 2029
23% built · 28% approved
Western Australia
Sep 2029
22% built · 29% approved
ACT
Sep 2029
23% built · 25% approved
Queensland
Sep 2030
17% built · 26% approved
South Australia
Sep 2030
19% built · 27% approved
New South Wales
Jun 2031
15% built · 21% approved
Tasmania
Sep 2033
12% built · 15% approved
Northern Territory
After 2034
5% built · 9% approved
Teal: on or near trackAmber: 12–18 months past deadlineRed: 24+ months past deadline
Source: NHSAC Quarterly Report, March 2026. Expected completion dates are model estimates based on leading indicators and historical housing market dynamics. Australia national expected date: June 2030.
Section 04 · Pipeline
Why Australia is below the 1.2 million homes target pace
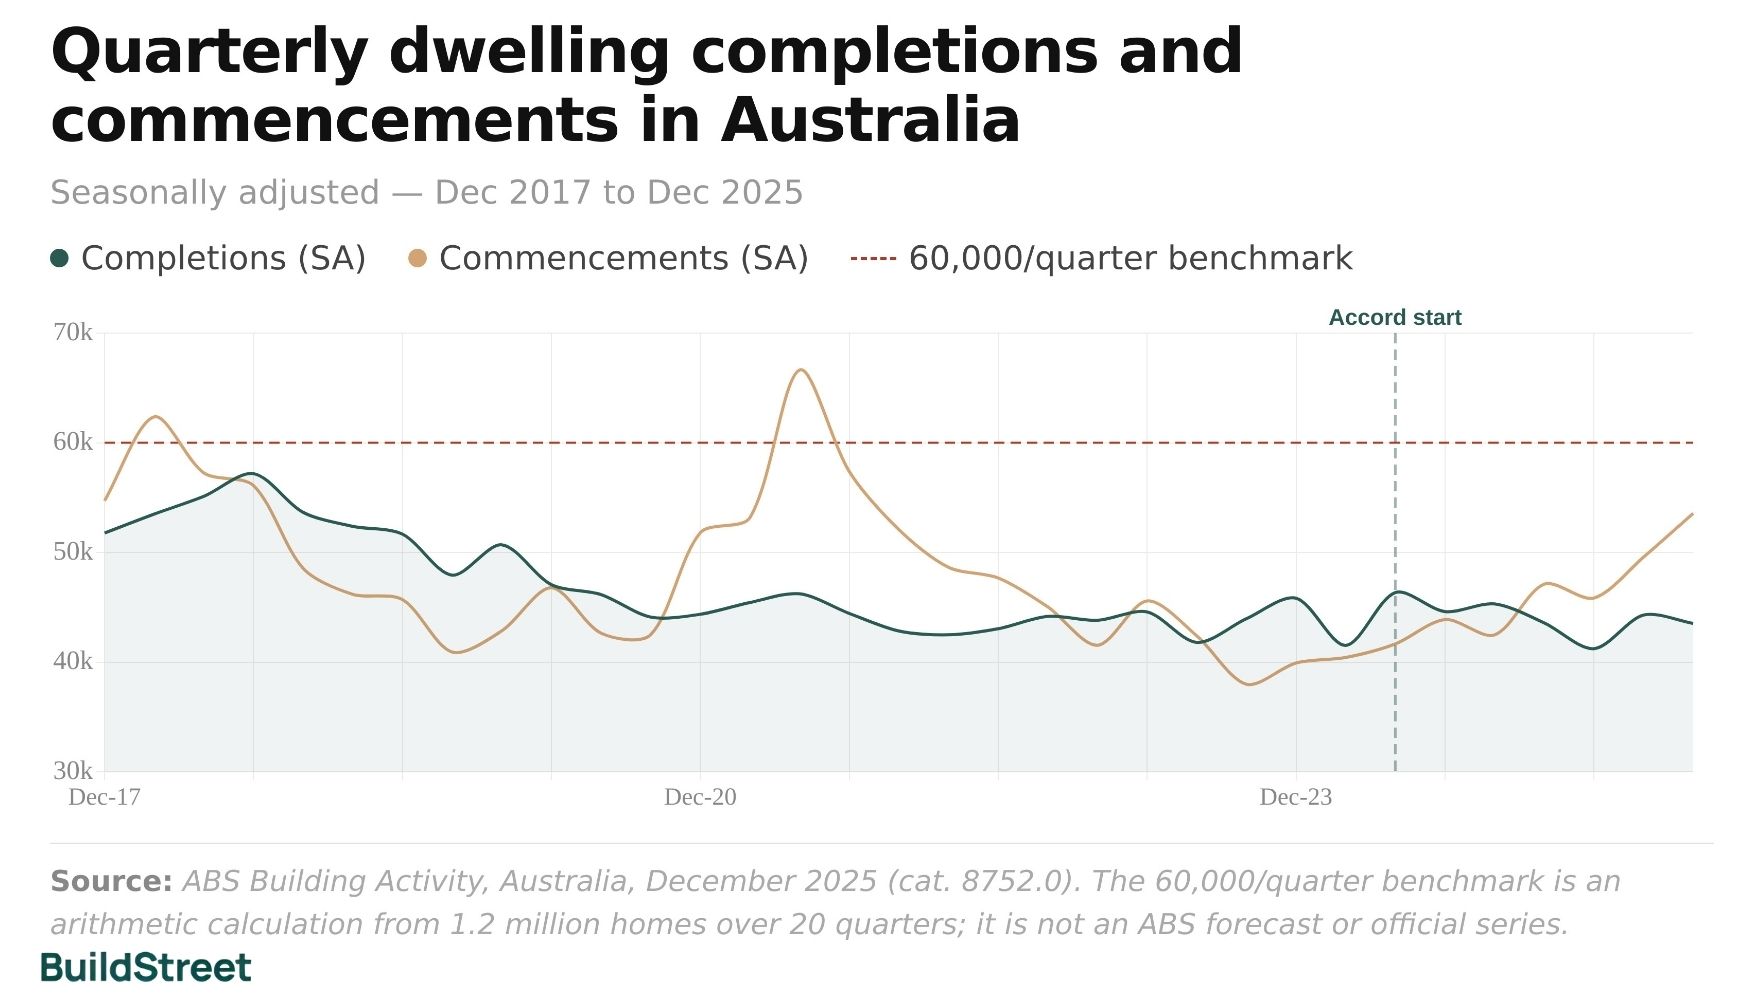
Australia completed 43,536 dwellings in the December 2025 quarter, about 16,500 fewer than the 60,000 completions needed each quarter to stay on a straight-line path to the 1.2 million homes target. Over the first six quarters of the Accord period, the cumulative shortfall was approximately 97,400 completed dwellings.
The construction pipeline is improving, but commencements have not yet translated into enough completed homes. In the December 2025 quarter, 53,567 dwellings commenced construction, up 8.0% from the September quarter and 26.1% above December 2024. There were also 236,858 dwellings under construction at the end of December 2025, including 88,630 new houses and 147,255 other residential dwellings.
Under-construction dwellings add to future supply once building is completed, but the timing varies by dwelling type. Detached houses usually move through the pipeline faster than apartments, which means a larger apartment pipeline can take longer to appear in completion figures.
Quarterly dwelling completions and commencements in Australia
Seasonally adjusted, Dec 2017 to Dec 2025
Source: ABS Building Activity, Australia, December 2025 (cat. 8752.0). The 60,000/quarter benchmark is an arithmetic calculation from 1.2 million homes over 20 quarters; it is not an ABS forecast or official series.
How long does it take to build a house or apartment in Australia?
House build times have improved from their recent peak, but they remain longer than before the pandemic. The average time to complete a new house peaked at 3.47 quarters in 2023–24 before easing to 3.07 quarters in 2024–25. That remains about 40% longer than the pre-COVID average of roughly 2.2 quarters.
Western Australia had the longest average house build time among the states in 2024–25, at 4.37 quarters. This was down from a peak of 5.19 quarters in 2023–24.
Apartment build times have continued to lengthen. The national average reached 9.58 quarters in 2024–25, up from 6.00 quarters in 2014–15. In NSW, the average apartment build time reached 10.61 quarters in 2024–25, equal to about 2.65 years from commencement to completion.
Based on current average apartment build times, an apartment commenced at the start of the Accord period in mid-2024 would generally not be expected to complete until late 2026 or early 2027. Longer apartment build times are one reason completions can lag approvals and commencements, particularly in states with large higher-density pipelines.
Average commencement-to-completion time by dwelling type in Australia
In quarters (1 quarter = 3 months), financial years 2014–15 to 2024–25. Apartment data covers NSW, VIC and QLD only; ABS does not publish this series for other states due to insufficient quarterly observations.
Source: ABS Building Activity, Australia (cat. 8752.0); ABS feature article, average commencement to completion times. Figures are the average time between commencement and practical completion for dwellings completing in that financial year.
Construction costs remain higher than before 2020
Material and labour costs rose after 2021 and remain elevated, adding pressure to project costs and delivery conditions.
Input costs to house construction
+34.9%
Index: 119.0 (2019–20) to 160.5 (2024–25). Growth has slowed: +1.4% in 2024–25, compared with annual growth above 12% in 2021–22 and 2022–23.
Private construction sector wages
+16.2%
Index: 132.3 (2019–20) to 153.7 (2024–25). Wage growth remains elevated at +3.4% in 2024–25.
Median estimated dwelling price
+50.8%
National median: $543,154 (2019–20) to $819,082 (2024–25). Capital cities: $626,730 to $901,898.
Source: NHSAC, State of the Housing System 2026 (Appendix E, Table E.1). Input costs index is ABS Producer Price Indexes, house construction. Wages index is ABS Wage Price Index, private sector construction. Dwelling prices are financial year average national estimated median sales values.
Downside scenarios for the 1.2 million homes target
NHSAC's early 2026 baseline estimated 980,000 gross new homes over the Accord period, with the 1.2 million target reached in the September quarter of 2030. Two downside scenarios showed that higher construction costs could reduce Accord-period completions by about 10,000 homes under a shorter shock, or about 33,000 homes under a more prolonged shock. These are modelled scenarios, not forecasts.
Section 05 · Responsibility
Who is responsible for delivering the 1.2 million homes target?
No single level of government is solely responsible for delivering the 1.2 million homes target. The Accord involves the Commonwealth, state and territory governments, local governments, institutional investors and the construction industry, but housing delivery depends on decisions across the full supply chain.
The public framework focuses on incentives, reporting and planning reform rather than an automatic penalty for missing the target. Accountability is tracked through performance-based funding, quarterly progress reporting and the National Planning Reform Blueprint.
| Actor | Role in housing delivery |
|---|---|
| Commonwealth Government | Sets national funding programmes, performance incentives and reporting frameworks. Coordinates national housing policy through National Cabinet. Provides payments to state, territory and local governments through the Housing Support Programme, New Home Bonus and Social Housing Accelerator. |
| State and territory governments | Control planning systems, zoning rules, land release pipelines and state infrastructure investment. Each has committed to an Accord implementation schedule and reports progress to National Cabinet twice yearly through the National Planning Reform Blueprint. |
| Local governments | Process development applications, manage local planning assessments and contribute to enabling infrastructure sequencing. The Housing Support Programme includes specific funding streams for local governments. |
| Private sector | Delivers most market housing and responds to pre-sale conditions, financing availability, labour supply, materials costs and planning certainty. Represented in the Accord through MBA, HIA and the Property Council of Australia. |
| NHSAC | Independent statutory body providing evidence-based advice, quarterly progress tracking, and annual housing system reporting. Established under the National Housing Supply and Affordability Council Act 2023. |
Source: Treasury, Delivering the National Housing Accord; NHSAC Quarterly Report, March 2026.
Key planning and supply reforms since the Accord started
States and territories have introduced planning, land release, infrastructure and housing supply reforms since July 2024. The reforms vary by jurisdiction, but most focus on faster assessment pathways, more medium-density housing, enabling infrastructure, land release and construction workforce capacity.
- Transport Oriented Development programme, Low and Mid-Rise Housing Policy, and infill affordable housing bonuses to boost density near public transport
- Pattern Book designs for low and mid-rise housing to reduce design costs and speed up approvals
- Development Coordination Authority to reduce red tape; Housing Delivery Authority for major project assessments
- New State Significant assessment pathways for housing and an accelerated rezoning process
- Pre-sale Finance Guarantee to unlock construction finance; Works-in-Kind guidelines to bring forward infrastructure delivery
- Council performance framework: Statement of Expectations, public league table and financial incentives for faster housing assessments
Source: NHSAC Quarterly Report, March 2026, overview of key supply initiatives since the start of the Accord.
What the housing target data can and cannot show
ABS and NHSAC data track whether homes are being approved, started and completed, and whether each jurisdiction is broadly aligned with its population-implied Accord share. The data cannot assign responsibility to one level of government or one part of the housing system. Housing delivery is affected by approvals, financing conditions, labour supply, materials availability, land release, enabling infrastructure and planning settings. These factors sit across different parts of the supply chain, which is why the target cannot be attributed to a single actor.
Section 06 · Funding
How Commonwealth funding supports housing delivery
The housing programmes covered in this section total a combined $8.85 billion. This includes Accord-linked funding and the $2 billion Social Housing Accelerator, which was delivered before the Accord period and is separate from the 1.2 million homes target.
The $3 billion New Home Bonus is the main Accord-linked performance incentive. It is designed to reward states and territories that exceed their population-implied share of the original one million homes target. As at March 2026, no New Home Bonus payments had been reported for any state or territory.
The $3.5 billion Housing Support Programme funds planning capability, enabling infrastructure and social housing delivery. This includes the $2 billion Local Infrastructure Fund, announced in the 2026–27 Budget to support local infrastructure that enables new housing supply.
The National Planning Reform Blueprint was agreed alongside the Accord and sets out planning, zoning and land release reforms. Planning ministers report progress to National Cabinet twice a year.
| Programme | Amount | Purpose |
|---|---|---|
| New Home Bonus | $3 billion | Performance-based payments to states and territories exceeding their share of the original one million homes target. No payments made as at March 2026. |
| Housing Support Programme: Stream 1 and Community Enabling Infrastructure | $500 million | Funding for state, territory and local governments to improve planning capability and deliver enabling infrastructure (2023–24 to 2024–25). |
| Housing Support Programme: Priority Works Stream | $1 billion | Funding for state and territory governments for significant enabling infrastructure and social housing delivery. Implementation plans jointly agreed with five states. |
| Housing Support Programme: Local Infrastructure Fund | $2 billion | New stream announced in the 2026–27 Budget to fund local infrastructure that enables new housing supply. Part of the $3.5 billion HSP total. |
| Affordable housing commitment | $350 million | Supports 10,000 affordable homes over five years from 2024–25 at a minimum 7-star energy rating. States and territories agreed to support up to an additional 10,000, enabling a combined 20,000 total. |
| Social Housing Accelerator | $2 billion | One-off payment delivered to states and territories in June 2023 to permanently increase social housing stock. Around 4,000 homes expected. Separate from the Accord target; covered in Section 07. |
Source: Treasury, Delivering the National Housing Accord; Treasury, Housing Support Programme; Treasury, National Planning Reform Blueprint.
Affordable home allocations under the Commonwealth's 10,000-home contribution:
- New South Wales: 3,100 homes
- Victoria: 2,546 homes
- Queensland: 2,049 homes
- Western Australia: 1,076 homes
- South Australia: 700 homes
- Tasmania: 220 homes
- ACT: 175 homes
- Northern Territory: 96 homes
These figures show each jurisdiction's published allocation under the Commonwealth's 10,000-home contribution. They do not include the additional homes states and territories agreed to support. The listed jurisdiction figures total 9,962 homes.
Section 07 · Accelerator
Social Housing Accelerator spending and delivery by state
The Social Housing Accelerator is not part of the 1.2 million homes Accord target. It is a separate $2 billion programme focused on social housing stock and was delivered before the Accord period. It is included here to show how Commonwealth housing funding is allocated to states and tracked through delivery reporting.
By 30 June 2025, 1,057 social housing dwellings had been completed nationally under the Social Housing Accelerator, with $617.6 million spent. NSW had the highest completion count at 580 dwellings, while South Australia had recorded zero completions at the reporting date.
Delivery is back-loaded. A further 1,666 dwellings had commenced but were not yet complete, and 1,528 had been committed but not yet commenced as at 30 June 2025.
Social Housing Accelerator: delivery pipeline in Australia by state, as at 30 June 2025
Social housing dwellings by delivery stage
Source: Treasury, Social Housing Accelerator Statements of Assurance, as at 30 June 2025. "Completed" = practical completion reached and site can be tenanted. "Commenced" = head contractor has site possession and material work underway. "Committed" = significant component formally contracted. South Australia reported zero completions at the reporting date. Victoria's allocated total is a range (692–769); ACT is 55–65.
| State or territory | Allocated ($m) | Spent ($m) | Spend rate | Completed | Commenced | Committed |
|---|---|---|---|---|---|---|
| New South Wales | $610.1m | $311.2m | 51% | 580 | 544 | 425 |
| Victoria | $496.5m | $116.2m | 23% | 146 | 488 | 163 |
| Queensland | $398.3m | $93.2m | 23% | 110 | 107 | 415 |
| Western Australia | $209.2m | $54.1m | 26% | 192 | 280 | 95 |
| South Australia | $135.8m | $12.6m | 9% | 0 | 140 | 301 |
| Tasmania | $50.0m | $4.7m | 9% | 8 | 78 | 42 |
| Northern Territory | $50.0m | $13.8m | 28% | 4 | 29 | 46 |
| Australian Capital Territory | $50.0m | $11.8m | 24% | 17 | 0 | 41 |
| Total | $2,000.0m | $617.6m | 31% | 1,057 | 1,666 | 1,528 |
Source: Treasury, Social Housing Accelerator Statements of Assurance, as at 30 June 2025. Totals may not sum exactly due to rounding. Tasmania's committed-but-not-spent ($55.5m) exceeds its allocation due to additional state contributions. Northern Territory is finalising scope for $2.2 million in remaining funds.
The Social Housing Accelerator also includes a dedicated First Nations housing component. Of 427 intended First Nations dwellings, 181 had been completed by 30 June 2025, with a further 111 commenced and 135 committed.
General information only. This article is based on publicly available data from NHSAC, the ABS and Australian Treasury. It is general information only and does not constitute financial, investment, housing policy or legal advice. Population-implied target shares and expected Accord completion dates are modelled estimates and may change as new data becomes available.
References
- Australian Treasury – Delivering the National Housing Accord
- National Housing Supply and Affordability Council – Quarterly Report, March 2026
- National Housing Supply and Affordability Council – State of the Housing System 2026
- Australian Bureau of Statistics – Building Activity, Australia, December 2025 (cat. 8752.0)
- Australian Treasury – Housing Support Programme
- Australian Treasury – Social Housing Accelerator, Statements of Assurance (as at 30 June 2025)
- Australian Treasury – National Planning Reform Blueprint
Chart Snapshots