Are Australian homes becoming harder to insure?
Insurance costs have risen sharply across Australia in recent years. Insurance CPI rose 16.2% in the year to December 2023, the fastest rise since March 2001, before easing through 2025.
The Australian Prudential Regulation Authority (APRA) estimated that 1.4 million Australian households, or 15% of the roughly 10 million freestanding houses modelled in its climate stress test, were effectively uninsured under its 2024 baseline. This means the modelled annual premium would cost four or more weeks of household income. Under APRA's scenarios, that share could reach 25–26%, or about 2.4 million households, by 2050.
The pressure is uneven. A federal reinsurance pool reduced average combined home premiums by 11% per $100,000 insured for medium-to-high cyclone-risk properties in northern Australia after insurers entered the pool. Meanwhile, average home and contents premiums in the rest of Australia rose 10% in 2024–25, the fastest increase among the four regions tracked. About 60% of the homes APRA estimated were effectively uninsured were in New South Wales and Queensland.
Effectively uninsured households, 2024
15%
APRA stress-test estimate for 2024
Modelled 2050 scenarios
25–26%
About 2.4 million households, both climate scenarios
Insurance CPI, year to Dec 2023
16.2%
Fastest annual rise since March 2001
Average premium, north WA, 2024–25
$4,966
Up 8% on the year before
Average premium rise, rest of Australia, 2024–25
+10%
The fastest rise of all four regions tracked
Average cyclone-pool reinsurance premiums, Dec 2025
$169 vs $2,312
Pool-wide home-building average vs Pilbara, the highest CRESTA zone
Home insurance costs in Australia in 2026: premiums, risk areas and why prices are rising
Current premiums by state and territory, how location and disaster risk change the cost of owning a home, and where affordability pressure is highest.
Read full article →How much have home insurance premiums increased in Australia?
Premium growth since 2020 measured against CPI and wages, the role of building costs and reinsurance, and which states have seen the largest increases.
Read full article →SECTION 01 · DEFINITIONS
What does "hard to insure" mean in Australia?
Official Australian sources use 'hard to insure' to describe three different conditions:
- Availability, whether a household can get a quote or a policy at all.
- Affordability, whether the premium is reasonable relative to the household's income.
- Adequacy, whether the policy provides sufficient cover for a loss.
APRA regulates Australia's banks and insurers to support financial-system stability. Because uninsured damage can reduce the value of housing collateral, APRA worked with five major insurers to model premiums and insurance affordability across about 10 million existing freestanding houses under future climate conditions. This was not an observed count of households currently without cover. The test excludes strata properties and temporary dwellings such as caravans and tents; the same modelling method was used for rental homes and owner-occupied homes.
The ACCC tests availability more directly, using hypothetical quote requests. In January 2025, insurers issued a quote in 86% of attempts in the S–U wind-risk bands, against 77% in the highest (W) band. This indicates lower quote availability in the W band, although most test attempts still received a quote.
Adequacy is the least measured of the three. There is no official national count of underinsured households. Claim-complaint data records disputes but cannot measure the national prevalence of underinsurance.
Availability
Can a household get a quote?
Affordability
Can the household afford the premium?
Adequacy
Does the policy provide sufficient cover for a loss?
Source: APRA, Mind the Gap: An Insurance Climate Vulnerability Assessment, 2026; ACCC, Insurance monitoring report, June 2026 (final report) and July 2025 (quote-testing figure).
SECTION 02 · NON-INSURANCE ESTIMATES
How many Australian households are effectively uninsured?
About 1.4 million households, 15% of the roughly 10 million freestanding houses in APRA's stress test, were effectively uninsured under 2024 conditions.
This is a stress-test estimate, not a count of homes that are actually uninsured today. It comes from risk and premium modelling conducted by five of Australia's largest home insurers, which together account for about 80% of the market by gross written premium.
By 2050, both stress-test scenarios produce a similar result despite using different assumptions about climate and economic conditions: between 25% and 26% of households, or about 2.4 million, could be effectively uninsured. APRA estimated that climate-related factors would drive around 80% of that increase, rather than non-climate economic changes.
Modelled 2050 outcome
Households that could be effectively uninsured by 2050
Both APRA scenarios converge on 25–26% of modelled households, with climate factors driving around 80% of the increase.
APRA · 2050 scenariosWhere the pressure concentrates: outside the cities, and in two states
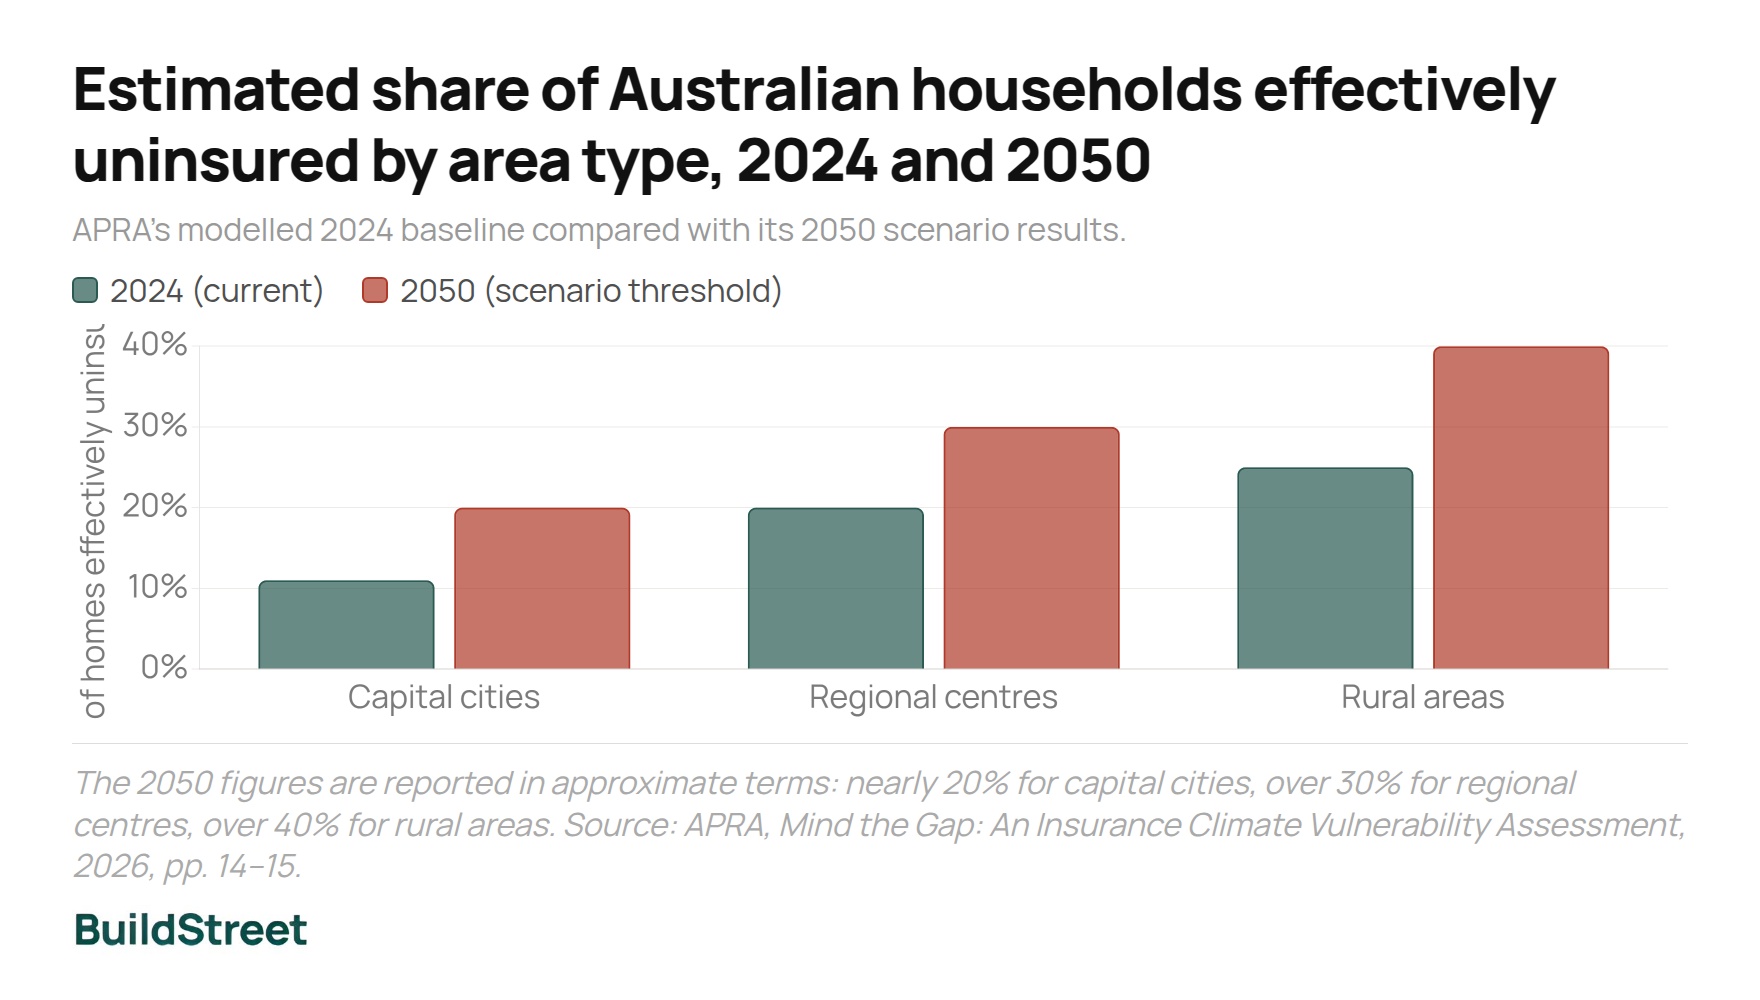
This projected pressure is already uneven by area type. In 2024:
- Capital cities: about 11%
- Regional centres: about 20%
- Rural areas: about 25%
By 2050, that gap widens further: roughly 20% in capital cities, over 30% in regional centres and over 40% in rural areas.
Around 60% of the households APRA modelled as uninsured were located in New South Wales and Queensland, both under the 2024 baseline and in the 2050 scenarios. The share of Statistical Area Level 4 (SA4) regions where more than a third of households are modelled as uninsured could rise from about 8% under the 2024 baseline to over 25% by 2050.
Estimated share of Australian households effectively uninsured by area type, 2024 and 2050
APRA's modelled 2024 baseline compared with its 2050 scenario thresholds, by area type.
The 2050 figures are reported in approximate terms: nearly 20% for capital cities, over 30% for regional centres, over 40% for rural areas. Source: APRA, Mind the Gap: An Insurance Climate Vulnerability Assessment, 2026, pp. 14–15.
About the data: APRA's scenarios are not forecasts
They assume that no additional public policy measures or physical adaptation are introduced to reduce climate risks in Australia's housing market or broader economy. This "static policy" setting is intended to isolate the factors that could affect the insurance protection gap.
SECTION 03 · OBSERVED PRICE PRESSURE
How have insurance premiums changed across Australia?
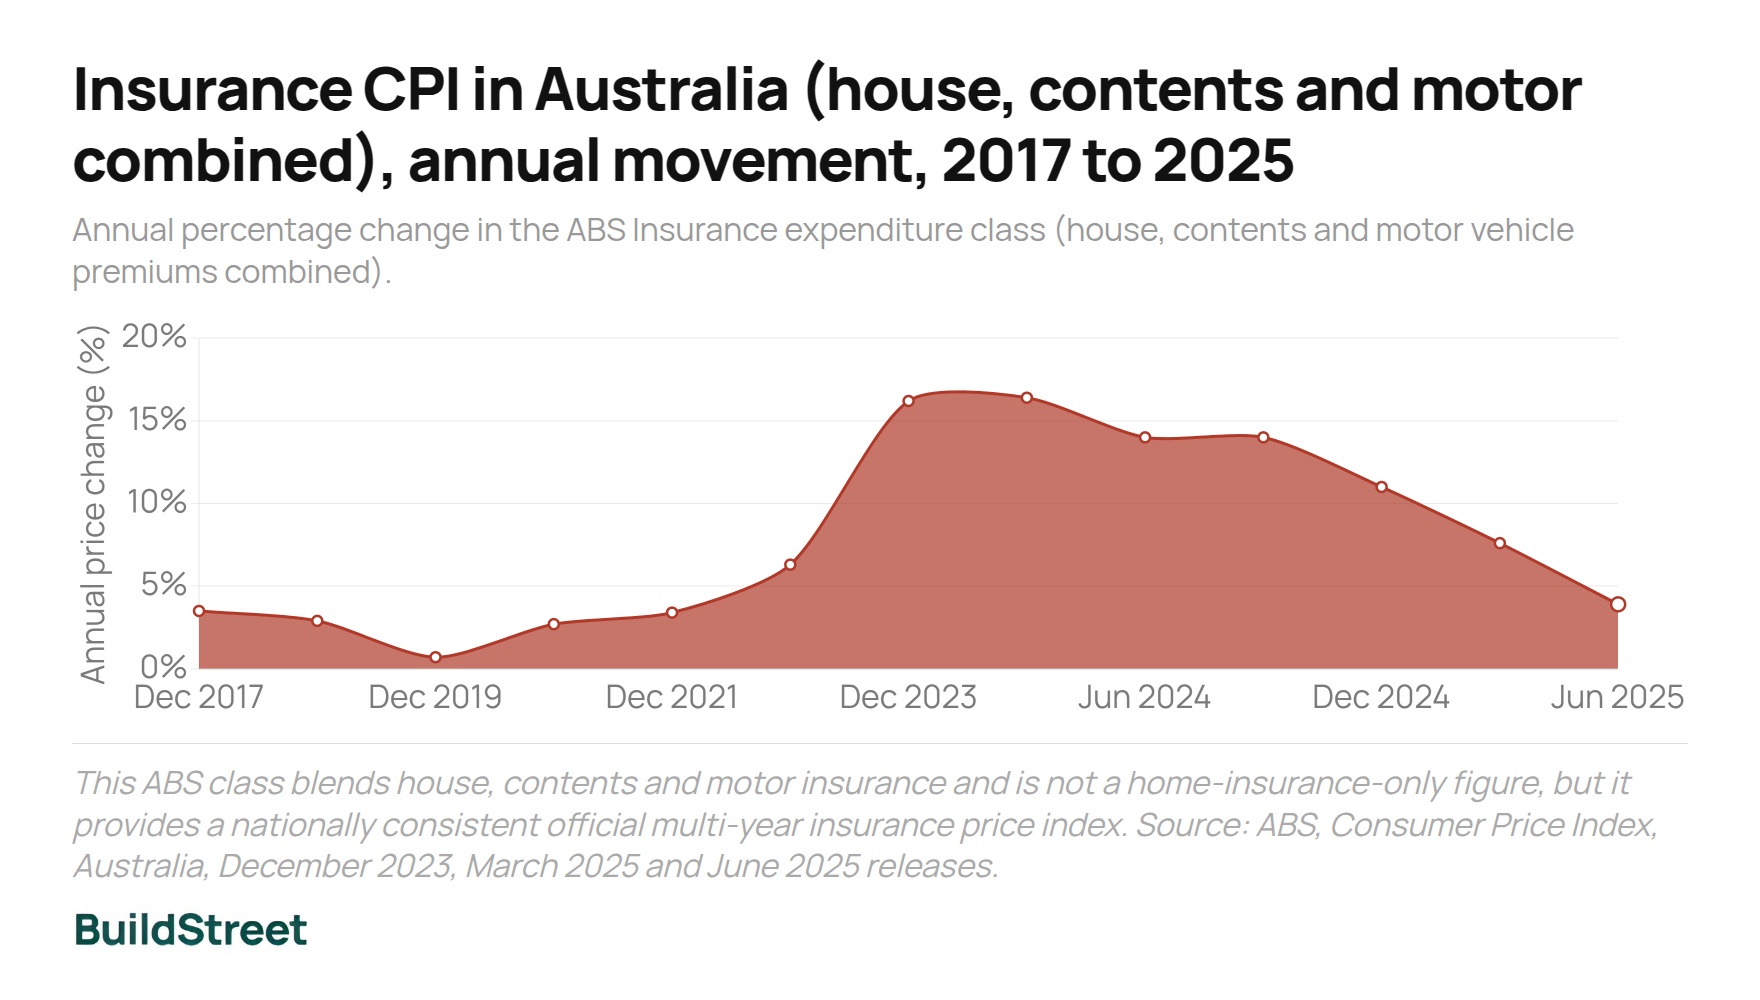
The ABS Insurance expenditure class rose 16.2% in the year to December 2023, the fastest annual increase for this expenditure class since March 2001. This measure combines premiums for house, home contents and motor vehicle insurance, so it is not a home-insurance-only figure. Unlike APRA's stress-test estimates, it records observed price movements.
Insurance price growth remained between three and five times the headline inflation rate through 2024, even as headline inflation fell from a peak of 7.8% in the December 2022 quarter to around 2.4% by March 2025:
- March: 16.4% versus 3.6%
- June: 14.0% versus 3.8%
- September: 14.0% versus 2.8%
- December: 11.0% versus 2.4%
Insurance CPI in Australia (house, contents and motor combined), annual movement, 2017 to 2025
Annual percentage change in the ABS Insurance expenditure class (house, contents and motor vehicle premiums combined).
This ABS class blends house, contents and motor insurance and is not a home-insurance-only figure, but it provides a nationally consistent official multi-year insurance price index. Source: ABS, Consumer Price Index, Australia, December 2023, March 2025 and June 2025 releases.
Average home and contents insurance premiums by region
Average home and contents premiums by region in 2024–25:
- North Western Australia: up 8% to $4,966, the highest of the four regions tracked
- Northern Territory: up 6% to $3,546
- North Queensland: up 4% to $3,117
- Rest of Australia: up 10% to $2,310, the fastest increase among the four regions despite the lowest starting base
Average home and contents premium by region in Australia, 2023–24 vs 2024–25
Nominal average combined home and contents insurance premiums in the four regions monitored by the ACCC.
Percentage change shown per region: north WA +8%, Northern Territory +6%, north Queensland +4%, rest of Australia +10%. Source: ACCC, Insurance monitoring report, June 2026 (final report).
Reinsurance costs
Why did reinsurance costs fall in northern Australia?
Total reinsurance costs for home and contents policies written in northern Australia fell for the second consecutive year, from $208 million to $164 million in 2024–25. The ACCC said the latest reduction was more likely driven by insurers retaining more risk and a generally softer global reinsurance market than by the cyclone pool alone. Total reinsurance costs also fell in the rest of Australia for the first time since 2017–18. However, other costs, including non-cyclone extreme-weather losses and claims-cost inflation, remained high or continued to rise.
ACCC · 2024–25SECTION 04 · THE CYCLONE REINSURANCE POOL
How has the cyclone reinsurance pool affected home insurance premiums?
Properties reinsured
3.2 million
Including 3,009,855 home buildings, 73,459 strata buildings and 104,922 small-business buildings, as at December 2025
Commonwealth guarantee
$10 billion
Backs the pool's reinsurance capacity
Where savings concentrate
2% of policies
Medium-to-high cyclone-risk policies account for the largest measured reductions
Source: ARPC, Cyclone Pool Statistics as at 31 December 2025; Commonwealth guarantee amount per ACCC, Insurance monitoring report, June 2026 (final report).
The cyclone reinsurance pool has reduced average premiums for properties facing medium-to-high cyclone risk, but it has not produced lower premiums across every risk category or attracted new insurers to northern Australia.
The pool commenced on 1 July 2022, though insurers joined at different times: large insurers by the end of 2023, and small insurers by the end of 2024. As a result, the ACCC's pre-pool and post-pool comparisons are measured against the date each insurer joined, rather than a single market-wide date.
For medium-to-high cyclone-risk properties, the average combined home premium per $100,000 sum insured fell by 11% after insurers entered the pool. Second-year post-pool premiums in this band were 14% below pre-pool levels.
Post-pool premium decreases recorded in several northern Australian cities:
- Karratha: down 15%
- Mackay: down 14%
- Cairns: down 12%
Strata and small-business premiums in the same risk band fell 8% and 24% respectively. Premiums for nil- and low-risk properties also increased after the pool began: combined home cover rose 6% for nil-risk and 3% for low-risk, while small-business premiums rose 10% for both. According to the ACCC, these increases were unlikely to be caused by the pool and were more likely to reflect broader premium increases.
Reinsurance is not charged on nil-risk policies. For low-risk properties, ARPC sets premiums broadly in line with what private reinsurers would have charged without the pool.
Cyclone reinsurance pool premium effect in Australia, per $100,000 insured: Combined home
Combined home, medium-to-high risk: pre-pool $708, post-pool $628, 2nd-year post-pool $606 (−14%). Strata, medium-to-high risk: $435 to $402 to $417. Small business, medium-to-high risk: $1,148 to $878 to $796 (−31% by year two). Source: ACCC, Insurance monitoring report, June 2026 (final report), Table ES.1.
Has the cyclone pool improved insurance availability?
No new insurers have entered northern Australia since the pool's introduction, and existing insurers have shown limited appetite to expand their exposure, despite the pool's aim of encouraging more competition.
An ACCC survey of 1,039 homeowners conducted between 16 January and 5 February 2026 found that nearly three in 10 households in medium-to-high cyclone-risk areas rated the number of insurers offering them cover as inadequate or completely inadequate, compared with fewer than one in 10 in nil-to-low-risk areas. About half of all households surveyed nationally, regardless of cyclone risk, rated their home insurance as unaffordable or barely affordable.
What cyclone mitigation discounts does the pool provide?
Cyclone-pool mitigation discounts range from 8% for roller-door bracing to 30% for a complete roof replacement and tie-down on homes built before 1982. Eligible uptake remains small: as at 31 December 2025, only about 2.0% of home-building risks in the pool qualified for the floor-elevation discount, and other measures sat below 1.6%.
The total mitigation discount applied to in-force premiums had grown to $9.4 million by 31 March 2026, against a pool covering around 3 million home buildings.
Cyclone-pool mitigation discount schedule in Australia, as at 31 December 2025
| Mitigation activity | Wind-premium discount | Eligibility note |
|---|---|---|
| Roller-door bracing upgrade or compliant retrofit | 8% | Homes built before 2012 |
| Window protection to all windows | 10% | Includes cyclone shutters |
| Roof structure tie-down upgrade | 20% | Homes built before 1982 |
| Complete roof replacement and tie-down | 30% | Homes built before 1982 |
Source: Discounts apply to the cyclone-pool wind premium only. A household's total retail premium also reflects other perils, insurer expenses, taxes and claims history. ARPC, Cyclone Pool Statistics as at 31 December 2025, Tables 9 and 10.
SECTION 05 · FLOOD AND BUSHFIRE RISK
How flood and bushfire risk affect home insurance in Australia
Share of modelled homes with flood exposure
50%+
Under APRA's 2024 stress-test baseline
Modelled annual flood-loss growth
240% by 2050
Under APRA's higher-emissions Current Policies Scenario
Modelled flood-loss concentration
10% of regions
Account for 50% of projected flood losses nationally
Source: These are national stress-test results, not an observed property-level count of flood-exposed homes. APRA, Mind the Gap: An Insurance Climate Vulnerability Assessment, 2026.
Flood risk affected more than half of the Australian homes modelled by APRA under its 2024 baseline. Under the higher-emissions Current Policies Scenario, annual flood losses could increase by around 240% by 2050, approximately four times the rate of increase modelled under the lower-emissions Delayed Transition Scenario.
Expected annual bushfire losses were about $0.5 billion under the 2024 baseline, compared with nearly $0.9 billion for cyclones. APRA modelled losses from both perils rising to more than $1.4 billion by 2050 under either scenario. Bushfire losses increased faster than cyclone losses in both scenarios.
Expected annual bushfire and cyclone losses in Australia, 2024 vs 2050
Expected annual weather losses by risk, comparing APRA's 2024 baseline with its two 2050 scenarios.
2050 values are the "over $1.4 billion" figure APRA reports for both perils under both scenarios; the true 2050 values may be higher. Source: APRA, Mind the Gap: An Insurance Climate Vulnerability Assessment, 2026, p. 14.
Why Australia has no official property-level flood-exposure count
No public, nationally consistent dataset reports an observed property-level count of homes exposed to flood risk by state or territory. APRA's finding that flood risk affects more than half of Australian homes is a stress-test modelling result rather than an address-level national count.
Geoscience Australia's National Exposure Information System data collection was decommissioned on 17 June 2025. The Australian Flood Risk Information Portal provides a catalogue of flood studies and maps contributed up to 2018, but it does not provide a current national count of flood-exposed homes.
SECTION 06 · UNDERINSURANCE
Why household underinsurance cannot be measured nationally
The number of Australian households that are underinsured is unknown. Underinsurance describes a household that holds a policy that does not fully cover its actual loss. APRA states that its climate stress test did not directly model underinsurance.
The closest available figure measures a related but distinct problem: non-insurance. APRA estimated that about 1.4 million households, or 15% of the households covered by its modelling, faced sufficient insurance-affordability pressure to be considered effectively uninsured under its 2024 baseline. This could rise to about 2.4 million households by 2050. These are stress-test estimates of affordability pressure, not observed counts of households without insurance, and they do not measure underinsurance.
General insurance complaints reached 34,231 in 2024–25, up 17% from 29,335 in 2023–24, compared with 27,924 in 2022–23 and 19,103 in 2019–20.
General insurance complaints received by AFCA in Australia, 2019–20 to 2024–25
| Financial year | Complaints received | Change on year before |
|---|---|---|
| 2019–20 | 19,103 | – |
| 2020–21 | 16,912 | −11% |
| 2021–22 | 18,563 | +10% |
| 2022–23 | 27,924 | +50% |
| 2023–24 | 29,335 | +5% |
| 2024–25 | 34,231 | +17% |
Source: Complaints dipped in 2020–21 before climbing in every year since. The increase in 2024–25 was driven by add-on insurance complaints, which jumped from 2,774 to 7,880. Excluding add-on insurance, general insurance complaints stayed broadly consistent over the previous two years. AFCA Annual Reviews, 2019–20 through 2024–25.
As a Commonwealth-authorised dispute resolution scheme, AFCA records complaints made rather than the prevalence of inadequate cover. Its figures therefore cannot be used to estimate household underinsurance.
SECTION 07 · GOVERNMENT RESPONSE
What government reinsurance and mitigation programmes operate in Australia?
Australian government responses include the cyclone reinsurance pool, national disaster-resilience funding and household and strata retrofit programmes in Queensland. The Australian Government backs the cyclone pool with a $10 billion guarantee and is spending a further $22.6 million over four years on the Hazards Insurance Partnership and several Strategic Insurance Projects.
The programmes have different purposes. The cyclone pool provides reinsurance, while the other initiatives fund risk analysis, disaster-resilience projects or property upgrades. The table therefore reports programme funding and eligibility rather than treating every initiative as having a measured effect on retail premiums.
Australian Government and Queensland resilience programmes, current funding as at 2026–27
| Programme | Funder or administrator | Amount | What it covers |
|---|---|---|---|
| Cyclone Reinsurance Pool | Australian Government / ARPC | $10bn guarantee | Reinsures about 3.2 million buildings, including approximately three million home buildings, as at December 2025 |
| Hazards Insurance Partnership and Strategic Insurance Projects | NEMA | $22.6m / 4 yrs | Government and insurance-industry collaboration on natural-hazard risk, insurance affordability and policy development |
| Disaster Ready Fund, Round Four | NEMA | $142.477m (2026–27) | Includes $104.6 million notionally allocated to infrastructure projects, $34.9 million to other projects and $3 million for programme administration |
| Household Resilience Program, Phase 4 | Australian Government funding / Queensland Government administration | Grant covers 80%, up to $15,000/home | Cyclone-resilience upgrades for eligible owner-occupied homes in coastal Central and Northern Queensland; homeowners contribute at least 20% |
| Strata Resilience Program | Australian Government / Queensland Government | Up to $150,000/body corporate (incl. GST) | Cyclone-resilience upgrades in eligible Central and North Queensland strata properties; supported by $40 million from the Australian Government and $20 million from the Queensland Government |
Source: Funding figures are as published by each programme; except for the cyclone-pool findings reported in Section 04, these figures describe programme funding and eligibility rather than measured changes in retail premiums. NEMA, Disaster Ready Fund Round Four Guidelines 2026–27; NEMA, Strata Resilience Program; Queensland Government, Household Resilience Program; Australian Treasury, 2025 review of the Terrorism and Cyclone Insurance Act.
How can mitigation be recognised in insurance pricing?
The Hazards Insurance Partnership published eight guiding principles for resilience investment in March 2026. The principles support investment in measures that materially reduce risk at the household or community level. Examples include raising homes to reduce flood risk and constructing levees or detention basins.
The principles also state that insurers should recognise risk reduction in the peril component of insurance premiums and consider whether mitigation improves insurance availability. However, they do not prescribe a particular premium reduction.
No guaranteed insurance discount for mitigation work
The eight guiding principles do not commit insurers to any specific percentage discount for resilience upgrades. Whether a mitigation upgrade shows up as a lower premium remains a decision for each insurer, not a guaranteed outcome of government funding.
SECTION 08 · SUMMARY
How insurance affordability risk is changing in Australia
APRA's modelling indicates that the share of households facing severe insurance-affordability pressure could rise from 15% under its 2024 baseline to 25–26% by 2050. Meanwhile, average combined home and contents premiums in the rest of Australia rose 10% in 2024–25, the fastest increase among the four regions tracked by the ACCC.
These findings measure different aspects of insurance pressure. APRA provides stress-test estimates, the ACCC reports observed home insurance premiums and the ABS Insurance expenditure class tracks price movements across house, home contents and motor vehicle insurance. They should not be treated as interchangeable measures.
Official data does not provide a single national figure for how many Australian homes are currently uninsurable, underinsured or unable to obtain a quote at any price. Underinsurance remains unmeasured nationally, while estimates of non-insurance are based on modelled affordability pressure rather than observed policy records.
General information only
This is a statistical reference drawing on publicly available Australian government data (APRA, ACCC, ARPC, NEMA, ABS, AFCA, Geoscience Australia and Australian Treasury), combining releases with different reference periods and methodologies. Scenario-based results (APRA) and observed market data (ACCC, ARPC, ABS, AFCA) measure different things and are never combined into single figures here. Not financial, insurance or planning advice. Data reviewed July 2026; recent complaint and price figures are preliminary and may be revised in later releases.
References
- APRA, Mind the Gap: An Insurance Climate Vulnerability Assessment, March 2026
- ACCC, Insurance Monitoring Report, June 2026 (fifth and final report)
- ACCC, Insurance Monitoring Report, July 2025 (fourth report)
- ARPC, Cyclone Pool Statistics, as at 31 December 2025
- ARPC, Cyclone Pool Statistics, as at 31 March 2026
- NEMA, Hazards Insurance Partnership, Guiding Principles published March 2026
- NEMA, Disaster Ready Fund Round Four Guidelines, 2026–27 funding round
- Queensland Government, Household Resilience Program, Phase 4
- NEMA, Strata Resilience Program, launched 2025
- Australian Treasury, Review of the Terrorism and Cyclone Insurance Act 2003, 2025 statutory review
- Geoscience Australia, Australian Flood Risk Information Portal
- ABS, Consumer Price Index, Australia, December 2023 quarter
- ABS, Consumer Price Index, Australia, June 2025 quarter
- AFCA, Annual Review, 2024–25
Chart Snapshots