Rooftop Solar & Batteries · Australia · Updated 13 July 2026
Solar and battery uptake in new Australian homes: 2026 data
More than 4.4 million rooftop solar systems have been installed across Australia. Battery installations recorded under the Small-scale Renewable Energy Scheme have passed 400,000 since batteries became eligible on 1 July 2025.
Uptake varies by location. In New South Wales and Victoria, regional areas have higher solar uptake than the capital city. In Queensland, South Australia, Western Australia and the Northern Territory, the capital has higher uptake than the regions.
Rooftop solar systems
4.44M
Installed nationally, current to 31 May 2026
Official dataBatteries since July 2025
401,185
Recorded under the Small-scale Renewable Energy Scheme to 31 May 2026
Official dataFastest-growing state
NSW
Led annual solar installs in 2025 and YTD 2026, though Queensland holds the largest cumulative total
Official dataWhat energy efficiency rules apply to new homes in Australia in 2026?
How the 7-star NCC standard works, what it requires of a home's design, and which states and territories have adopted it so far.
Read full article →Why Australia's 7-star energy standard has divided the building industry
Cost debate around NCC 2022's minimum energy rating: HIA's $20,000 estimate, government modelling showing a $822 lifetime net benefit, and state build cost data.
Read full article →SECTION 01 · National trends and new-build data
How rooftop solar installations have changed over time
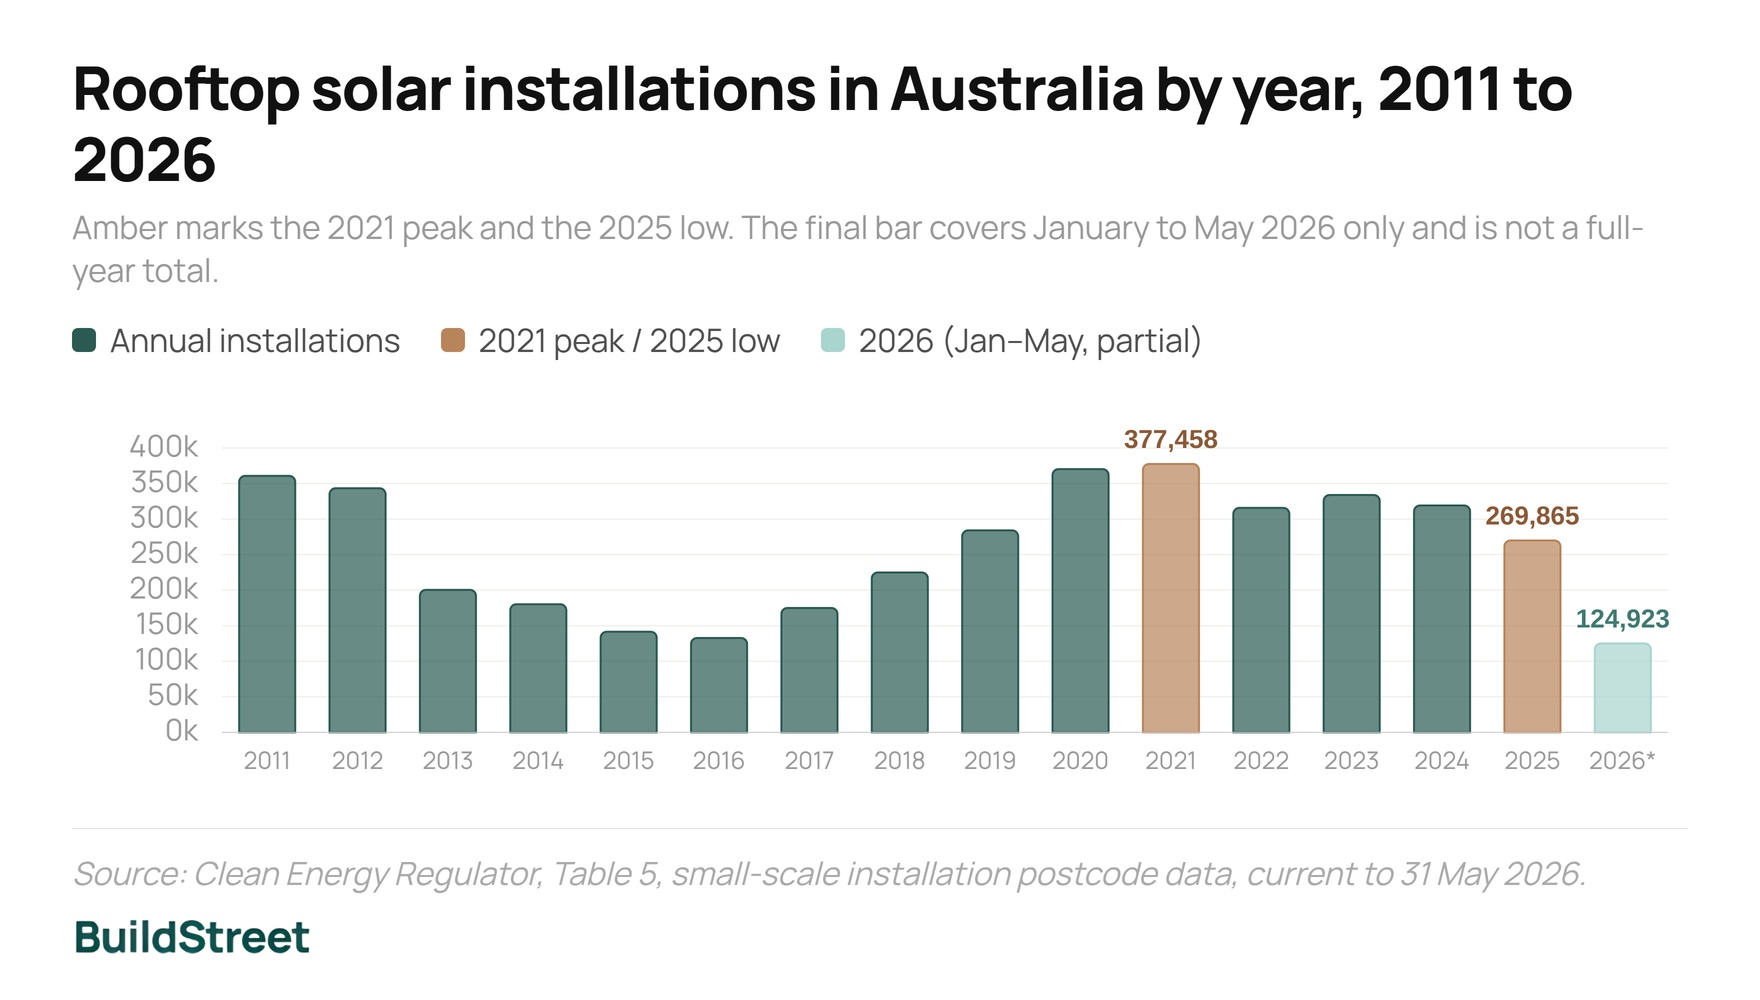
National installations fell 28.5% from a 2021 peak, before rising again in the first five months of 2026
At the national level, installations peaked at 377,458 in 2021, then declined for three of the next four years to a low of 269,865 in 2025. That was a decline of 28.5% from the peak and 15.4% below 2024.
Even at that low point, 2025 recorded more installations than every year between 2013 and 2018, though it still fell short of 2019's total of 284,031. The 2021 to 2025 decline followed installation totals in 2020 and 2021 that were higher than the years immediately before or after them.
From January to May 2026, 124,923 rooftop solar systems were installed, up 14.3% on the 109,312 installed over the same five months of 2025. This is a partial-year figure, not a forecast for the full year, but it is the first year-on-year increase since 2023.
Rooftop solar installations in Australia by year, 2011 to 2026
Amber marks the 2021 peak and the 2025 low. The final bar covers January to May 2026 only and is not a full-year total.
Source: Clean Energy Regulator, Table 5, small-scale installation postcode data, current to 31 May 2026.
How many new homes include rooftop solar or batteries as standard?
Do new homes come with solar or a battery as standard?
In the March quarter of 2026, 48,012 dwellings were commenced and 43,816 were completed nationally, but there is no official figure on how many included solar or a battery as standard. Dwelling-pipeline data is classified by approval, construction stage and sector, while solar and battery installation data is classified by postcode and installation date. Neither dataset links an installation to whether the address is a newly built home.
The gap reflects how the two datasets are structured, not an oversight in reporting. The two collections were not designed to be joined, and combining them into one figure would require assumptions that neither agency currently makes. The table below shows the scale of that pipeline.
| Dwelling pipeline measure | Figure | Reference period |
|---|---|---|
| Total dwellings commenced | 48,012 | March quarter 2026 |
| New private sector houses commenced | 27,658 | March quarter 2026 |
| Total dwellings completed | 43,816 | March quarter 2026 |
| New private sector houses completed | 26,201 | March quarter 2026 |
| Total dwellings under construction | 243,864 | March quarter 2026 |
| New houses under construction | 90,972 | March quarter 2026 |
| Total dwellings approved | 17,019 | May 2026 |
| New private sector houses approved | 10,537 | May 2026 |
Source: ABS Building Activity, Australia, March quarter 2026; ABS Building Approvals, Australia, May 2026.
Two factors help explain why no combined figure exists.
- Older housing stock evidence: An ABS case study for 2015–16 found homes purchased or built in the previous 10 years were more likely to have solar panels than older stock. This is consistent with higher solar uptake in newer homes, but the finding was never converted into a published national share, and it is now a decade old.
- A national accounts classification change: Rooftop solar is now recorded as its own asset class in national accounts, separate from the dwelling it sits on. The panel and the house it powers are no longer counted in the same inventory.
About the data
No Commonwealth or state agency currently publishes a share of new homes built with solar or a battery as standard. Any figure quoted without a named, dated official source is an estimate, not a measured statistic.
SECTION 02 · State and territory data
Which state has the most rooftop solar systems?
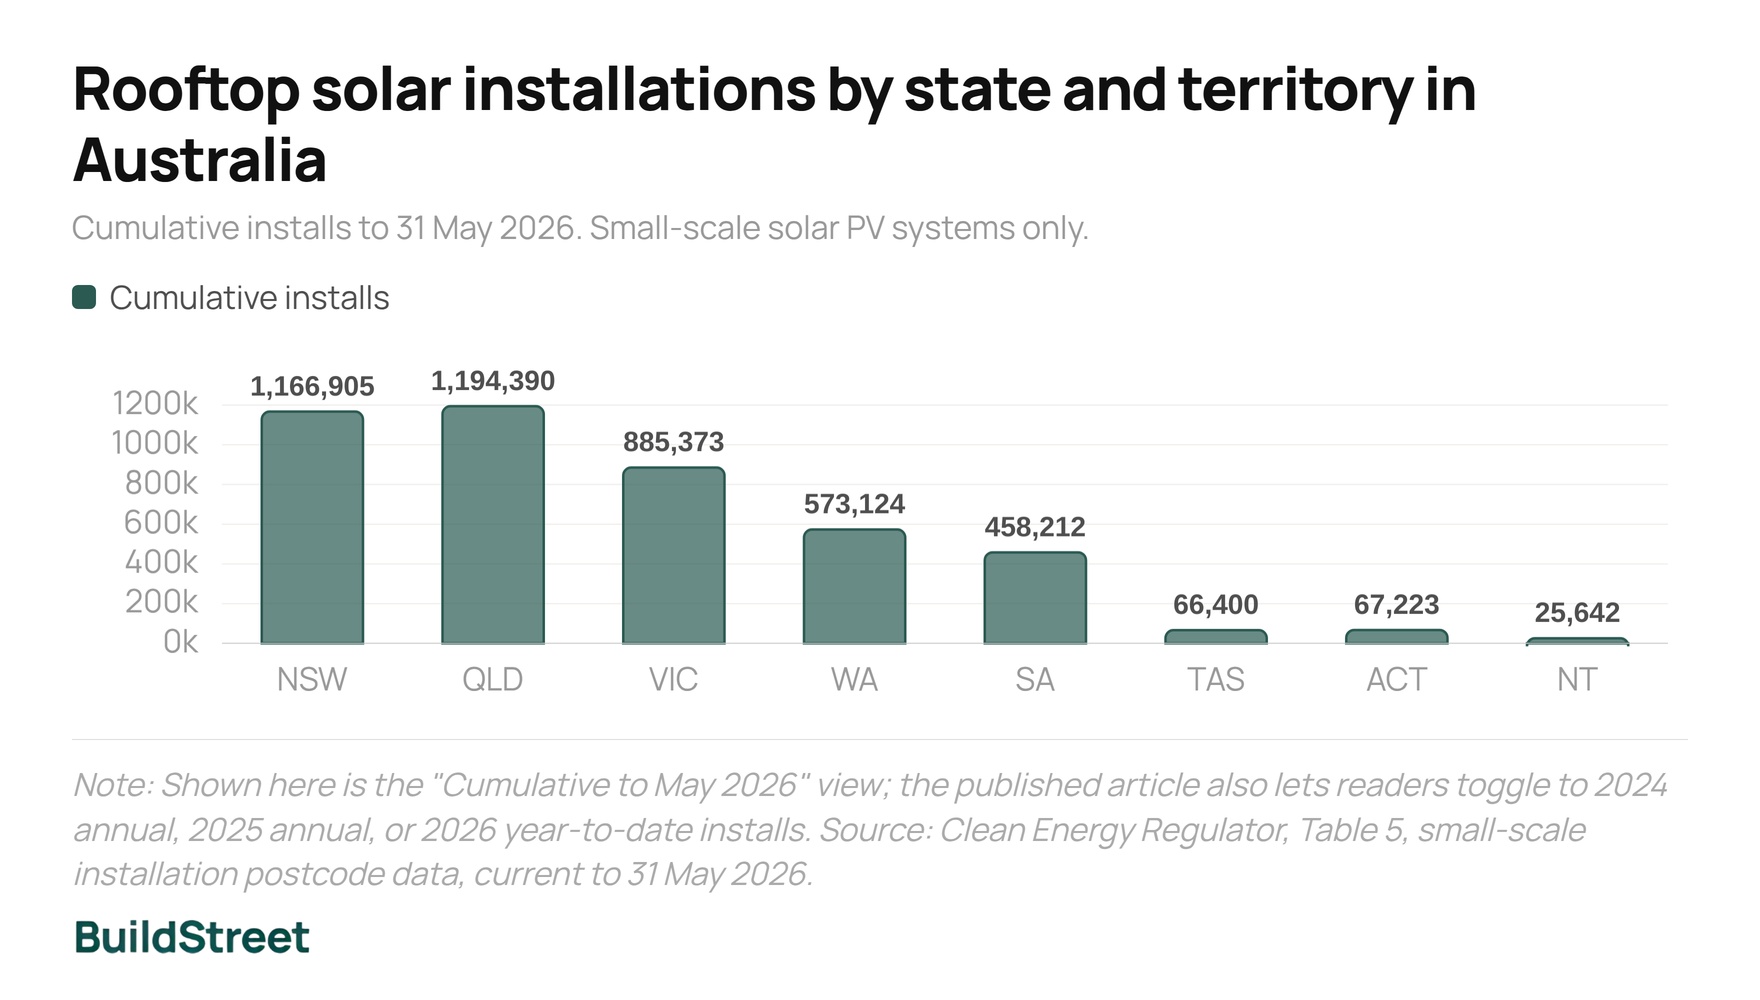
Queensland has the largest installed base of any state, with 1,194,390 systems installed to 31 May 2026.
Queensland is not the fastest-growing market. New South Wales added more systems than any other state in 2025, with 75,201 installations, and led again over the first five months of 2026, with 37,062 installations.
The state with the largest cumulative solar total and the state adding the most new solar each year are not the same. This shows the difference between total installed stock and recent installation activity.
Rooftop solar installations by state and territory in Australia
Cumulative stock and annual installs for 2024, 2025 and 2026 year-to-date. Small-scale solar PV systems only.
QLD
Source: Clean Energy Regulator, Table 5, small-scale installation postcode data, current to 31 May 2026.
Raw counts favour the largest states because they have more people and dwellings. The state selector below includes installs per 1,000 people, which gives a different picture of where rooftop solar has taken hold.
New South Wales
Rank 5 of 8 · installs per 1,000 people37,062
Installed, Jan–May 2026
1,166,905
Cumulative installs to 31 May 2026
135.0
Installs per 1,000 people
2024: 97,813 installs · 2025: 75,201 installs · Population, Dec 2025: 8,641,100
Source: Clean Energy Regulator, Table 5, small-scale installation postcode data, current to 31 May 2026; ABS national, state and territory population, December quarter 2025.
On a per-person basis, South Australia has the highest rooftop solar uptake in the country, ahead of Queensland and Western Australia. South Australia's population and total system count are both smaller than those states.
Queensland and Western Australia also rank higher per person than their raw totals suggest. New South Wales and Victoria, the two largest states by population, both sit below the national average once uptake is measured per person.
SECTION 03 · Battery data
How battery uptake has changed since the Cheaper Home Batteries Program began
A total of 401,185 batteries were recorded under the Small-scale Renewable Energy Scheme from 1 July 2025 to 31 May 2026. That is more than twelve times the 31,305 batteries voluntarily reported with solar systems in all of 2024, the last full year before the change.
Part of that increase reflects a change in counting method, not only a change in demand:
- Before 1 July 2025: only batteries voluntarily reported alongside solar were counted.
- From 1 July 2025: batteries became eligible for certificates under the Small-scale Renewable Energy Scheme, and approved battery installations were recorded through the scheme, including retrofits.
The two series use different definitions and different coverage. They cannot be joined into one continuous trend line.
Home battery installations in Australia before and after the scheme change
Logarithmic scale. Sand bars are the old voluntary count (2014 to mid-2025); teal bars are the new scheme count (from 1 July 2025). The two series are not directly comparable.
Source: CER historical voluntary state data for battery installations (to 30 June 2025); CER small-scale installation postcode data, SRES battery table (from 1 July 2025).
Concurrent battery installs, meaning batteries fitted at the same time as solar, rose from 693 in 2014 to 31,305 in 2024, up 16.1% on the year before. This was a growing market before the federal scheme began.
Once batteries became eligible for the Cheaper Home Batteries Program, installation volume increased by an order of magnitude: 204,799 installed from 1 July to 31 December 2025, and a further 196,386 in the first five months of 2026.
Are new batteries installed with solar or retrofitted to existing systems?
About 45% of batteries were installed concurrently with new or upgraded solar when the scheme launched in mid-2025. This rose to 48% by the March 2026 quarter.
This split helps separate batteries installed with new or upgraded solar from batteries retrofitted to existing solar systems. It does not identify newly built homes, so it should not be treated as a new-build battery share.
Share of battery installs in Australia that are retrofits versus concurrent with solar
Concurrent installs include batteries fitted with a new solar system or an upgrade to an existing one.
Source: CER Quarterly Carbon Market Reports, June quarter 2025 to March quarter 2026.
The concurrent share moved from 45% to 47% to 49%, then to 48%. It did not move in a straight line. Around 10% of battery installs in mid-2025 could not be automatically linked to a solar system, so a single quarter's retrofit and concurrent split should be treated as indicative, not exact.
New South Wales has the highest cumulative battery installs of any state. This differs from solar, where Queensland holds the largest installed base.
| State or territory | 2025 (from 1 Jul) | 2026 to 31 May | Cumulative |
|---|---|---|---|
| New South Wales | 69,601 | 72,016 | 141,617 |
| Queensland | 38,186 | 43,006 | 81,192 |
| Victoria | 42,580 | 34,161 | 76,741 |
| Western Australia | 22,637 | 20,723 | 43,360 |
| South Australia | 25,097 | 20,648 | 45,745 |
| Tasmania | 2,254 | 1,897 | 4,151 |
| Australian Capital Territory | 3,826 | 3,518 | 7,344 |
| Northern Territory | 618 | 417 | 1,035 |
| Australia | 204,799 | 196,386 | 401,185 |
Source: Clean Energy Regulator, Table 8, Small generation unit solar batteries, current to 31 May 2026.
More than 284,000 validated batteries had been installed under the scheme by the March 2026 quarter, delivering 7.4 GWh of usable capacity. That included 2.5 GWh from around 82,000 batteries installed in the March quarter alone.
SECTION 04 · Drivers
What is driving battery uptake in new homes?
Three forces appear in official data, and all three overlap:
- A 30% discount on the upfront cost of eligible small-scale battery systems through the federal subsidy scheme.
- A 75% fall in rooftop solar installation costs per kilowatt since the 2010 to 2011 financial year.
- New state building rules that support all-electric, solar-ready design.
No official dataset isolates why a new-build household specifically chooses a battery. These factors apply across the wider housing market, not only to newly built homes.
A federal subsidy that grew mid-rollout
The Cheaper Home Batteries Program discounts the upfront cost of eligible small-scale battery systems by around 30%, funded through certificates rather than added to electricity bills.
Funding for the program expanded from an original $2.3 billion estimate to around $7.2 billion over four years in December 2025. The program's target is more than 2 million Australians installing a battery by 2030, adding roughly 40 gigawatt hours of storage.
The economics of using solar on-site have changed
The cost of installing a kilowatt of rooftop solar fell 75% between the 2010–11 and 2024–25 financial years. Household solar generation grew 20 times over the same period.
Retail electricity prices roughly doubled since 2009–10, to $0.29 per kWh in 2024–25. The average feed-in tariff paid for exported solar roughly halved over the same period, to $0.06 per kWh. Under these prices, self-consuming rooftop solar can be worth more relative to exporting it than it was a decade ago.
Install cost per kW
−75%
Fall in rooftop solar install cost per kilowatt, 2010–11 to 2024–25
Feed-in tariff
$0.06
Average feed-in tariff per kWh in 2024–25, roughly half the rate a decade earlier
Retail electricity price
$0.29
Average retail price per kWh in 2024–25, roughly double the rate since 2009–10
Source: ABS, Household solar electricity generation in the Australian national accounts, 2025.
New building rules support all-electric and solar-ready homes
More than 7,000 BASIX Energy 100 certificates had been issued in New South Wales as of December 2025. This is the maximum BASIX energy score, and NSW Planning says it can only be achieved by all-electric homes powered by rooftop solar.
Victoria has run a separate requirement since 1 January 2024: new homes needing a planning permit must be all-electric, with no new gas connections. More than 20,000 battery systems have since been installed across the state through its own state-level rebate scheme, in addition to the federal program.
Neither state's rule requires a battery. These rules support home designs that are all-electric or solar-generating, but they do not prove that batteries are becoming standard in new builds.
1 October 2023
Enhanced BASIX takes effect in NSW
Thermal standard lifts toward 7-star equivalence and the whole-of-home energy target rises, ahead of most other states' NCC 2022 adoption.
1 January 2024
Victoria's all-electric mandate begins
New homes and apartments requiring a planning permit must use electric heating, water heating and cooking, with no new gas connections.
15 January 2024
ACT adopts the 7-star standard
The territory moves to the national NCC 2022 whole-of-home framework, with a whole-of-home score of 60.
May 2024
Victoria and Queensland adopt the 7-star standard
Both states move to the NCC 2022 7-star thermal minimum and whole-of-home budget. Queensland folds its standalone solar credit into the whole-of-home calculation.
1 October 2024
South Australia adopts the 7-star standard
1 May 2025
Western Australia completes its 7-star transition
1 July 2025
Cheaper Home Batteries Program launches
Batteries become eligible for Small-scale Technology Certificates, cutting the upfront cost of a typical battery by around 30%.
December 2025
Battery program funding expands to $7.2 billion
The Commonwealth increased funding beyond the original $2.3 billion estimate as uptake exceeded early forecasts.
Source: NSW Planning Portal; Sustainability Victoria; Business Queensland; ABCB NCC 2022 adoption dates; DCCEEW Cheaper Home Batteries Program.
About the data
The federal subsidy, falling solar costs and state building rules apply to the whole housing stock, not just new homes. No dataset isolates why a new-build household specifically chooses a battery.
SECTION 05 · Building rules
Do new homes in Australia need solar panels or batteries?
Six of Australia's eight states and territories have adopted the national 7-star, whole-of-home standard. Tasmania and the Northern Territory have not.
No jurisdiction requires a new home to have solar panels or a battery. Most jurisdictions require a minimum energy-efficiency standard, and solar is one way a home can meet it. A 7-star rating does not mean solar is compulsory.
The national benchmark is NCC 2022, assessed through NatHERS. It sets two separate requirements:
- Thermal rating: new houses need a minimum 7-star rating; new apartment buildings need an average of 7 stars with no single unit below 6.
- Whole-of-home score: new houses need a score of 60 out of 100; new apartments need 50. This factors in major fixed appliances plus any solar or battery on site.
A well-insulated home can still fail the whole-of-home test if its appliances and hot water system are inefficient. A home with solar panels can still fail if the building shell is poor. Both ratings must be met, and neither one specifically requires solar.
| State | Adopted from | Star rating | Solar and battery treatment |
|---|---|---|---|
| NSW | 1 Oct 2023 | 7-star equivalent | Runs its own BASIX pathway rather than NatHERS whole-of-home; solar assessed as an alternative energy source. A BASIX score of 100 is only reachable with an all-electric home powered by solar. |
| ACT | 15 Jan 2024 | 7-star | Follows the national whole-of-home framework (score of 60). |
| Victoria | 1 May 2024 | 7-star | National whole-of-home framework, plus a separate all-electric mandate for planning-permit homes from 1 Jan 2024. |
| Queensland | 1 May 2024 | 7-star | National whole-of-home framework. A standalone solar credit was removed on 30 Apr 2024; solar now only counts inside the whole-of-home budget. |
| South Australia | 1 Oct 2024 | 7-star | National whole-of-home framework. |
| Western Australia | 1 May 2025 | 7-star | National whole-of-home framework. |
| Tasmania | Not adopted | Previous standard | Has deferred the 7-star and whole-of-home requirements. Separately, has adopted the NCC 2022 condensation and livable-housing provisions. |
| Northern Territory | Not adopted | 5-star | New houses need only a 5-star rating and new apartments 3.5-star, under the pre-2022 code. No whole-of-home budget applies. |
Source: NSW Planning Portal; NatHERS; Sustainability Victoria; Business Queensland (QDC 4.1); ABCB NCC 2022 adoption dates; Housing Industry Association.
Key exception
Tasmania and the NT
These are the only two jurisdictions that have not adopted the national 7-star and whole-of-home standard. New homes in the Northern Territory can be approved to a 5-star rating with no energy budget for appliances or solar offsets, a lower requirement than the rest of the country.
SECTION 06 · Capital city versus regional
How does rooftop solar adoption differ between capital cities and regional areas?
Rooftop solar adoption differs between capital cities and regional areas by state. There is no single national pattern.
- Western Australia shows the widest gap in this dataset: regional areas trail Greater Perth by 18.4 percentage points, at 35.1% of dwellings compared with 53.5%.
- New South Wales shows the opposite pattern. Regional areas lead Greater Sydney by 10.6 percentage points, at 44.8% of dwellings compared with 34.2%.
No official, current ranking of capital cities against their own regions exists for this measure. The figures below are calculations based on Australian PV Institute local government area data, grouped into capital-city and rest-of-state areas using the ABS Greater Capital City Statistical Area structure.
Residential solar as a share of dwellings, capital city vs rest of state
Capital city figures use the ABS Greater Capital City Statistical Area boundary. Share of all dwellings with residential solar, current to 31 December 2025.
Source: Australian PV Institute, LGA solar dataset (to 31 Dec 2025); ABS Australian Statistical Geography Standard, Edition 3.
The remaining states and territories divide the same way:
- Victoria: regional areas lead Greater Melbourne, 35.0% versus 29.8% of dwellings.
- Northern Territory: Greater Darwin leads regional NT, 38.7% versus 17.6%.
- Queensland and South Australia: the capital city leads the region by a smaller margin.
- Tasmania: the capital and the regions are within a percentage point of each other.
Outer-suburban new-estate construction may be one factor in some capital-city results, but the data does not directly link rooftop solar installations to newly built homes or housing estates.
About the data
This capital city versus regional split is a derived calculation, not an official published table. BuildStreet grouped Australian PV Institute LGA solar adoption data into ABS Greater Capital City Statistical Areas and rest-of-state areas, then weighted the results by dwelling counts. Read as an indicative comparison, not as an official APVI, ABS or CER ranking.
SECTION 07 · The bigger picture
How much rooftop solar and battery storage does Australia have?
More than 4.4 million rooftop solar systems have been installed across Australia, while ABS describes rooftop solar as reaching more than 4 million homes, or roughly one in three.
Household solar generation has grown 20-fold since the 2010 to 2011 financial year and now accounts for around 8% of the country's total electricity generation. Households collectively saved just over $3 billion on electricity costs in 2024–25, equivalent to about $125 per person.
More than 400,000 batteries have been recorded under the Small-scale Renewable Energy Scheme since batteries became eligible on 1 July 2025. This remains a smaller installed base than rooftop solar.
Distributed solar output, Q1 2026
4,090 MW
Record first-quarter output, up 8.1% on Q1 2025
Small-scale capacity, Q1 2026
791 MW
Up 21% on Q1 2025, from around 77,000 new systems
Renewables share, NEM, Q1 2026
46.5%
Highest share of generation from renewables for any first quarter on record
Source: AEMO Quarterly Energy Dynamics, Q1 2026; CER Quarterly Carbon Market Report, March quarter 2026.
Official data shows the scale of rooftop solar and battery installations, but not the share fitted to newly built homes. Until installation and dwelling datasets are linked, new-build solar and battery adoption can only be discussed through clearly labelled proxy measures.
Data notes
Australia has detailed, current official data on rooftop solar installations by state and postcode, and newer data on battery installations since the Cheaper Home Batteries Program began. The Australian PV Institute's LGA data also allows capital-city and regional comparisons when the method is clearly labelled.
Official data does not currently include:
- A national count or share of new homes built with solar or a battery as standard
- A single long-run battery attach rate
- A dataset that isolates new-build household decisions from the wider housing stock
Derived figures, such as per-capita rankings and capital city versus regional comparisons, are labelled separately from official published statistics.
General information only
This page is based on publicly available official sources, including the Australian Bureau of Statistics, the Clean Energy Regulator, DCCEEW, AEMO, state planning departments and the Australian PV Institute. It is general information only and is not financial, building or legal advice. Where official data is unavailable, the article notes the gap rather than estimating a figure. Derived figures are marked and sourced separately from primary official statistics.
References
- ABS: Building Activity, Australia, March quarter 2026
- ABS: Building Approvals, Australia, May 2026
- ABS: Household solar electricity generation in the national accounts, 2024–25
- ABS: National, State and Territory Population, December quarter 2025
- ABS: Australian Statistical Geography Standard, Edition 3
- CER: Small-scale installation postcode data, to 31 May 2026
- CER: Historical battery installations with small-scale systems, 2014 to June 2025
- CER: Quarterly Carbon Market Reports, June 2025 to March 2026
- DCCEEW: Cheaper Home Batteries Program, December 2025 funding update
- NSW Planning Portal: BASIX sustainability standards
- Solar Victoria: New Victorian homes go all electric from 2024
- Sustainability Victoria: New home energy efficiency standards
- Business Queensland: Energy equivalence building standards
- NatHERS: Whole-of-home ratings, NCC 2022
- Australian PV Institute: Australian PV market analyses
- AEMO: Quarterly Energy Dynamics, Q1 2026
Chart Snapshots