A history of Australian housing policy: every major scheme and how it worked
In 2025, dwelling approvals rose 13.3%, while completions fell 2.9%. Over the same period, the share of Australian households in social housing fell from 4.7% in 2013 to 4.0% in 2025, despite governments introducing grants, guarantees, rental incentives, and multi-billion-dollar supply-investment programmes during that period.
Australian housing policy since 1990 has moved through three broad phases: need-based public provision, two decades of demand-side grants and guarantees, and a post-2023 shift toward supply-side investment. All three have left a measurable record, and each tells a different story about what the data can and cannot show.
Social housing share, 2025
4.0%
Down from 4.7% in 2013, despite decades of policy
Australians supported by Home Guarantee Scheme (since 2020)
230,000+
More than 1 in 3 first home buyers nationally in 2024–25
NRAS allocations already ceased by March 2026
32,963
Scheme winds up 30 June 2026
Social housing in Australia: stock, waitlists, and the shortfall
The full picture across all four programmes: how many dwellings exist, how many households are waiting, and estimated unmet need.
Read full article →Public housing statistics Australia
Stock, waitlist, occupancy, and state-by-state breakdown for Australia's largest social housing programme.
Read full article →Section 01 · Background
Australian housing policy before first home buyer grants
Phase 1 — need-based provisionPublic housing's share of the Australian housing system was already falling before the First Home Owner Grant existed. Through the 1990s, the system operated under the Commonwealth-State Housing Agreement (CSHA), a postwar framework that had been narrowing in scope for years. The 1999 revision shifted eligibility toward households unable to access the private market, moving away from the earlier model of broader tenure security for working Australians.
The CSHA was a supply-side architecture: the Commonwealth transferred funds to states to build and manage public housing. By the late 1990s, that model was under pressure from rising costs, ageing stock, and a policy shift toward more targeted housing assistance. Each successive agreement revision moved further from direct stock delivery and toward targeted financial assistance tied to intergovernmental conditions.
The 2003 CSHA was the last revision before the framework was replaced by the National Affordable Housing Agreement in 2009, which was in turn replaced by the National Housing and Homelessness Agreement in 2018. That agreement was itself replaced by the National Agreement on Social Housing and Homelessness from 1 July 2024. The form of Commonwealth housing commitment changed with each transition. Pressure on social and affordable housing supply continued.
The grant arrived into a system already in transition
By the time the First Home Owner Grant appeared in 2000, the housing system had already been moving away from broad public provision for more than a decade. It did not interrupt a stable system; it entered a housing system that was already becoming more targeted.
Major Australian housing policy events since 1990
1999
CSHA revised to need-based allocation
The 1999 CSHA shifted eligibility toward greatest need, away from broader tenure-based access. It marked a further shift away from broad public housing access and toward more targeted housing assistance.
1 July 2000
First Home Owner Grant introduced: $7,000
Demand-sideIntroduced as a GST offset. A national scheme funded by states and territories from GST revenues and administered by each state under its own legislation. A 2004 Productivity Commission inquiry found it would have a greater impact on home ownership if better targeted at lower-income buyers.
2003
Final CSHA revision
The 2003 CSHA was the last revision before the framework was replaced by the National Affordable Housing Agreement in 2009.
2008
NRAS launched
Supply-side (rental)National Rental Affordability Scheme: incentives for investors to rent at 20%+ below market rate for up to 10 years. It was a major federal attempt to increase below-market private rental supply.
2009
National Affordable Housing Agreement
Replaced the CSHA. Focused on social and affordable housing outcomes through intergovernmental funding conditions rather than direct Commonwealth housing construction.
2015
NRAS new allocations ended; approvals peak
PeakThe 2014–15 Budget ended funding for new NRAS allocations. In the same year, dwelling approvals reached the highest annual level in the ABS series used in this article, at 239,840.
2017
First Home Super Saver Scheme
Demand-sideAllows voluntary super contributions to be withdrawn for a first-home deposit, up to a cap of $50,000. Extended the demand-side approach into the superannuation system.
1 July 2018
National Housing and Homelessness Agreement
Combined housing and homelessness funding streams into a single intergovernmental agreement. Replaced NAHA; was itself replaced by NASHH from 1 July 2024.
Jan 2020
First Home Loan Deposit Scheme launched
Demand-sideGuaranteed loans for first home buyers with deposits as low as 5%, without lenders mortgage insurance. It later became part of the Home Guarantee Scheme and was redesigned, from October 2025, as the 5% Deposit Scheme.
June 2023
Social Housing Accelerator: $2 billion
Supply-sideOne-off $2 billion payment to states and territories to support around 4,000 new, refurbished and acquired social homes. It marked a larger Commonwealth supply-side commitment after two decades dominated by buyer-side support.
Aug 2023
National Housing Accord: 1.2 million homes target
Supply-sideTarget of 1.2 million new well-located homes over five years from mid-2024. $3.5 billion in payments committed to state, territory and local governments.
Nov 2023
Housing Australia Future Fund established: $10 billion
Supply-side$10 billion fund to support 20,000 new social and 20,000 affordable homes over five years, delivered through availability payments, concessional loans and grants to community housing providers and project partners.
1 July 2024
NASHH replaces NHHA; Housing Accord target period begins
Supply-sideNational Agreement on Social Housing and Homelessness: approximately $1.8 billion per year from the Commonwealth, with states required to match the $400 million annual homelessness component. Five-year value: $9.3 billion.
1 Oct 2025
5% Deposit Scheme: uncapped, no income limits
Demand-sideHome Guarantee Scheme redesigned with uncapped places for the general stream, no income caps, and higher property price caps.
5 Dec 2025
Help to Buy opens
Demand-sideShared equity scheme: government contributes up to 40% of the purchase price for new homes, up to 30% for existing. Intended to assist 40,000 households.
30 June 2026
NRAS ends
Wind-upAll remaining NRAS allocations were scheduled to cease by 30 June 2026. By March 2026, 32,963 allocations had already ceased. No equivalent private rental incentive scheme was operating at comparable scale as NRAS wound down.
Section 02 · Buyer-side grants and measures
The First Home Owner Grant and related buyer-side measures
Phase 2 — the buyer-side decades (2000–2022)From 1 July 2000, eligible first home buyers received a $7,000 grant as a direct offset for the GST's effect on new dwelling prices. The scheme was nationally designed but funded by states and territories from GST revenues and administered by each state under its own legislation, meaning the grant's value and eligibility criteria varied as states added top-ups and made adjustments over time. It became one of the most significant buyer-side housing measures of the period and helped set the pattern for the two decades that followed.
The original rationale was narrow: to compensate first home buyers for higher construction costs under the GST, not to increase housing supply or improve long-run affordability. In a market with limited supply, buyer grants can increase purchasing power without directly increasing the number of homes available. The number of homes available to purchase was not directly affected by the grant.
That structural critique was documented early. A 2004 Productivity Commission inquiry found the grant would have more impact on home ownership if it were better targeted to lower-income households. More than a decade later, a further review found that nearly $3 billion per year in grants paid to first home buyers across all schemes "works against improving affordability." The grant remained in place throughout both findings.
What the First Home Owner Grant was designed to do
The $7,000 payment was a GST compensation mechanism, not a housing supply measure. The policy objective was to support purchasing power at the point of transaction. The grant was designed to assist specific buyers, not to change how many homes were built.
What the data can and cannot show
No official Commonwealth source has published a nationally harmonised annual time series of FHOG recipients or total grant outlays. Each state administers and reports its own scheme separately. The official record does not include an estimate of the grant's effect on prices or supply.
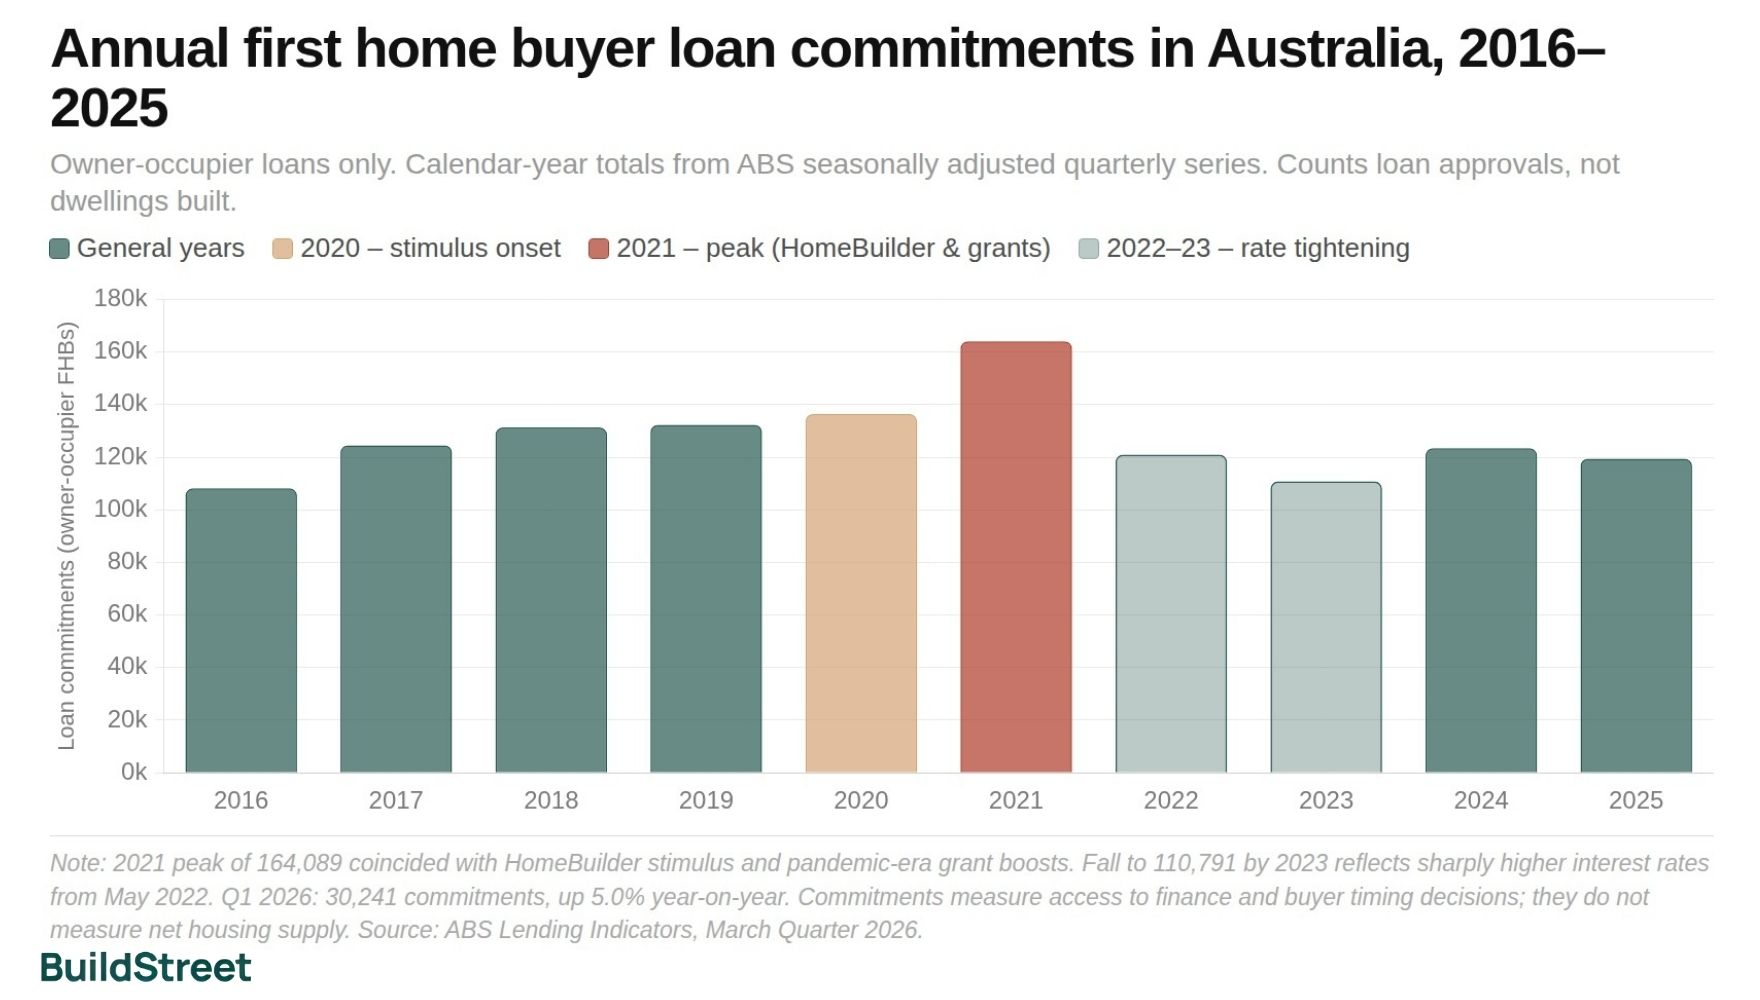
First home buyer loan commitments are the most consistent official measure of demand-side activity over time. Commitments peaked at 164,089 in 2021 during the HomeBuilder stimulus and pandemic-era grant boosts, then fell to 110,791 in 2023 as interest rates rose sharply from May 2022.
By 2025, commitments had partially recovered to 119,405. These movements reflect overlapping influences, including changes in interest rates, income support policies, and other buyer assistance programmes running at the same time, so no single factor explains them cleanly.
Annual first home buyer loan commitments in Australia, 2016–2025
Owner-occupier loans only. Calendar-year totals from ABS seasonally adjusted quarterly series. Counts loan approvals, not dwellings built.
Note: 2016 is the earliest year available in the ABS seasonally adjusted quarterly series used here. The 2021 peak of 164,089 coincided with HomeBuilder and pandemic-era grant boosts; the fall to 110,791 by 2023 reflects sharply higher interest rates from May 2022. Q1 2026: 30,241 commitments, down 4.3% on the quarter but up 5.0% year-on-year. Source: ABS Lending Indicators, March Quarter 2026.
How to read the peaks and troughs in this chart
The FHB loan series shows a pattern that has repeated across several demand-side programmes: activity rises sharply in response to stimulus, then falls when the stimulus ends or financial conditions tighten. The 2021 peak of 164,089 commitments fell to 110,791 by 2023 as rates rose. Whether peaks like this represent additional home ownership or purchases brought forward from future years is a question the official data cannot resolve.
Stamp duty concessions and the First Home Super Saver Scheme
Alongside the grant, states and territories offered transfer duty exemptions or concessions for eligible first home buyers throughout this period. These concessions follow the same demand-side logic as the FHOG, reducing the cost of entry at the point of transaction, but they are entirely state-administered. No Commonwealth source consolidates them into a national series of recipients or total costs.
Why stamp duty data is fragmented nationally
Each state administers and reports its own transfer duty concession scheme. Commonwealth sources acknowledge that these concessions exist, but do not publish a combined national total. The overall cost and reach of buyer-side transaction support across all states cannot be measured from official Commonwealth data alone.
First Home Super Saver Scheme
Introduced in 2017, the FHSS allows voluntary superannuation contributions to be withdrawn for a first-home deposit, up to a cap of $50,000. The scheme addresses the deposit hurdle at the point of entry, not the total number of dwellings available to purchase. It extended the demand-side approach into the superannuation system without changing the supply-side equation.
The shift from outright grants toward loan guarantees began in January 2020 with the First Home Loan Deposit Scheme. That change moved federal buyer assistance from a cash payment at settlement to an ongoing risk-transfer arrangement, though the core objective of reducing the deposit barrier remained the same.
Section 03 · Affordable rental supply
National Rental Affordability Scheme Australia: NRAS allocations, reach and wind-up
Across its lifetime, the National Rental Affordability Scheme (NRAS) had approximately 36,564 dwellings allocated in total. Launched in 2008, it offered annual tax offsets and cash payments to investors who agreed to rent to eligible low- and moderate-income households at least 20% below prevailing market rates for up to 10 years. It was a major federal programme specifically designed to increase the supply of below-market private rental housing.
The 10-year incentive limit was a deliberate design choice. It meant NRAS could not produce permanent, affordable housing stock. When the incentive period ended, landlords were free to charge market rents or sell. The 2014–15 Budget decision to end funding for new allocations capped the scheme's total size, and from that point, NRAS could only wind down.
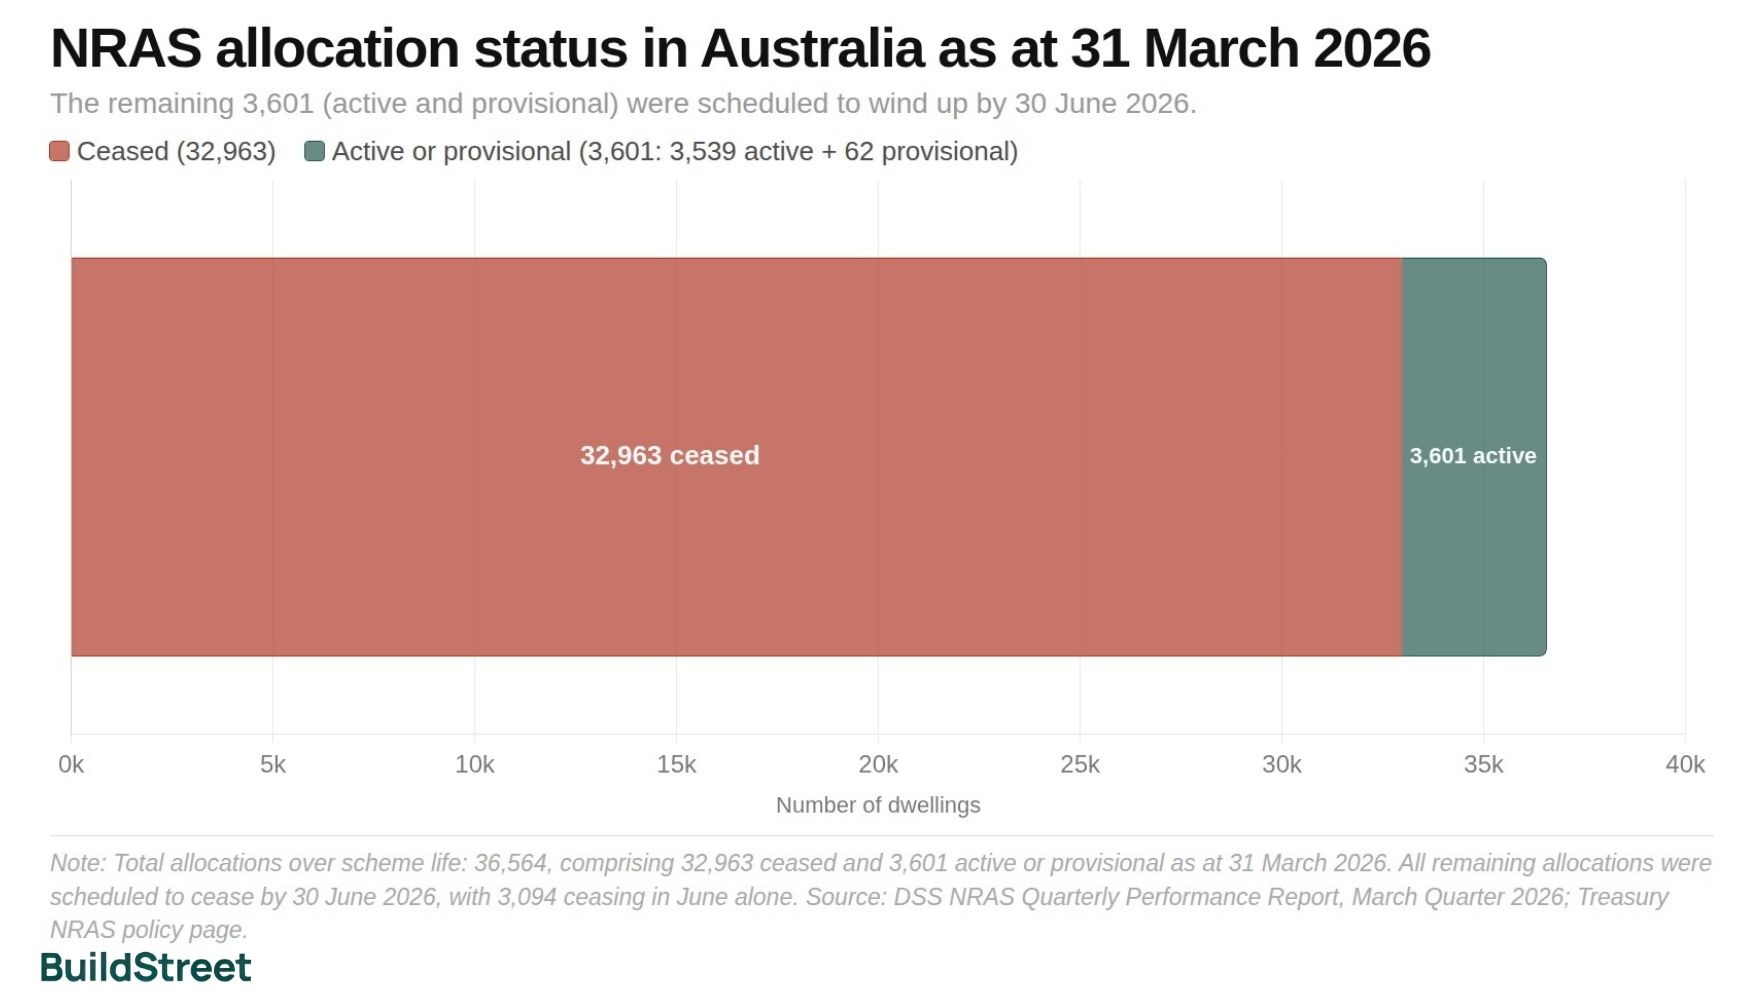
By March 2026, 32,963 allocations had already ceased, and 3,601 remained active or provisional (3,539 active and 62 provisional). All remaining allocations were scheduled to end by 30 June 2026, with 3,094 due to cease in that final month.
NRAS allocation status in Australia as at 31 March 2026
The remaining 3,601 (active and provisional) were scheduled to wind up by 30 June 2026.
Allocations
Note: Total allocations over scheme life: 36,564, comprising 32,963 ceased and 3,601 active or provisional as at 31 March 2026. All remaining allocations were scheduled to cease by 30 June 2026. Source: DSS NRAS Quarterly Performance Report, March Quarter 2026; Treasury NRAS policy page.
NRAS illustrates what a supply-side rental incentive can and cannot do. The official record shows how many dwellings entered the scheme and how many have since ceased. What it does not show is whether NRAS reduced rents, held rents below what they would otherwise have been, or produced a measurable change in rental affordability in the markets where it operated. Those questions go beyond what the available data supports.
NRAS was scheduled to end on 30 June 2026 under a different model from HAFF and the National Housing Accord
The Housing Australia Future Fund and the National Housing Accord's affordable homes component operate on a different model: co-investment with community housing providers rather than incentives to private landlords. Both programmes were still in their early delivery phases at the time NRAS wound up.
Section 04 · Deposit guarantees and shared equity
Home Guarantee Scheme, 5% Deposit Scheme and Help to Buy
Since January 2020, more than 230,000 Australians have used a federal loan guarantee to buy a home with a deposit as low as 5%, without paying lenders mortgage insurance. The First Home Loan Deposit Scheme, later renamed the Home Guarantee Scheme, covered the lenders mortgage insurance risk on the buyer's behalf. In 2024–25, 46,022 scheme places were taken up, representing more than 1 in 3 first home buyers nationally.
The mechanism worked differently from the $7,000 grant. Rather than a cash payment at settlement, the guarantee reduced the deposit barrier without requiring the buyer to save more. It also carried no upfront cost to government unless a guaranteed loan defaulted.
From 1 October 2025, the scheme was redesigned as the 5% Deposit Scheme, with uncapped places for the general stream, no income caps, and higher property price thresholds. That shift from a place-limited programme to an open-access model increased the number of buyers who could potentially use the scheme.
Australians supported since launch (Jan 2020)
230,000+
As at end of 2024–25 financial year
Share of all first home buyers nationally (2024–25)
1 in 3
46,022 places taken; 92% of available places
In 2024–25, more than 3,900 households used the scheme to purchase a newly built home. That figure counts new-home purchases made through the scheme in that financial year. It is not a measure of net new housing supply: it does not show how many homes were built because of the scheme.
From 5 December 2025, the Help to Buy scheme introduced a shared equity model. The government can contribute up to 40% of the purchase price for new homes and up to 30% for existing homes, with the buyer taking a smaller mortgage on the remaining share. The scheme is available to up to 40,000 households. Unlike a grant, the government's equity stake is repaid when the property is sold or refinanced, making it an ongoing co-investment arrangement rather than a one-off payment.
Federal buyer assistance in Australia: 2000 model vs 2026 model
2000 model
2026 model
FHOG design and $7,000 amount: Treasury Economic Roundup, Autumn 1999. 5% Deposit Scheme and Help to Buy: Treasury home ownership support policy page; Housing Australia Home Guarantee Scheme Trends and Insights Report 2024–25.
Section 05 · The post-2023 shift
Post-2023 Australian housing supply programmes: National Housing Accord, HAFF and NASHH
Phase 3 — the supply-side turn (2023–present)From 2023, federal housing policy shifted more directly toward housing supply, alongside continued support for individual buyers at the point of purchase. Planning capability, enabling infrastructure, and co-invested affordable housing finance became major policy instruments, alongside the buyer-side tools that remained in place.
The National Housing Accord, agreed in August 2023, set a target of 1.2 million new well-located homes over five years from mid-2024, up from an earlier target of one million. Supporting that target, $3.5 billion in payments was committed to state, territory and local governments. The Commonwealth separately committed $350 million over five years to support 10,000 affordable homes, with states agreeing to deliver up to a further 10,000.
The Housing Support Programme committed $3.5 billion toward planning capability, enabling infrastructure, roads, water and sewerage, including a $2 billion Local Infrastructure Fund announced in the 2026–27 Budget. This approach differs from a buyer grant: rather than reducing the cost of entry for a specific purchaser, it targets planning and infrastructure constraints that can affect whether new housing can be delivered.
Post-2023 federal housing supply programmes in Australia: scale and delivery status
As at June 2026. Figures from official Commonwealth sources.
| Programme | Commitment | Dwelling target | Status |
|---|---|---|---|
| Social Housing Accelerator | $2B (one-off, June 2023) | Approx. 4,000 social homes | States reporting committed, commenced and completed |
| National Housing Accord | $3.5B to states/territories | 1.2M homes by June 2029 | Most jurisdictions behind pace (NHSAC, March 2026) |
| Housing Support Programme | $3.5B total | No single dwelling target; enables supply pipeline | Active; $2B Local Infrastructure Fund added 2026–27 |
| Housing Australia Future Fund (HAFF) | $10B investment fund | 20,000 social + 20,000 affordable homes (5 yrs) | 279 projects committed; 18,650 homes after 2 rounds |
| National Agreement on Social Housing and Homelessness (NASHH) | Approx. $1.8B/yr ($9.3B over 5 yrs) | System funding, not dwelling-specific | Active from 1 July 2024; states match homelessness component |
HAFF: 279 projects committed across two funding rounds, targeting 9,284 social housing dwellings and 9,366 affordable housing dwellings. Round 3 opened in January 2026. National Housing Accord progress is tracked quarterly by the National Housing Supply and Affordability Council. Source: Treasury Accord, HSP, Social Housing Accelerator and NASHH policy pages; Housing Australia HAFF funding rounds 1 and 2 outcomes, 2024–25; National Housing Supply and Affordability Council reporting, March 2026.
After two funding rounds, the Housing Australia Future Fund had committed 279 projects to deliver 18,650 homes, comprising 9,284 social and 9,366 affordable housing dwellings, against a five-year target of 40,000. Rather than building directly, the fund supports projects through availability payments, concessional loans and grants to community housing providers and project partners, to attract private institutional capital alongside public funding. Round 3 opened in January 2026.
The National Agreement on Social Housing and Homelessness, active from 1 July 2024, provides around $1.8 billion per year from the Commonwealth, including around $400 million per year for homelessness, which states and territories are required to match. The full five-year agreement is valued at $9.3 billion. This is dedicated recurrent funding for housing and homelessness services, rather than a dwelling-specific construction target.
Section 06 · Approvals, completions and social housing
Australian dwelling approvals, completions, social housing and supply impact
In 2025, dwelling approvals rose 13.3% while completions fell 2.9%. Those two numbers moving in opposite directions in the same year illustrate the core tension in the housing pipeline: approvals are recovering, but finished homes are not following at the same pace. The gap may reflect construction costs, labour availability, and the financial viability of converting an approval into an actual start.
Approvals measure permissions to build. Completions measure homes that are finished. The two series track different moments in the same pipeline, and they have been diverging since 2022 during a period of elevated construction costs and capacity constraints.
Annual dwelling approvals vs completions in Australia, 2018–2025
Calendar-year totals from ABS seasonally adjusted series. Approvals summed monthly; completions summed quarterly. Calculated annual totals, not an official ABS annual publication.
Approvals series starts 2011; completions from 2018 (earliest year in the seasonally adjusted quarterly series). March quarter 2026 building activity data had not been released as at 24 June 2026. Source: ABS Building Approvals, Australia, April 2026; ABS Building Activity, Australia, December Quarter 2025.
Approvals peaked at 239,840 in 2015, then fell steadily to 165,297 in 2023, the lowest point in the ABS series from 2011. The 2025 figure of 197,307 represents a partial recovery, though it still sits about 18% below the 2015 peak.
Annual dwelling approvals in Australia, 2011–2025
Calendar-year sums of ABS seasonally adjusted monthly series. 2015 peak of 239,840 and 2023 trough of 165,297 are highlighted in red.
Note: Includes all dwelling types. January–April 2026 partial total: 68,090 approvals; April 2026 alone: 16,710 (up 10.2% year-on-year). Source: ABS Building Approvals, Australia, April 2026.
Completions peaked at 219,474 in 2018, the highest in the available data series, and have trended lower since. They fell across most years through to 2022, stabilised briefly in 2023 and 2024, then fell again to 172,657 in 2025, the lowest result in the series. Approvals and completions moved in opposite directions in 2025: approvals up 13.3%, completions down 2.9%.
Annual dwelling completions in Australia, 2018–2025
Calendar-year totals from ABS seasonally adjusted quarterly series. Not an official ABS annual publication. Completions fell to their lowest level in the series in 2025.
Note: December quarter 2025: 43,536 completions, down 1.7% on the previous quarter and 3.9% year-on-year. March quarter 2026 data not released as at 24 June 2026. Source: ABS Building Activity, Australia, December Quarter 2025.
Social housing stock, 2006–2025
Social housing covered 4.0% of all Australian households in 2025, down from 4.7% in 2013. In absolute terms, total stock grew from around 406,000 dwellings in 2006 to around 452,000 in 2025, but growth in the number of households outpaced it. Public housing fell from 341,000 dwellings in 2006 to 297,000 in 2025, a reduction of 44,000. Community housing grew from 30,100 to 118,000 over the same period, close to four times the 2006 level. The community sector expanded substantially, but the system-wide household share fell over the period measured.
Social housing stock in Australia: 2006 vs 2025
2006
2025
AIHW reports around 452,000 social housing dwellings at June 2025, covering 4.0% of Australian households. The 2006 total of approximately 406,000 is implied from AIHW's reported public housing figure of 341,000, or 84% of social housing dwellings; the total includes public housing, community housing, SOMIH and Indigenous community housing. In 2025, more than 200,000 households were on social housing waitlists nationally, with 32,400 newly allocated social housing, down from 33,600 in 2023–24. Source: AIHW Housing Assistance in Australia, 2026 edition.
Social housing dwellings in Australia by tenure type, 2006–2025
Public housing stock fell from 341,000 in 2006 to 297,000 in 2025 while community housing grew from 30,100 to 118,000. Counts at June each year; other includes SOMIH and ICH.
Note: Figures shown for 2006, 2010, 2014, 2018, 2022 and 2025. SOMIH and ICH figures are approximate; minor variation in reporting scope may apply across years. Source: AIHW Housing Assistance in Australia, 2026 edition.
Supply impact by scheme: what the official data records
Supply-side programmes in Australia produce official output figures tied to specific dwellings: homes committed, allocated, or targeted. Demand-side programmes produce take-up figures: loans approved, grants paid, and places used. That distinction matters when comparing schemes, because the two types of figures measure different things. One tracks what was built or allocated; the other tracks who used a financial instrument to purchase.
The table below uses only official output figures. Where no such figure exists, because the scheme was demand-side by design or because no causal data was published, that gap is noted.
Measurable supply-side outputs by housing scheme in Australia
Ranked by directness of connection to dwellings built or allocated, not by causal impact.
| Scheme | Type | Official output figure | What it does not measure |
|---|---|---|---|
| Housing Australia Future Fund (HAFF) | Supply-side | 18,650 homes committed (2 rounds); target 40,000 | Committed does not equal completed; delivery tracked separately |
| Social Housing Accelerator | Supply-side | Approx. 4,000 new, refurbished and acquired social homes | Mix of new builds, refurbishments and acquisitions; not all new dwellings |
| National Rental Affordability Scheme (NRAS) | Supply-side (rental) | 36,564 total allocations over scheme life | Time-limited by design; all ceased by June 2026. No official rent-impact figure published |
| National Housing Accord | Supply-side target | 1.2M homes targeted by June 2029 | Most jurisdictions behind pace as at March 2026; target is not an output count |
| Home Guarantee Scheme / 5% Deposit Scheme | Demand-side | 3,900+ newly built homes purchased via scheme (2024–25) | Not a net supply figure; does not show how many homes were built because of the scheme |
| First Home Owner Grant | Demand-side | No national annual series published | No official supply-impact estimate published by any consulted source |
| Stamp duty concessions (state) | Demand-side | No national harmonised series published | Cannot be quantified at national level from official Commonwealth sources |
| First Home Super Saver Scheme | Demand-side | $50,000 cap per participant | No supply-side output by design; assists deposit saving only |
HAFF figures: Housing Australia HAFF funding rounds 1 and 2 outcomes, 2024–25. NRAS total: DSS March 2026 quarterly report. Social Housing Accelerator target: Treasury programme page. Home Guarantee Scheme newly built figure: Housing Australia HGS Trends and Insights Report 2024–25. See references.
The clearest illustration of how these scheme types differ is the comparison between NRAS and HAFF. NRAS had 36,564 allocations over its lifetime, with remaining allocations scheduled to cease by 30 June 2026.
HAFF has committed 18,650 dwellings after two funding rounds, targeting permanent social and affordable tenures. The output counts are in the same order of magnitude, but the tenure model is structurally different: NRAS produced time-limited affordable rentals; HAFF is designed to produce permanent community housing stock.
The table records what official data can count. What it cannot show is whether supply or prices would have been different without each scheme. No official source publishes an estimate of what each housing programme caused. Three specific gaps are worth noting:
- The First Home Owner Grant. The grant's effect on the number of homes built was never officially estimated. Buyer activity, prices, and lending all move in response to interest rates, income, population, and planning rules simultaneously. Isolating the grant's specific contribution is not possible from the available data.
- NRAS and rents. The official record shows how many dwellings entered and exited the scheme. It does not show whether rents were lower in participating markets because NRAS existed, or by how much. Any claim about NRAS's effect on rental affordability goes beyond the published evidence.
- The 5% Deposit Scheme and supply. More than 3,900 households used the scheme to purchase a newly built home in 2024–25. That is a count of purchases. It is not an estimate of how many homes were built because of the scheme, as distinct from homes that would have been built anyway.
About the data
Housing outcomes reflect interest rates, migration, state planning systems, construction costs, and market cycles, not any single policy. The figures here describe what happened while each policy was active. They do not establish what those policies caused. That distinction is important when comparing buyer-side and supply-side housing schemes.
Section 07 · Three decades compared
Australian housing policy since 1990: three phases compared
Australian housing policy since 1990 has moved through three broad phases. All three overlap in practice, and no phase fully replaced the one before it.
The first was the late CSHA era. Public housing was state-built and directly funded by the Commonwealth. By 2006, public housing made up 84% of all social housing stock. By 2025, that share had fallen to 66% as community housing grew and public housing contracted in absolute numbers.
The second was the buyer-side decades. From 2000, the dominant federal instrument was a payment or guarantee at the point of purchase: the First Home Owner Grant, state transfer duty concessions, the FHSS, and from 2020, the Home Guarantee Scheme. These tools assisted specific buyers to transact at a point in time. Their effect on the total number of dwellings built is harder to demonstrate from the official record, and two separate assessments found that buyer-side support can add demand more readily than supply. The Productivity Commission's 2022 NHHA review also found that nearly $3 billion per year in first-home-buyer assistance worked against improving affordability.
The third is the current phase. From 2023, the Commonwealth added a supply-side layer through infrastructure funding, co-investment with community housing providers, and intergovernmental dwelling targets. The combination of the National Housing Accord, HAFF, the Housing Support Programme, the Social Housing Accelerator, and NASHH represents a broader Commonwealth supply-side role than the buyer-support-heavy period from 2000 to 2022.
Three eras of Australian housing policy compared
Each phase reflects its dominant policy logic. All three overlap in practice.
Pre-2000
Need-based provision
Core logic
Direct government housing construction and management via CSHA funding agreements
Who it targeted
Households unable to access private market, allocated by need
Primary tools
CSHA funding to states; public housing construction; public housing tenancy management
Key shift
1999 CSHA revised eligibility toward greatest need; model narrowed progressively through the decade
Supply effect measurable?
Yes, public housing stock directly counted
2000–2022
Buyer-side support
Core logic
Reduce entry barriers for defined buyer groups at the point of transaction
Who it targeted
First home buyers; income-eligible purchasers; key workers (from 2020)
Primary tools
FHOG ($7,000 grant); stamp duty concessions (state); FHSS; deposit guarantees (from 2020); NRAS (rental, 2008–2026)
Key shift
PC 2004 and 2022: buyer grants can add demand more readily than supply; approx. $3B per year in first-home-buyer assistance was found to work against improving affordability
Supply effect measurable?
Partially, loan and grant take-up counted; net supply impact not published officially
2023–present
Supply-side turn
Core logic
Increase total dwellings built by funding planning, infrastructure and affordable housing construction and finance
Who it targeted
System-level: all tenures, with specific streams for social and affordable housing and key workers
Primary tools
National Housing Accord (1.2M target); HAFF ($10B); Housing Support Programme ($3.5B); Social Housing Accelerator ($2B); NASHH ($9.3B, 5 yrs)
Key shift
A larger Commonwealth supply-side role through infrastructure funding, affordable housing finance and intergovernmental dwelling targets
Supply effect measurable?
Too early, commitments counted; completions pipeline still developing as at June 2026
Phase characterisation based on dominant policy logic, not a formal government classification. Dates reflect when each phase's instruments became dominant rather than exclusive. NRAS, 2008–2026, is a supply-side exception within the buyer-side era. Demand-side tools from Phase 2 remain active in Phase 3. Source: AIHW Housing Policy Framework; Treasury housing policy pages; Productivity Commission First Home Ownership inquiry, 2004; Productivity Commission NHHA review, 2022.
The delivery record so far is mixed. HAFF had committed 18,650 homes after two funding rounds against a five-year target of 40,000. Most jurisdictions were behind pace on the National Housing Accord's 1.2 million home target as at March 2026. NRAS was scheduled to wind up by 30 June 2026, with no equivalent private rental incentive operating at comparable scale as it wound down. Completions fell to 172,657 in 2025, even as approvals recovered to 197,307.
The pattern across all three phases is consistent: social housing's share of Australian households fell from 4.7% to 4.0% over a period in which significant new programme commitments were announced, buyer-side take-up reached record levels, and approvals swung from peak to trough and back again. The official data records what happened. It does not resolve the question of what would have happened otherwise.
General information only. This article is intended for general informational purposes only. It summarises publicly available housing policy and statistics and does not constitute financial, legal, or professional advice. Data, figures, programme details and policy descriptions were accurate to the best of Build Street's knowledge as at the date of publication. Housing schemes, eligibility criteria, funding amounts and delivery status may change. Readers should check the relevant government source before relying on scheme details or eligibility information.
References
- AIHW – Housing policy framework
- AIHW – Housing Assistance in Australia 2026 summary
- AIHW – Social housing dwellings
- Treasury – Reform of Commonwealth-State Financial Regulations
- Treasury – Supporting people into home ownership
- Treasury – National Rental Affordability Scheme
- Treasury – Delivering the National Housing Accord
- Treasury – Housing Support Program
- Treasury – Social Housing Accelerator
- Treasury – National Agreement on Social Housing and Homelessness
- Housing Australia – HGS Trends and Insights Report 2024–25
- Housing Australia – Funding under the Housing Australia Future Fund
- DSS – NRAS Quarterly Performance Report, March 2026
- Productivity Commission – First Home Ownership inquiry report
- ABS – Building Approvals, Australia, April 2026
- ABS – Building Activity, Australia, December Quarter 2025
- ABS – Lending Indicators, March Quarter 2026
- Productivity Commission – In need of repair
- NHSAC – State of the Housing System 2026
Chart Snapshots