How many home warranty insurance claims are made in Australia?
Home warranty insurance schemes are administered separately by each Australian jurisdiction. All jurisdictions except Tasmania currently have a scheme in force. Among the sources reviewed, Queensland, Victoria, New South Wales and South Australia publish usable home-warranty claims figures.
Queensland received 1,964 claims in 2024-25, down 28% from a peak of 2,745 in 2022-23. Large builder insolvencies also had a substantial effect on claims activity in Victoria and South Australia.
QLD received claims
1,964
Queensland Home Warranty Scheme, 2024-25
QBCC · 2024–25QLD five-year peak
2,745
Received claims, 2022-23, before falling 28% by 2024-25
QBCC · 2022–23VIC median settlement
$34,942
Accepted historical DBI claims, as at October 2024
VAGO · Oct 2024Porter Davis claims
1,932
Received by VMIA by June 2023, approximately a year’s worth of claims
VMIA · Jun 2023What home warranty insurance covers in Australia
The claim triggers, cover limits and defects liability periods behind these figures, compared across all seven state and territory schemes.
Read full article →Home warranty insurance by state
Thresholds, cover and maximum payouts compared across every Australian jurisdiction, relevant to Queensland’s rising claim costs.
Read full article →SECTION 01 · OVERVIEW
Home warranty insurance claims by state and territory
Four of Australia’s eight states and territories publish usable home warranty insurance claims data: Queensland, Victoria, New South Wales and South Australia. However, the figures use different measures and cannot be combined into a national total or used to rank scheme performance.
Queensland publishes the most complete series: received claims rose from 1,537 in 2020-21 to a peak of 2,745 in 2022-23, then fell 28% to 1,964 in 2024-25. Victoria received 14,342 claims over the five years to 2023-24. New South Wales’ combined notifications and claims rose from 769 to 928 between 2017-18 and 2018-19. South Australia paid a record $18.7 million in claims in 2024-25, largely linked to a single builder’s insolvency.
Every jurisdiction except Tasmania has some form of home warranty or building indemnity insurance scheme in force. Each state and territory administers its own scheme, under its own name, with its own rules. The figures are not directly comparable because they cover different reporting periods, use different claim definitions and reflect different scheme structures and reporting methodologies.
Home warranty insurance claims dashboard: all states and territories
Click a jurisdiction to see its scheme name and data status.
Source: QBCC, VMIA, VAGO, SIRA, Consumer and Business Services (SA), and government scheme pages for Western Australia, Tasmania, the Australian Capital Territory and the Northern Territory.
Why the state figures are not directly comparable
Australia does not publish a single national annual claims total. Each state and territory operates its own scheme, with different reporting periods, claim definitions, claim triggers and reporting methodologies. The dashboard above is a compilation of the available official statistics for each jurisdiction, not a set of directly comparable national totals.
The schemes also differ in structure, not just in the data they publish. Some rely on a government monopoly insurer, others on privately underwritten policies, and Tasmania currently has no scheme at all.
Different triggers
Claims are triggered by different events across states: incomplete or defective work in Queensland, builder death, disappearance, insolvency or failure to comply with an eligible tribunal order under Victoria’s historical DBI terms, and death, disappearance, insolvency or licence suspension following non-compliance with a court or NCAT money order in New South Wales.
A defect claim and an insolvency-triggered claim are not the same event, so counting them the same way across states would combine genuinely different risks.
Different cover periods
Cover periods and claim thresholds vary by state and by defect type, so a claim reported this year can relate to work insured under different rules in different states.
Home warranty cover is multi-year and long-tail everywhere, but the exact number of years and the value thresholds that trigger cover differ by jurisdiction.
Different published measures
“Received”, “resolved” and “notifications combined with claims” are three different measures, and each state publishes a different one as its headline figure.
Queensland publishes received claims. Victoria publishes resolved claims alongside a separate five-year received aggregate. New South Wales’ most recent downloadable report combines notifications with claims into one number.
Different denominators
Queensland is the only reviewed source providing exact issued-policy counts alongside exact claims counts across the same years, so an exact same-year claims-to-policies activity ratio can only be calculated for Queensland.
VMIA reports over 74,000 certificates and over 3,500 resolved claims for Victoria in 2024-25, but these are lower-bound figures on a different claims measure (resolved rather than received), so they cannot be combined with Queensland’s exact received-claims ratio into a single comparable rate.
SECTION 02 · INSOLVENCY
How builder insolvencies affect home warranty insurance claims
Builder insolvency is the trigger most consistently linked to home warranty claim spikes in the sources reviewed. New South Wales’ regulator, SIRA, states that insolvency is the primary cause of home building compensation claims.
Porter Davis Homes collapsed in March 2023, generating 1,932 claims by June 2023. VMIA describes this as equivalent to approximately one year’s worth of claims in a single event, and one of Australia’s largest builder insolvencies.
1,932
Porter Davis Homes claims following the March 2023 collapse
VMIA received 1,932 claims from Porter Davis Homes customers by June 2023, after the builder’s March 2023 collapse. VMIA describes this as equivalent to approximately one year’s worth of claims, and one of the largest builder insolvencies in Australia’s history.
Historical DBI · VMIA, by Jun 2023Builder insolvencies in Victoria by financial year, 2017-18 to 2023-24
Figures are transcribed from a labelled bar chart in the source, not a data table.
Source: Victorian Ombudsman, investigation into VMIA’s management of domestic building insurance claims, Figure 6.
Insolvencies fell to a low of 49 in 2020-21, then nearly doubled to 93 by 2022-23, the year of the Porter Davis collapse. The insolvency and claims figures provide related context, but they do not establish a direct annual relationship. One large builder failure can materially affect claims without producing a comparable increase in the number of insolvencies.
2017-18 to 2019-20
Victorian builder insolvencies increased before the Porter Davis collapse
Builder insolvencies rose from 59 in 2017-18 to 82 in 2019-20, according to the Victorian Ombudsman.
March 2023
Porter Davis Homes collapse
VMIA received 1,932 claims by June 2023 following what it describes as one of the largest builder insolvencies in Australia’s history. Victorian builder insolvencies (93) were highest in this same year of the seven years shown.
2024-25
Shangri-La insolvency increased Victorian claims
VMIA’s 2024-25 annual report states that DBI claims significantly exceeded expectations in 2024-25, driven mainly by the Shangri-La insolvency. VMIA does not publish an exact claims count for this event, unlike Porter Davis.
2024-25
NSW construction insolvency figures
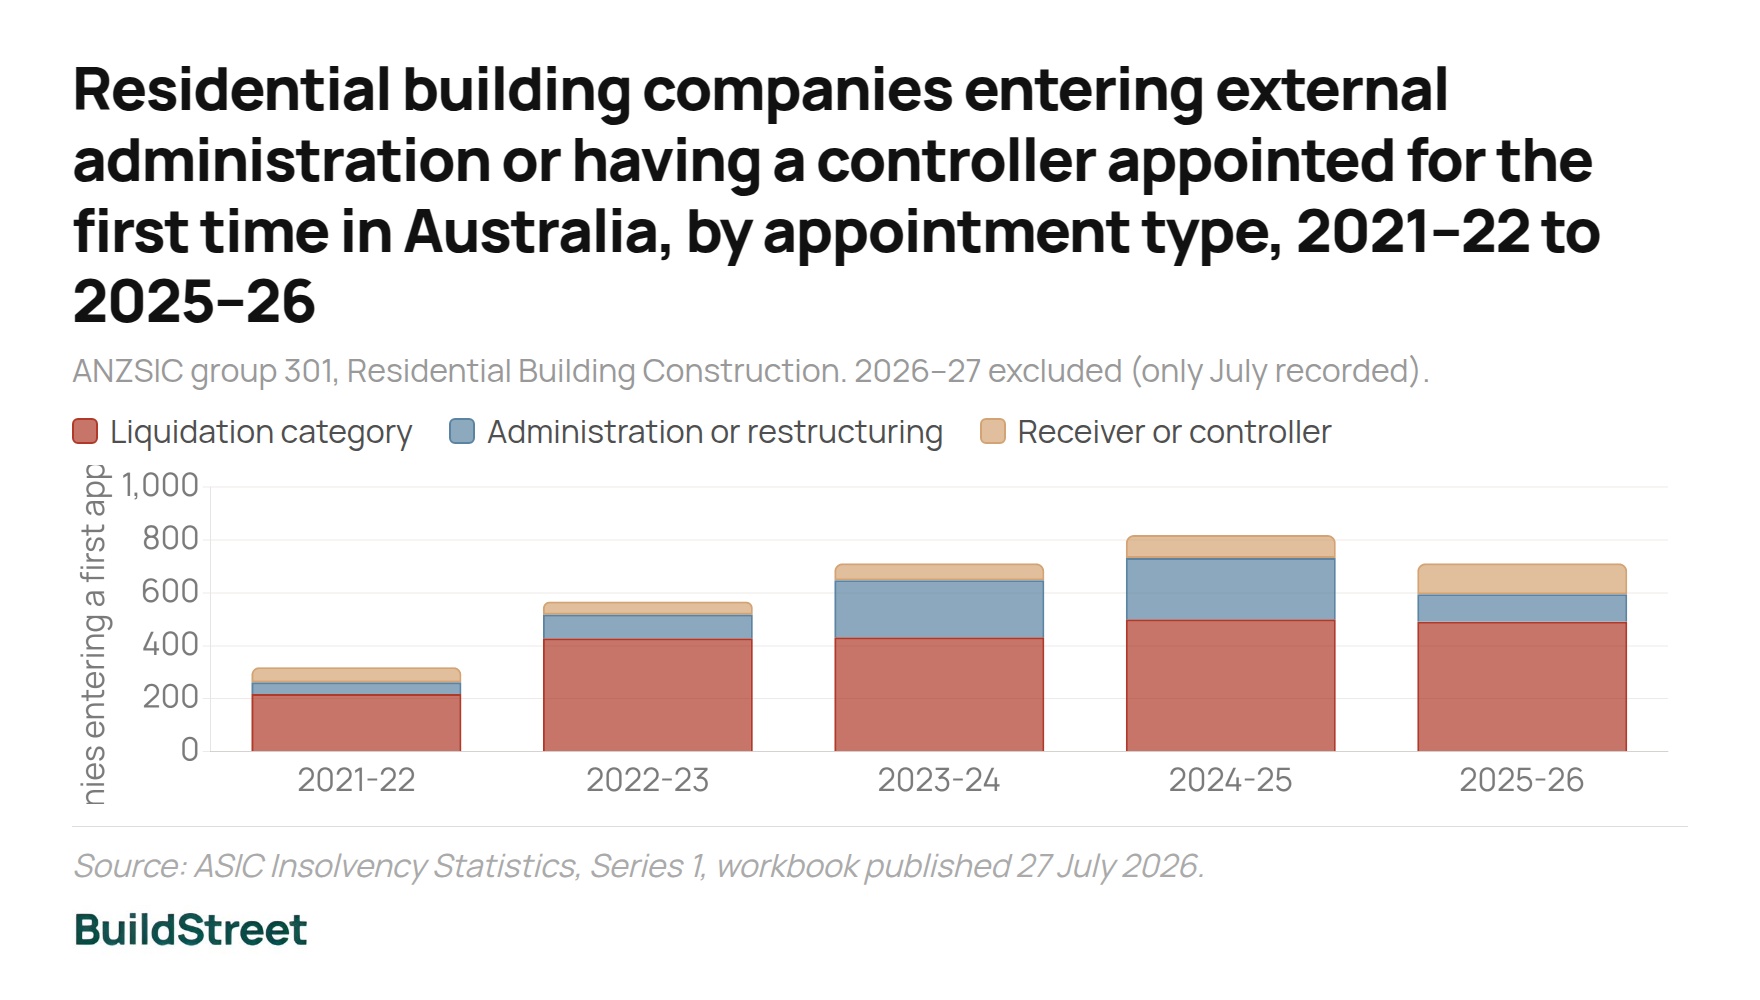
SIRA’s 2024-25 Annual Report shows that 1,567 NSW construction companies entered external administration for the first time in 2024-25, an 11% increase, against a national increase of 20.8%.
2023 to 2025
South Australian builder insolvencies
The South Australian Government paid $18.7 million in Building Indemnity Insurance claims in 2024-25, describing it as a record. A single builder’s 2023 insolvency alone generated 251 claims, and over 100 further claims followed from other builder collapses in the 12 months to July 2025.
2024-25
ASIC construction insolvency reports
ASIC recorded 2,361 initial external administrators’ and receivers’ reports for the construction industry nationally, including 1,128 in New South Wales and 651 in Victoria. This is a broader measure of company failure across the construction sector, not a count of insured home builders or home warranty claims.
South Australia Building Indemnity Insurance claims by insolvency event, 2023 to 2025
Claim counts tied to specific builder insolvencies, not a recurring annual series. The second figure is a lower bound.
Source: Consumer and Business Services (SA), media release, July 2025.
What the insolvency and claims figures show
These are separate counts from separate sources, not a single tested model linking insolvencies to claims. SIRA’s statement that insolvency is the primary cause of its claims is a regulator’s own assessment; the ASIC, Victorian and South Australian figures are context, not a measured national correlation.
SECTION 03 · CLAIM RATES
Can Australian states be compared by home warranty claim rate?
Queensland is the only reviewed jurisdiction that provides an exact same-year claims-to-policies activity ratio. Victoria, New South Wales and South Australia publish claims volumes or event-linked figures without a comparable exposure base, so the available data does not support a true state-by-state home warranty claim-rate ranking.
Queensland
Queensland provides the most complete data for calculating a same-year activity ratio, pairing an exact received-claims count with an exact issued-policy count in the same publication. Its same-year activity ratio was 1.20 claims per 100 policies in 2024-25, down from a peak of 1.83 in 2022-23. This is an activity indicator only, not an actuarial claim rate, because home warranty claims are long-tail and can relate to policies issued in earlier years.
QLD claims per 100 policies
1.20
Same-year activity ratio, 2024-25, not a cohort claim rate
Calculated · QBCC 2024–25QLD claims per 100 policies
1.83
Same-year activity ratio, 2022-23 peak
Calculated · QBCC 2022–23Victoria
Victoria does not publish a directly comparable rate. VMIA reports over 74,000 certificates issued and over 3,500 resolved claims for 2024-25, but these are lower-bound figures on a different measure (resolved rather than received) and cannot be converted into a same-year claims-to-policies activity ratio.
New South Wales
New South Wales’ most recent downloadable figures, combined notifications and claims rising from 769 in 2017-18 to 928 in 2018-19, are not published alongside an issued-policy count for those years, so no rate can be calculated.
South Australia
South Australia’s figures, $18.7 million paid in claims in 2024-25 and 251 claims linked to a single builder’s 2023 insolvency, are tied to specific events rather than a published policy base, so they also cannot be converted into a rate.
Why no state can be ranked on claim rate
Ranking states by claim rate would require the same exposure base, issued policies, published alongside claims for the same period. Only Queensland publishes both, so it is the only jurisdiction with a genuine activity ratio in the sources reviewed. Raw claims volumes therefore cannot show whether one state has a higher or lower claim rate than another.
SECTION 04 · QUEENSLAND
Queensland’s Home Warranty Scheme explained
The Queensland Home Warranty Scheme is a government monopoly administered by the Queensland Building and Construction Commission (QBCC), covering residential building work valued at more than $3,300, including labour, materials and GST.
Unlike most other Australian schemes, Queensland operates a first-resort model. A homeowner can claim for incomplete or defective work, without first needing the builder to die, disappear or become insolvent. Standard cover is $200,000, with up to $300,000 available through optional additional cover.
Queensland Home Warranty Scheme claims and exposure indicators, 2020-21 to 2024-25
| Financial year | Received claims (issued policies) | Approved claims $m (premiums $m) |
|---|---|---|
| 2020-21 | 1,537 (168,468) | $31.3m ($140.9m) |
| 2021-22 | 1,856 (150,171) | $35.1m ($142.7m) |
| 2022-23 | 2,745 (150,164) | $68.6m ($150.3m) |
| 2023-24 | 2,299 (150,825) | $88.7m ($169.1m) |
| 2024-25 | 1,964 (164,050) | $60.7m ($198.3m) |
Source: Queensland Building and Construction Commission, Annual Report 2024-2025, Table 21.
Queensland’s same-year activity ratio was 1.20 claims per 100 policies in 2024-25, down from a peak of 1.83 in 2022-23. Issued policies fell from 168,468 in 2020-21 to around 150,000 across the following three years, before rising to 164,050 in 2024-25. Premiums increased every year from $140.9 million to $198.3 million, an increase of 41%, while received claims declined after the 2022–23 peak.
Queensland’s approved claim costs rose from $31.3 million in 2020-21 to $88.7 million in 2023-24, up 183%, before falling 32% to $60.7 million in 2024-25.
Non-completion accounted for most approved claim costs during the peak years. It represented an estimated 69% of approved costs in 2022-23 and 71% in 2023-24, before falling to 52% in 2024-25 as defective-work costs rose to 39% of the total. These shares are calculated from the published dollar figures by cause.
The published cause categories do not always sum exactly to the stated total. In 2021-22, defective work, non-completion and subsidence sum to $36.0 million against a published total of $35.1 million, a $0.9 million difference the source does not explain. Both figures are retained as published.
Approved home warranty claim costs by cause, Queensland, 2020-21 to 2024-25 ($ millions)
The 2021-22 category values sum to $36.0m against a published total of $35.1m; both figures are retained as published.
- Defective work
- Non-completion
- Subsidence
Source: Queensland Building and Construction Commission, Annual Report 2024-2025, Table 21.
Falling claims do not measure changes in building quality
Home warranty claims are long-tail: a claim received in 2024-25 can relate to a policy issued years earlier, and policy exposure changes from year to year. Claims and approved costs therefore measure scheme activity, not building quality or future claims risk.
SECTION 05 · VICTORIA
How many home warranty insurance claims are made in Victoria?
Victoria’s historical Domestic Building Insurance (DBI) scheme received 14,342 claims between 2019-20 and 2023-24. This is a five-year aggregate rather than an annual series, and a homeowner may lodge more than one claim.
DBI is a last-resort scheme: existing policies cover loss where a builder died, disappeared, became insolvent or failed to comply with an eligible tribunal order. From 1 July 2026, Victoria’s new Home Warranty scheme applies to eligible contracts signed on or after that date. It may cover incomplete, defective or non-compliant work where the builder fails or refuses to complete or fix it, which is broader than historical DBI claim triggers. The Building and Plumbing Commission (BPC) administers both schemes; VMIA administered DBI historically.
Median settlement
$34,942
Accepted historical DBI claims, as at October 2024, the more typical figure
VAGO · Oct 2024Mean settlement
$61,698
Accepted historical DBI claims, as at October 2024, 76.6% above the median
VAGO · Oct 2024At least half of accepted claims had settlement amounts at or below the $34,942 median. The $61,698 mean was 76.6% higher, consistent with higher-value settlements lifting the average.
Victoria claim disposition, as at October 2024
Share of the 14,342 claims received 2019-20 to 2023-24; the remaining balance was still to be assessed.
Source: Victorian Auditor-General’s Office, Domestic Building Insurance (2025).
Victoria resolved over 3,500 claims in 2024-25. However, this annual resolved-claims figure is not directly comparable with the five-year received-claims total above.
VIC certificates issued
1,000,000+
Historical DBI certificates issued, 2010 to 2024-25
VMIA · to 2024–25VIC claims resolved
23,600+
Cumulative historical DBI claims resolved, 2010 to 2024-25
VMIA · to 2024–25VIC payments to homeowners
$940m+
Cumulative historical DBI payments to homeowners, 2010 to 2024-25
VMIA · to 2024–25Why there is no national average home warranty claim value
No single national average home warranty claim value was located in the sources reviewed. Queensland’s approved claim dollars cannot be divided by its received-claims count to produce a comparable average, because claims received in one year are approved and paid in a different year and cohort.
SECTION 06 · NEW SOUTH WALES
New South Wales home warranty insurance claims and payments
New South Wales’ Home Building Compensation (HBC) scheme is delivered through icare’s Home Building Compensation Fund and regulated by the State Insurance Regulatory Authority (SIRA). It is a last-resort scheme: a claim requires builder death, disappearance, insolvency, or licence suspension following non-compliance with a court or NCAT money order.
Insurance is required for work valued at more than $20,000, including GST, with a statutory minimum cover of $340,000.
New South Wales combined notifications and claims by year, 2017-18 to 2018-19
Combined figure, not claims alone; the most recent years with a downloadable annual count.
Source: State Insurance Regulatory Authority, Home building compensation scheme report for the year 2018-2019.
Major defect claims accounted for 174 of the 928 combined notifications and claims reported in 2018-19. Current claims are published via an interactive dashboard, not a downloadable annual count.
New South Wales · 2018-19
$49m total payments
All home building compensation claim payments in 2018-19, the most recent year this cause breakdown was published as a downloadable report.
Source: SIRA, 2018-2019 scheme report.
NSW · major defect share
72% ($35m)
Major defect claims accounted for 72% of 2018-19 claim payments, with incompletion claims accounting for a further 18% ($9m).
Source: SIRA, 2018-2019 scheme report.
Current NSW cause breakdown
Not published as a downloadable series
Current NSW claims data is published via an interactive dashboard rather than a report with a cause-of-payment breakdown.
Source: SIRA HBC open data.
Comparable claims-by-cause data is limited outside Queensland
Comparable cost-by-cause detail to Queensland’s is not published for other states. New South Wales’ 2018-19 breakdown, shown above, is the closest official comparator identified in the sources reviewed.
SECTION 07 · COVERAGE COMPARISON
Home warranty insurance thresholds and coverage limits by state
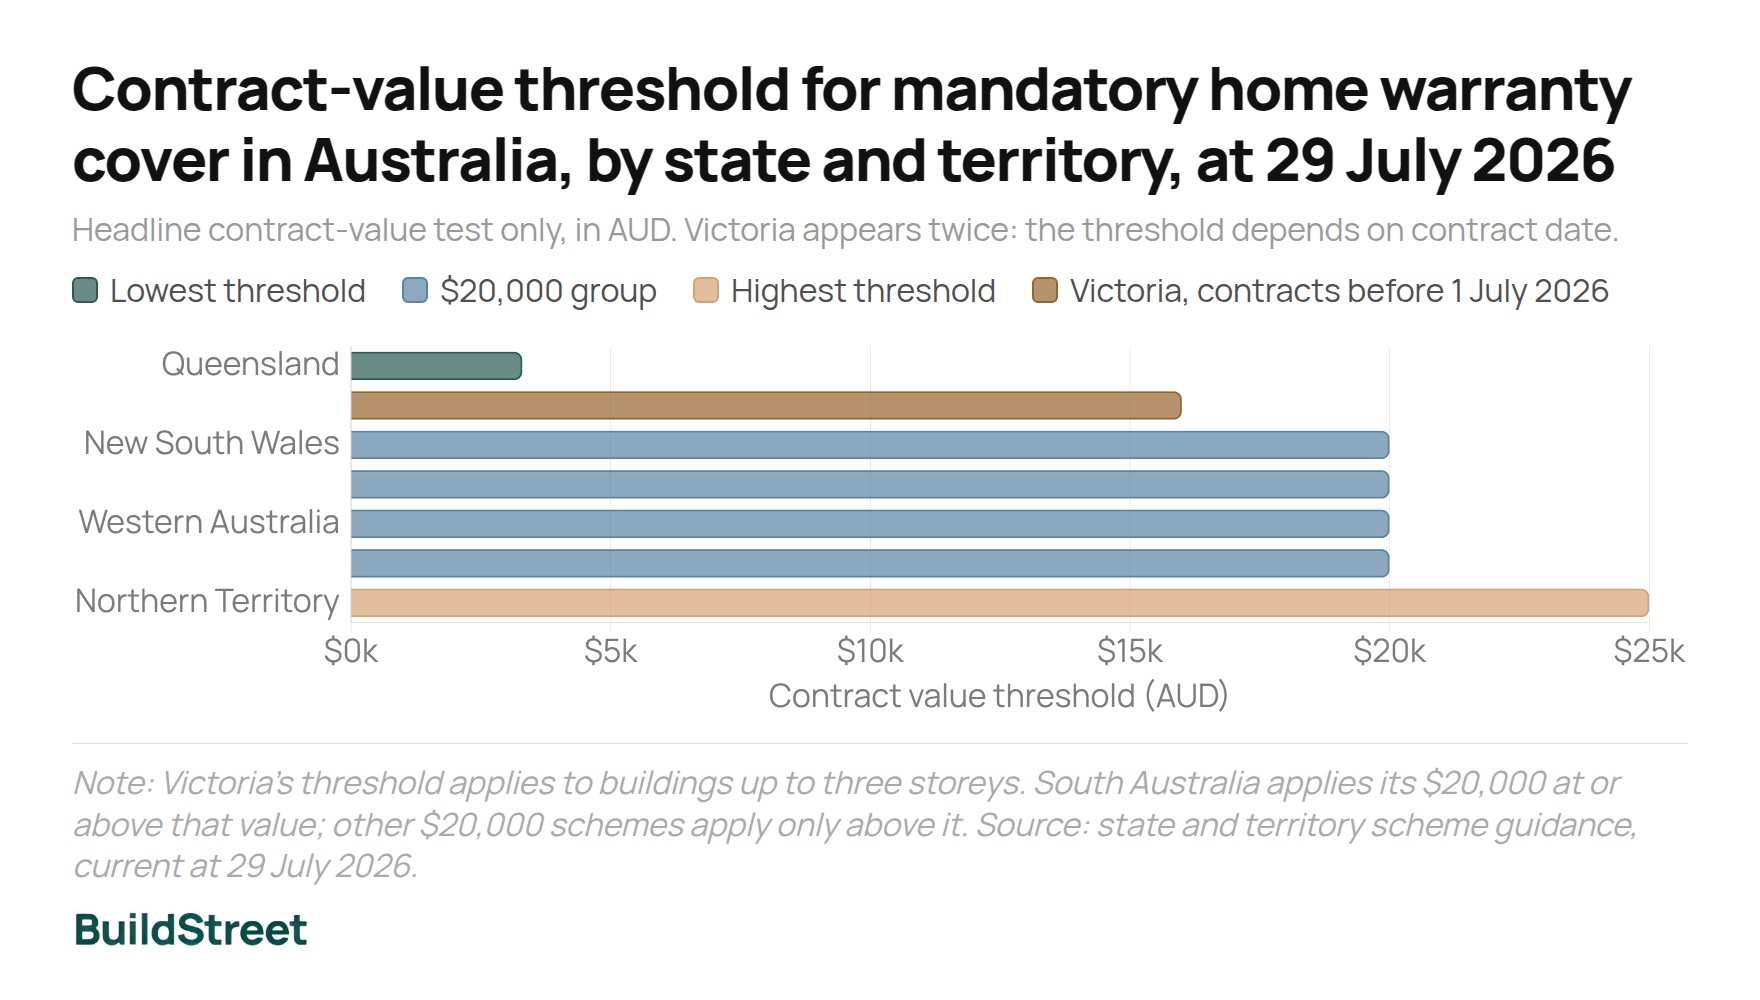
Home warranty insurance thresholds and coverage limits vary across Australia. Coverage caps range from $200,000 in several states to $400,000 under Victoria’s incoming Home Warranty scheme, and eligibility thresholds range from $3,300 in Queensland to $25,000 for newer Northern Territory certificates.
Thresholds and cover amounts change periodically as governments review their schemes.
Home warranty insurance eligibility and coverage requirements across Australia
| Jurisdiction | Insurance required for work valued at | Coverage requirement |
|---|---|---|
| Queensland | More than $3,300, including labour, materials and GST | $200,000 standard cover; $300,000 available with optional additional cover |
| Victoria | More than $20,000 for eligible contracts signed from 1 July 2026 | $400,000 total cover per home under Home Warranty |
| New South Wales | More than $20,000, including GST | $340,000 statutory minimum cover |
| Western Australia | More than $20,000, subject to statutory exemptions | $200,000 for incomplete or defective work; $40,000 for lost deposits |
| South Australia | More than $20,000, following an increase from $12,000 in November 2025, and development approval is required | $250,000 policy limit for new QBE policies issued from 1 October 2025 (existing QBE policies retain the $150,000 limit) |
| Tasmania | Not applicable; no scheme in force | Not applicable |
| Australian Capital Territory | $12,000 or more, for approval-required work of three storeys or fewer | $200,000 minimum cover for certificates issued from 1 January 2025 |
| Northern Territory | More than $25,000 for certificates issued after 30 March 2026; the former $12,000 threshold applies to earlier certificates | Cover capped at $200,000 for non-completion and defects combined |
Source: As cited for each jurisdiction. Thresholds and cover amounts change periodically; figures are dated to the source reviewed.
Home warranty scheme rules across Australian states, current schemes as at 29 July 2026
| Jurisdiction | Scheme name & administration | Main claim trigger |
|---|---|---|
| Queensland | Queensland Home Warranty Scheme; government monopoly administered by the QBCC | Incomplete or defective work (first-resort model) |
| Victoria | Home Warranty from 1 July 2026 (previously Domestic Building Insurance); administered by the Building and Plumbing Commission | Builder unable or unwilling to complete or rectify work; historical DBI terms covered death, disappearance or insolvency, or failure to comply with an eligible tribunal order |
| New South Wales | Home Building Compensation scheme; government insurer icare, regulated by SIRA | Builder death, disappearance, insolvency, or licence suspension following non-compliance with a court or NCAT money order |
| Western Australia | Home Indemnity Insurance; privately underwritten, administered by Building and Energy | Builder death, disappearance or insolvency; cancellation or non-renewal of registration where the builder failed the prescribed financial requirements |
| South Australia | Building Indemnity Insurance; privately underwritten with government reinsurance, regulated by Consumer and Business Services | Builder death, disappearance or insolvency |
| Tasmania | No scheme currently in force; the previous scheme was abolished in 2008, and a 2023 replacement had not commenced in the sources reviewed | Not applicable |
| Australian Capital Territory | Residential building work insurance or Master Builders Fidelity Fund; privately administered with government oversight | Builder insolvency, death or disappearance |
| Northern Territory | Residential Building Cover via Fidelity Fund NT; an industry-run trust underwritten by the NT Government | Builder bankruptcy, death, disappearance or deregistration |
Source: QBCC; VMIA and BPC; SIRA; Building and Energy (WA); Consumer and Business Services (SA); Tasmanian Department of Justice; ACT EPSDD; Northern Territory Government and Fidelity Fund NT.
Tasmania has no home warranty insurance scheme in force
Tasmania abolished its previous scheme in 2008. Replacement legislation was passed in 2023, but no commencement proclamation was identified in the sources reviewed.
A separate government Financial Assistance Package may apply to eligible consumers affected by certain builder deaths, disappearances or insolvencies since 1 July 2021. The package is not home warranty insurance, and its payments are not included in this article’s claims figures.
Coverage limits do not indicate claim rates
A higher or lower coverage limit does not show whether a jurisdiction has a higher or lower claim rate. Queensland is the only reviewed source pairing an exact claims count with an exact issued-policy count across the same five years, which is why a precise same-year claims-to-policies activity ratio could only be calculated there.
SECTION 08 · CONSUMER PROTECTION
How home warranty claims data is published across Australia
Scheme design differs across Australia. Queensland operates a first-resort model, allowing claims for eligible incomplete or defective work. Most other jurisdictions use last-resort schemes, where claims generally depend on events such as builder death, disappearance or insolvency.
The table below shows what claims data each jurisdiction publishes and the main measure available.
Home warranty claims data publication across Australian states, as at 29 July 2026
| Jurisdiction | Publisher & format | Main measure & currency |
|---|---|---|
| Queensland | QBCC annual report table | Received claims and approved claim dollars; exact five-year series, current to 2024-25 |
| Victoria | VMIA annual report; VAGO and Ombudsman oversight reports | Mixed measures: resolved claims, five-year aggregates, event-specific figures (historical DBI) |
| New South Wales | SIRA; historically an annual PDF report. The SIRA Board approved open-data publication in May 2025, with new arrangements from 2025-26 | Current data is interactive only; the last downloadable cause breakdown is 2018-19 |
| South Australia | Consumer and Business Services; a media release, not a regular report | Total claims paid in dollars, and claim counts tied to specific builder insolvencies; not a recurring series |
| Western Australia | Building and Energy scheme pages reviewed | No claims figures identified in the sources reviewed |
| Tasmania | No scheme in force; not applicable | No claims figures possible while no scheme operates |
| Australian Capital Territory | ACT Government scheme pages reviewed | No claims figures identified in the sources reviewed |
| Northern Territory | Northern Territory Government and Fidelity Fund NT pages reviewed | No claims figures identified in the sources reviewed |
Source: QBCC, VMIA, VAGO, Victorian Ombudsman, SIRA, Consumer and Business Services (SA), and government scheme pages for Western Australia, Tasmania, the ACT and the Northern Territory, reviewed as at 29 July 2026.
What claims data cannot measure
Claim and insolvency figures are activity indicators. They do not directly measure building quality, scheme solvency, claims-handling fairness or future claims risk. Differences in reporting also prevent reliable comparisons of consumer protection between jurisdictions.
About the data
The figures come from separate state and territory schemes and do not form a single national series. Official data does not provide: a national annual claims total; a comparable claim rate across jurisdictions; a current New South Wales cause-of-payment breakdown after 2018–19; or published claims figures for Western Australia, the Australian Capital Territory or the Northern Territory. Tasmania has no scheme in force. Figures reported as “over” or “more than” remain lower bounds. Percentage changes are calculated from the published figures.
General information only
This article is based on publicly available official sources, including state and territory building and insurance regulators, audit and oversight bodies, and Victoria’s Building and Plumbing Commission. It is general information only and does not constitute financial, building or legal advice.
References
- Queensland Building and Construction Commission, Annual Report 2024-2025 — Table 21, used for received claims, issued policies, premiums and approved claim costs by cause, 2020-21 to 2024-25.
- Victorian Managed Insurance Authority, Annual Report 2024-25 — used for 2024-25 resolved claims, payments and certificates, the Porter Davis claim count, cumulative figures since 2010, and the Shangri-La insolvency reference.
- Victorian Auditor-General’s Office, Domestic Building Insurance (2025) — used for the five-year claim aggregate, claim disposition shares, and the median and mean accepted-claim settlement.
- Victorian Ombudsman, investigation into VMIA’s management of domestic building insurance claims — used for annual Victorian builder insolvency counts, Figure 6.
- Building and Plumbing Commission (Victoria), Domestic Building Insurance and Home Warranty — used for Victoria’s transition from DBI to Home Warranty on 1 July 2026.
- State Insurance Regulatory Authority, Home building compensation scheme report for the year 2018-2019 — used for historical NSW notifications and claims and the 2018-19 cause-of-payment breakdown.
- State Insurance Regulatory Authority, Annual Report 2024-25 — used for NSW 2024-25 insolvency comparator figures and the open-data publication timeline.
- State Insurance Regulatory Authority, Home Building Compensation open data — current interactive NSW claims data.
- Consumer and Business Services (South Australia), media release, 11 July 2025 — used for South Australia’s 2024-25 claims payments and builder-insolvency claim counts.
- Government of Western Australia, Home indemnity insurance fact sheet, Building and Energy — used for the WA scheme name, trigger and administration.
- Tasmanian Department of Justice, Regulatory Impact Statement: Home Warranty Insurance — used for the 2008 abolition of Tasmania’s former scheme and the Financial Assistance Package.
- Tasmanian Legislation, Residential Building (Home Warranty Insurance Amendments) Act 2023 — used to confirm the 2023 replacement scheme had not commenced.
- ACT Environment, Planning and Sustainable Development Directorate, Residential building work insurance — used for the ACT scheme name, trigger and administration.
- Northern Territory Government and Fidelity Fund NT — used for the NT scheme name, trigger and administration.
- Australian Securities and Investments Commission, Insolvency Statistics Series 3.2: selected industries, 2024-25 — used for construction industry insolvency reports by state and territory.
Chart Snapshots