How home insurance costs changed after Australia's major disasters
Home insurance premiums in northern Australia rose 178% in real terms between 2007–08 and 2018–19, more than three times the 52% increase across the rest of the country. By 2018–19, the average combined premium in northern Australia was about $2,500, compared with roughly $1,400 elsewhere.
National insurance prices then rose 16.4% in the year to March 2024, the largest annual increase since 2001. The period includes major floods, cyclones, higher rebuilding costs and increases in reinsurance costs, but official sources do not isolate each factor's contribution.
Northern premium growth
178%
Real rise, 2007–08 to 2018–19
Northern combined premium
$2,500
Average in 2018–19
Insurance CPI growth
16.4%
Year to March 2024
Affordability stress
15%
1.61m households in 2024
Home insurance costs by state
Compare premiums across 330 Australian regions.
Read full article →Climate risk and home insurance
Flood, bushfire and cyclone exposure across Australia.
Read full article →SECTION 01 · MEASURING THE MARKET
How are home insurance premiums measured in Australia?
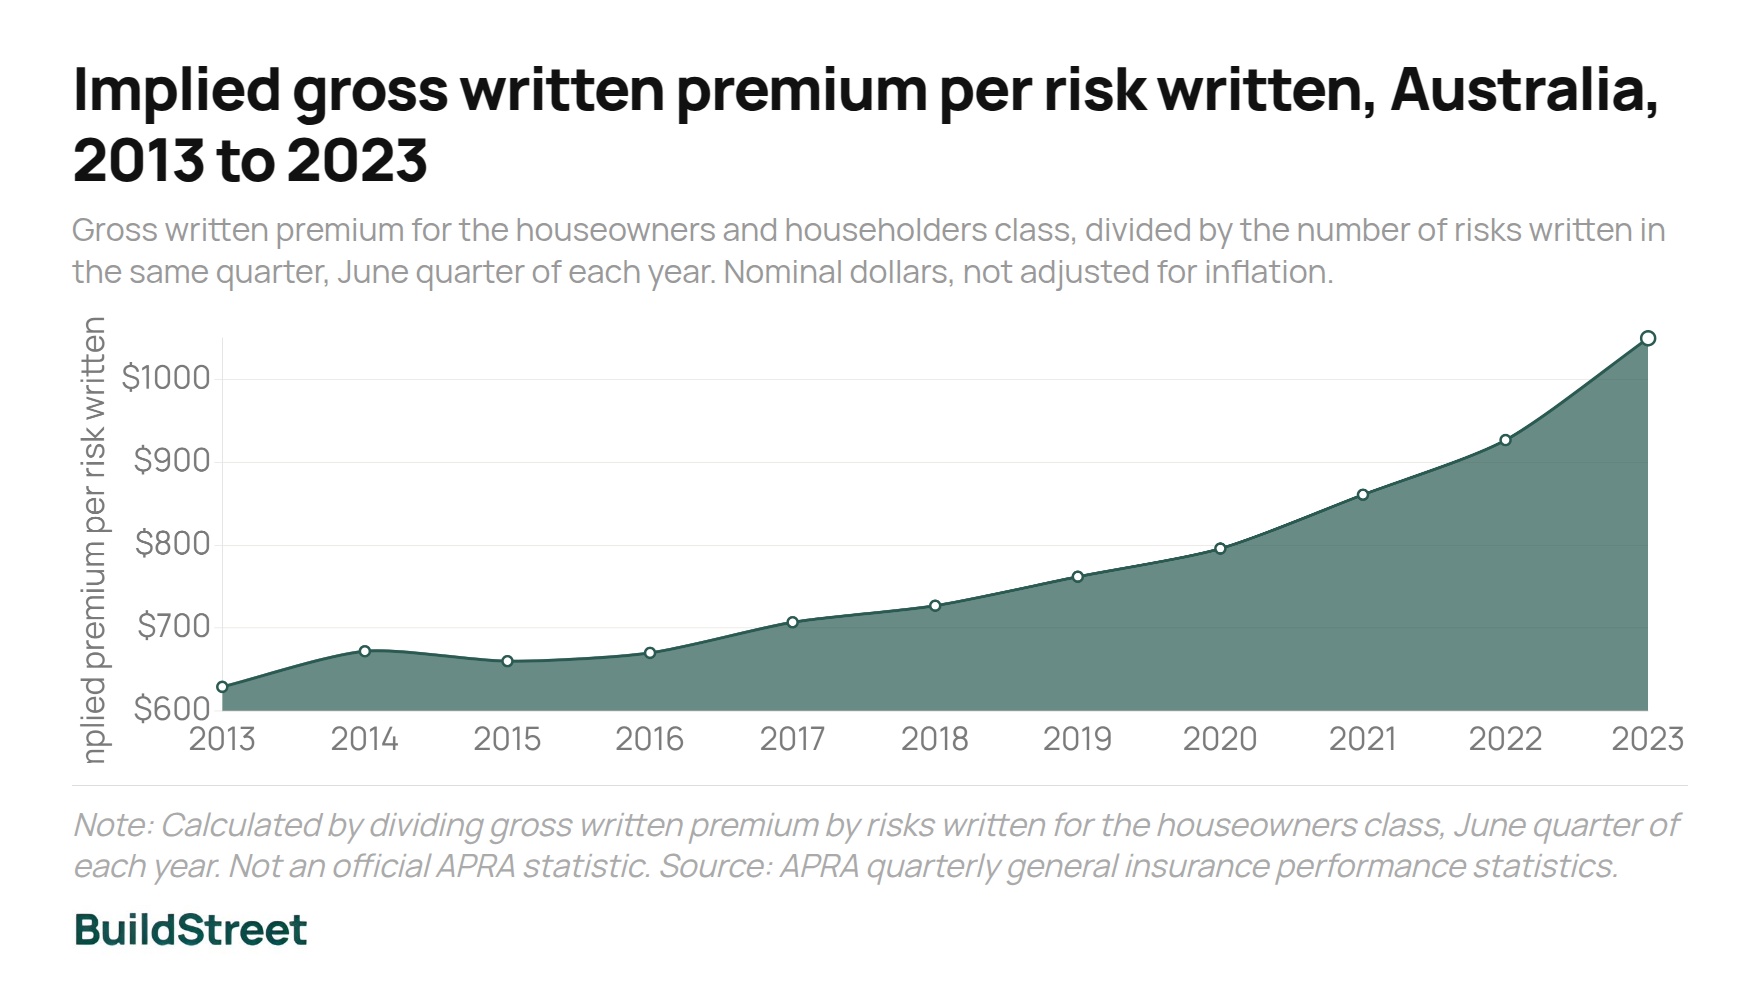
The most consistent long-term proxy rose 67% in nominal terms over the decade to 2023, from $629 to $1,050 per risk written. It is calculated from APRA industry totals and is not a published premium series.
Implied gross written premium per risk written, Australia, 2013 to 2023
June quarter of each year. Nominal dollars, not adjusted for inflation.
Source: APRA historical quarterly general insurance performance data. BuildStreet calculation; not an official APRA statistic.
No single continuous 20-year series is available
The ABS price index, ACCC premium observations and APRA insurer totals cover different periods and definitions. The APRA historical framework ended in June 2023.
SECTION 02 · CLAIMS
When were home insurance claims highest in Australia?
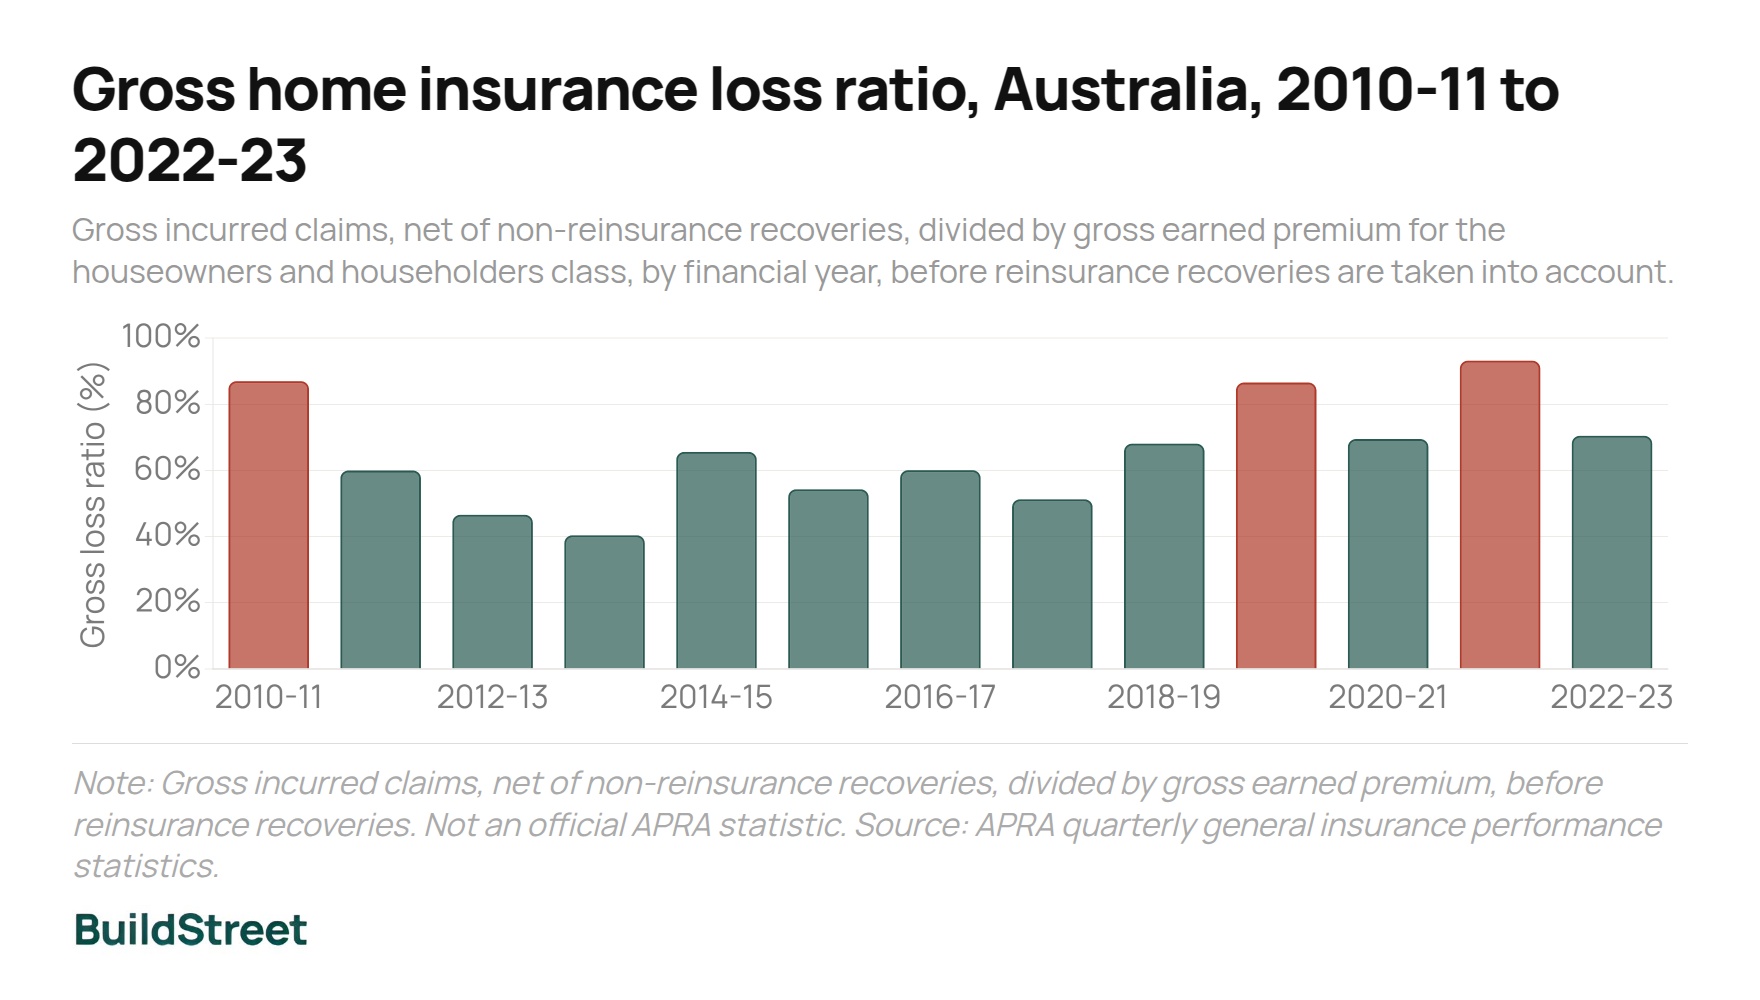
Claims equalled 93.2% of premium earned in 2021–22, the highest reading in this series. The ratio was 87% in 2010–11, the year of Queensland flooding and Cyclone Yasi, and 86.6% in 2019–20.
Gross home insurance loss ratio, Australia, 2010–11 to 2022–23
Gross incurred claims divided by gross earned premium, before reinsurance recoveries.
Source: APRA historical quarterly data. BuildStreet calculation; excludes insurer expenses and is not an official APRA statistic.
What the loss ratio represents
This industry-wide proxy compares claims with premium income before reinsurance recoveries. It excludes insurer expenses and does not measure profit.
2010–11
Queensland floods and Cyclone Yasi
Claims reached 87% of gross earned premium.
2011–12
Standardised flood cover
Insurers moved towards a standard flood definition and default inclusion.
2010–11 to 2013–14
Fastest northern premium growth
The ACCC identified this as northern Australia's fastest real premium-growth window.
December 2020
Northern Australia inquiry
The ACCC final report documented the widening premium gap.
SECTION 03 · NORTHERN AUSTRALIA
Why home insurance costs more in northern Australia
Real home premiums rose 178% in northern Australia between 2007–08 and 2018–19, against 52% elsewhere. Cyclone Yasi and widespread flooding occurred during the four-year window the ACCC identified as the fastest period of real premium growth.
Average home insurance premiums, northern Australia vs the rest of Australia, 2018–19
Average annual premium by product type, in 2018–19 dollars.
Source: ACCC Northern Australia Insurance Inquiry final report, 2020. Figures rounded to the nearest $100.
Real premium growth, 2007–08 to 2018–19
| Product | Northern Australia | Rest of Australia |
|---|---|---|
| Home insurance | +178% | +52% |
| Combined home and contents | +122% | +71% |
| Contents insurance | +33% | −3% |
Highest-premium postcode
$14,893
Hamilton Island, 2018–19
High-premium concentration
46 of 50
Top postcodes located in the north
Sum-insured gap
$80k–$100k
Higher outside northern Australia
Flood cover broadened over the same period: 97% of combined policies included it by 2018–19, up from 50% in 2008–09. That means later policies were not necessarily equivalent to earlier policies.
Stamp duty paid
$79.6m
Northern Australia, 2018–19
Non-insurance
20%
About 86,000 homes in 2016
National claims share
12%
From 5% of policies
North WA strata premium
$13,400
Average in 2018–19
Non-insurance reached 40% in north Western Australia, 26% in the Northern Territory and 17% in north Queensland. More than 95% of uninsured households surveyed identified cost as the reason.
SECTION 04 · BUSHFIRE
What bushfire data shows about home insurance costs
Commonwealth natural-disaster relief expenditure covered multiple hazards and does not isolate bushfire funding or home insurance.
Disaster relief expenditure
$5.8bn
Australian Government, 2021–22
Disaster relief expenditure
$3.6bn
Australian Government, 2022–23
Cyclones accounted for the largest share of claims costs in the available northern-Australia breakdown, followed by storms including hail. This regional evidence should not be treated as a national hazard ranking.
What the bushfire data does not show
No official source publishes a national or state series linking a specific bushfire season, including 2019–20, to a measured change in home insurance premiums.
SECTION 05 · REINSURANCE
How reinsurance costs changed for Australian home insurers
Home insurers passed 36.7% of gross earned premium to reinsurers in 2021–22, the highest share in the series, before the share fell to 32.3% in 2022–23.
Reinsurance expense as a share of home insurance premium, 2010–11 to 2022–23
Outwards reinsurance expense divided by gross earned premium.
Source: APRA historical quarterly data. BuildStreet calculation; not an official APRA statistic.
$10 billion
The government guarantee backing the Cyclone Reinsurance Pool, designed to reduce cyclone reinsurance costs and cyclone-related premiums.
SECTION 06 · BUILDING COSTS
Building costs and home insurance in Australia from 2021–2026
Building construction prices rose an estimated 37% cumulatively in the five years to March 2026. Annual growth peaked at 12.8% in September 2022, fell to 2.2% by June 2025 and returned to 4.2% by March 2026.
Annual change in building construction prices, Australia, 2021 to 2026
Annual percentage change in the ABS building construction output price index.
Source: ABS, Producer Price Indexes, Australia, March 2026.
Annual change in house construction prices, March 2026
| State or territory | Annual change |
|---|---|
| Australia | 4.1% |
| Tasmania | 8.8% |
| Western Australia | 6.3% |
| South Australia | 4.1% |
| Queensland | 3.9% |
| Victoria | 3.7% |
| ACT | 3.5% |
| New South Wales | 3.4% |
| Northern Territory | 2.8% |
SECTION 07 · SYNTHESIS
Home insurance cost trends and pressures in Australia
By February 2026, annual insurance price changes ranged from a 2.2% fall in Perth to a 4.4% rise in Brisbane. The measure combines house, contents and motor vehicle insurance, so it is not a home-only premium series.
Annual change in insurance prices by capital city, February 2026
ABS insurance CPI subgroup, covering house, contents and motor vehicle insurance combined.
Source: ABS, Consumer Price Index, Australia, February 2026.
Affordability stress
15%
More than four weeks of household income
Mitigation return
$8.10
Estimated by 2050 for each $1 invested
Storm and flood claims exceeded $12.3 billion between January 2020 and November 2022. Disaster claims, reinsurance, building costs and broader policy coverage all applied pressure, but none of the sources reviewed quantifies their individual contribution.
References
- ABS, Consumer Price Index, Australia, February 2026
- ABS, Producer Price Indexes, Australia, March 2026
- APRA, Quarterly general insurance performance statistics
- ACCC, Northern Australia Insurance Inquiry final report
- Bureau of Meteorology, floods associated with Severe Tropical Cyclone Yasi
- Bureau of Meteorology, Severe Tropical Cyclone Yasi event history
- Australian Government, Final Budget Outcome 2021–22
- Australian Government, Final Budget Outcome 2022–23
- Insurance Council of Australia, Three-year weather bill reaches $12.3 billion
- Actuaries Institute, Home Insurance Affordability and Home Loans at Risk
Chart Snapshots